
Rowing Machines Market Analysis and Size
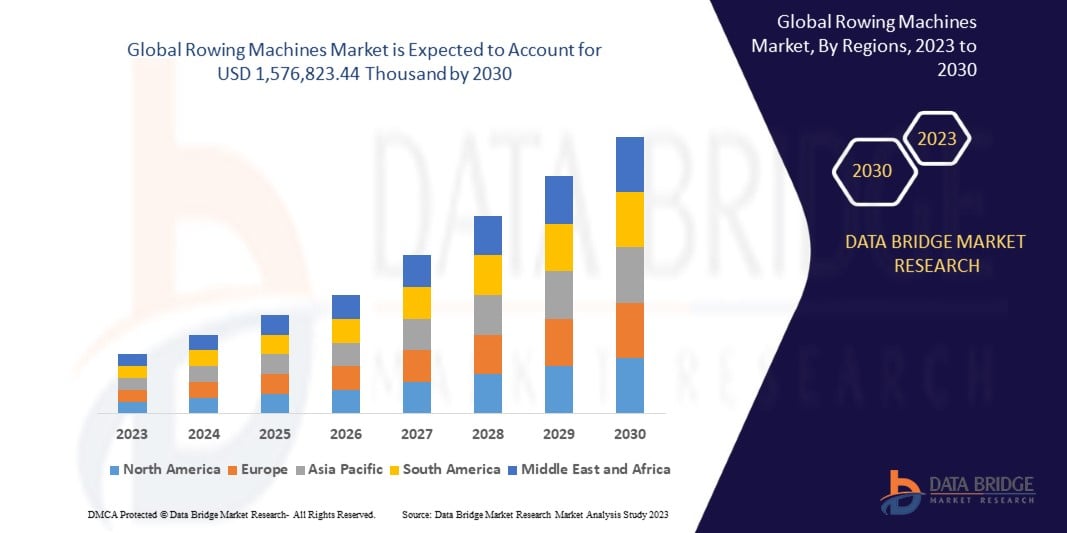
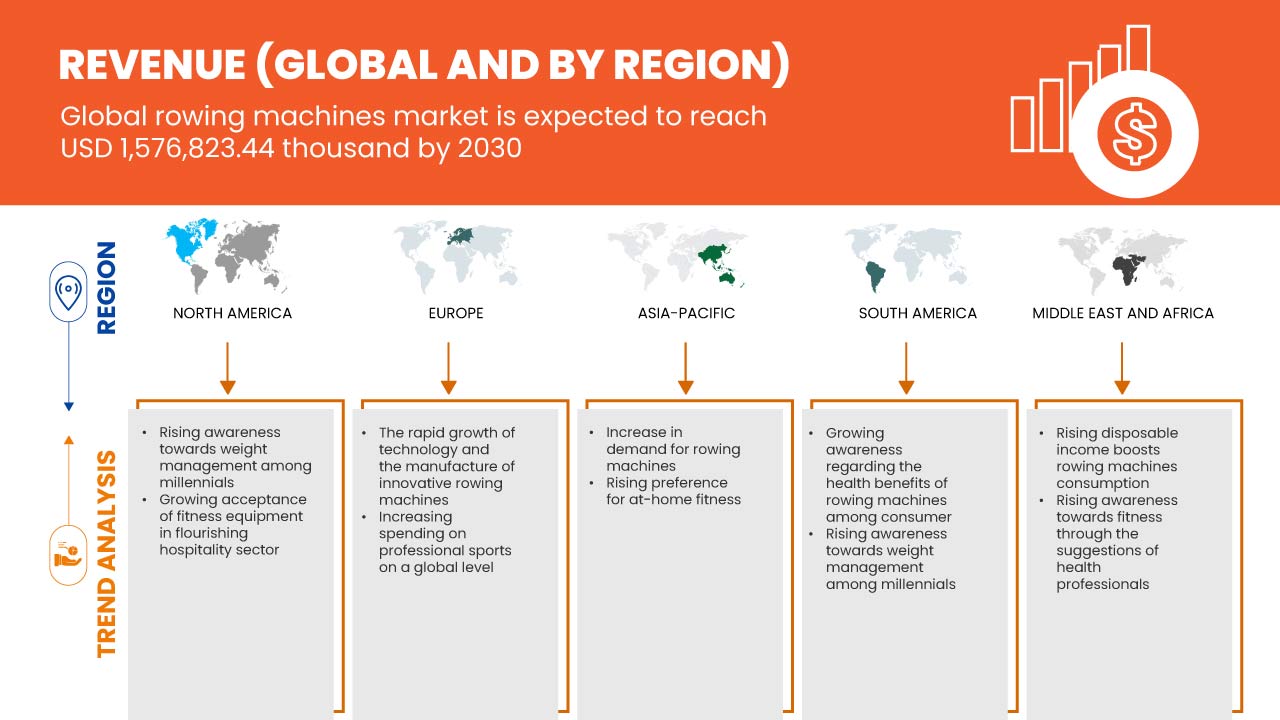
The global rowing machines market is expected to grow significantly in the forecast period of 2023 to 2030. Data Bridge Market Research analyzes that the market is growing with a CAGR of 5.0% in the forecast period of 2023 to 2030 and is expected to reach USD 1,576,823.44 thousand by 2030. The major factor driving the market growth is the rising popularity of rowing machine products among the millennials and growing awareness regarding the properties of the rowing machine products.
A rowing machine, sometimes known as a rower machine, simulates the motions of rowing and is excellent for a full-body workout. Aerobic fitness will increase with a low-impact cardiovascular workout on a rowing machine. Also, it tones and strengthens every muscle in the body. Many gyms have rowing machines that are easy to use. A rowing machine is a flexible exercise option because it is easier to transport than a treadmill or an elliptical.
The global rowing machines market report provides details of market share, new developments, and the impact of domestic and localized market players, analyzes opportunities in terms of emerging revenue pockets, changes in market regulations, products approvals, strategic decisions, product launches, geographic expansions, and technological innovations in the market. To understand the analysis and the market scenario, contact us for an analyst brief. Our team will help you create a revenue-impact solution to achieve your desired goal.
|
Report Metric |
Details |
|
Forecast Period |
2023 to 2030 |
|
Base Year |
2022 |
|
Historic Years |
2021 (Customizable to 2015 - 2020) |
|
Quantitative Units |
Revenue in USD Thousand |
|
Segments Covered |
By Type (Air, Water, Magnetic, and Hydraulic), Body Type (Metal and Solid Wood), Weight Capacity (300 to 499 Pounds, 200 to 249 Pounds, 100 to 199 Pounds, and Under 100 Pounds), Distribution Channel (Online and Offline), Resistant Level (Less Than 24 and More Than 24), Color (Black, Light Grey, and Others), End-User (Commercial and Residential) |
|
Countries Covered |
U.S., Canada, Mexico, Brazil, Argentina, rest of South America, Germany, Italy, U.K., France, Spain, Netherlands, Belgium, Switzerland, Turkey, Russia, rest of Europe, Japan, China, India, South Korea, Australia, Singapore, Malaysia, Thailand, Indonesia, Philippines, rest of Asia-Pacific, Saudi Arabia, UAE, South Africa, Egypt, Israel, and rest of Middle East and Africa |
|
Market Players Covered |
BODYCRAFT, Johnson Health Tech, Nautilus, Inc., Mr Captain Brand, Stamina Products, Inc., Sunny Health and Fitness, iFIT Inc., York Fitness UK, Infiniti, Concept2 inc., WaterRower, RP3 Rowing, Peloton Interactive, Inc., ERGATTA, AVIRON INTERACTIVE INC., TECHNOGYM S.p.A, Hydrow, Oartec, Decathlon, Intense Enterprises, HAMMER Sport AG, Tunturi New Fitness, adidas AG., Cosco (India) Limited, Life Fitness, Pure Design Fitness, TOPIOM, Modcon Industries Private Limited, Shandong DHZ Fitness Equipment Co., Ltd, KAYA, SHUA, and SHANDONG BAODELONG FITNESS CO., LTD among others |
Market Definition
Rowing machines, also known as ergometers or ergs, use the upper and lower body on every stroke. An indoor rower or rowing machine is a machine used to stimulate the action of watercraft rowing for the purpose of exercise or training for rowing. This helps in strengthening, toning the muscles, and improving endurance. Rowing is considered a total-body workout.
Global Rowing Machines Market Dynamics
DRIVERS
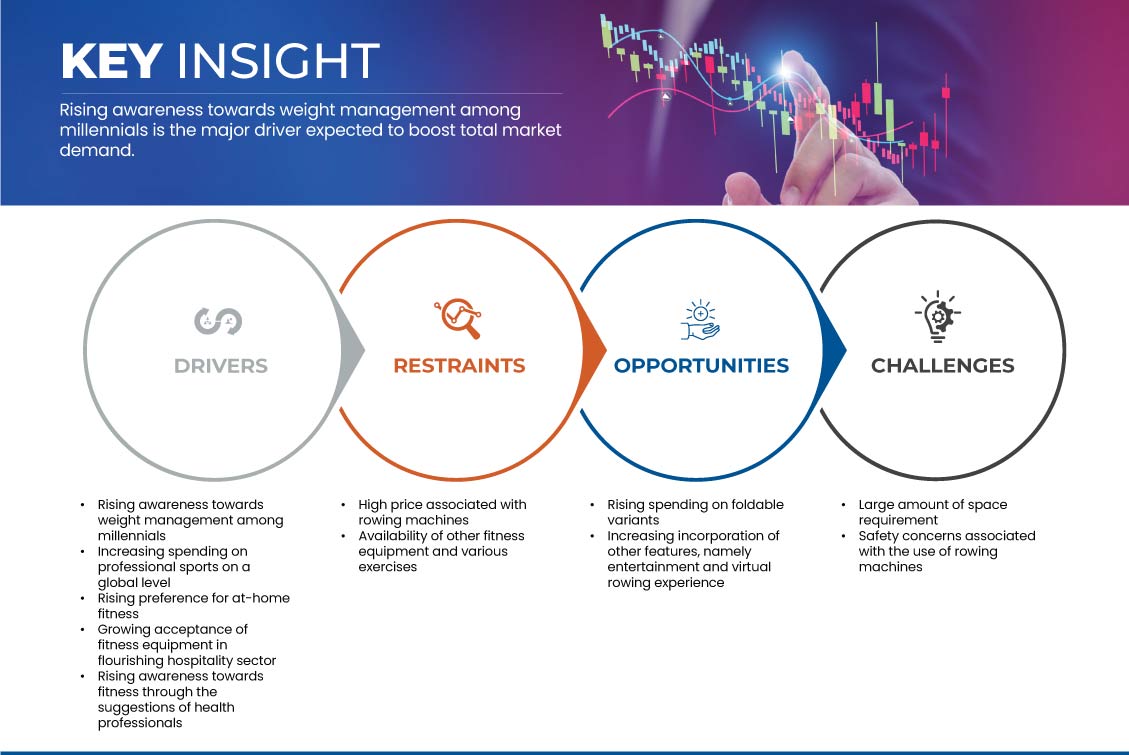
Rising Awareness of Weight Management Among Millennials
- In recent times, there has been an increasing shift among the current millennial generation toward obesity. According to an estimation of Cancer Research U.K., seven out of ten millennials who were born between 1981 and 1996 are on the path to becoming obese or overweight until they reach middle age. Several factors, such as consumption of highly processed foods, fast-paced lifestyle, stress eating, and sedentary lifestyle are factors attributed to obesity among millennials. However, because of different factors, there has been a rise in awareness of weight management among individuals. In this digital age, millennials are connected to a wide range of information available on social media and the internet. The population is exposed to various studies through news articles and other sources related to weight management and its importance for mental and physical well-being. In addition to it, the business involved in the fitness industry, corporates, health professionals, and the government is focused to spread awareness among the young population about the benefits of physical fitness to avoid diseases such as diabetes, cancer, and heart disease.
Increasing Spending on Professional Sports on a Global Level
- Most countries worldwide tend to spend money on sports for their citizens. The most important aspect of investment in professional sports is to improve public health so that the risk of chronic diseases such as heart disease and obesity decreases along with improvement in mental health. Moreover, the development of sports has the potential to contribute to the economic development of the nation by creating jobs and generating revenue through events and tourism. In addition to it, sports can improve intercultural communication and understanding. Countries can promote their cultures and create connections with other nations by holding international sporting events. Therefore, to promote the sports culture, the government, and various other organizations spend money on professional sports.
Growing Acceptance of Fitness Equipment in the Flourishing Hospitality Sector
- Over the past decades, the hospitality sector has seen a boom worldwide owing to factors such as an increase in disposable income, advancement in technology, ease of access to information, and globalization. In the hospitality industry, the requirements of hotel guests and those of gym customers increasingly coincide. Fitness enthusiasts who reside in hotels for various reasons, such as vacation or business trips prefer to book a room in a hotel, which has access to fitness centers or gyms. Millennials are becoming more aware of physical fitness. Thus, they look for different ways to be fit even when they are traveling and staying in hotels.
OPPORTUNITIES
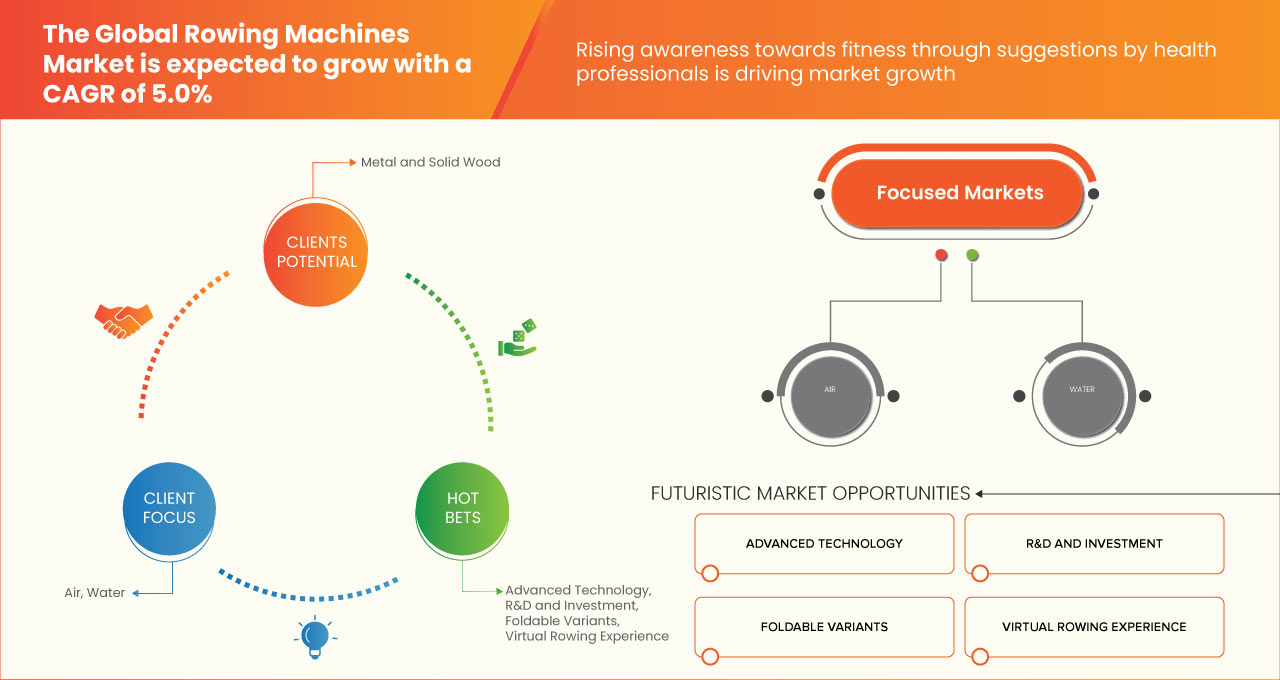
Rising Spending on Foldable Variants
- The global rowing machines market has been growing in recent years owing to various factors such as a rise in awareness of physical activity and a growing dedicated gym setup. Moreover, the manufacturers of rowing machines have observed this trend and are focusing on developing new variants of rowing machines, which are foldable in nature. As the conventional rowing machines acquired more space, it was difficult to set up the machine along with other instruments in the gym. However, due to the foldable variants, the space issue in the gym gets resolved. When not in use, the machines could be folded and kept, which further saves space for other activities. In addition, vertical standing rowing machines are present in the market to which customers are attracted.
Increasing Incorporation of Other Features, Namely Entertainment and Virtual Rowing Experience
- The fitness industry is innovating constantly, which is fuelled by digital developments, and social media engagement. There has been increasing significance of technologies, including augmented and virtual reality, blockchain, artificial intelligence, the Internet of Things, robotics, cloud, data analytics, wearable technology, and many more. Manufacturers of rowing machines are incorporating a wide range of technological advancements in rowing machines to give a user-friendly experience to customers.
RESTRAINTS/CHALLENGES
High Prices Associated with Rowing Machines
- Rowing machines are well-known fitness equipment that is used for full-body workouts. Through performing workout on rowing machines, one can train a majority of muscles, keeps the heart strong, and aid in weight loss. However, the high price is one of the major drawbacks related to rowing machines. The majority of the price is related to the production cost of the equipment. Various raw materials such as steel, iron, rubbers, and leather are required to build fitness equipment such as rowing machines. Steel prices are volatile in nature that are affected by the supply-demand or geopolitical situations that are occurring across the globe. Moreover, the prices of coking coal, which is a key raw material to manufacture steel, are volatile in nature. The lack of raw materials due to increased demand has caused the cost of rowing machines to go up. Rowing machines are not popular when compared to other fitness equipment, such as cycling bikes and treadmills, which makes the cost of rowing machines scale up. Also, the cost of rowing machines increases due to the high logistics costs. The freight costs are high due to the volatile price of crude oil and the shortage of containers, which contributes to the high cost of logistics.
Availability of Other Fitness Equipment and Various Exercises
- Although rowing machines have various advantages associated with them, there are a few drawbacks associated with them. They require a large area due to the flywheel or tank, rails, and the necessity for enough space for a full extension of arms and legs. It can be challenging to fit the machine into a more compact home or apartment. Moreover, if proper form is not maintained, the rower can cause injury or back pain. The noise generated by rowing machines can be unbearable for some individuals, which proves to be one of the drawbacks of rowing machines.
Recent Development
- In September 2021, Nautilus, Inc. announced the signing of a formal deal to acquire VAY, a global leader in motion technology. The purchase will enable Nautilus to grow its JRNY digital platform by offering core technologies that will power the company's vision and motion-tracking capabilities, which will allow for real-time data analysis during workouts. These features will be integrated into Nautilus' JRNY platform to develop and expedite highly tailored one-on-one exercise sessions
Global Rowing Machines Market Scope
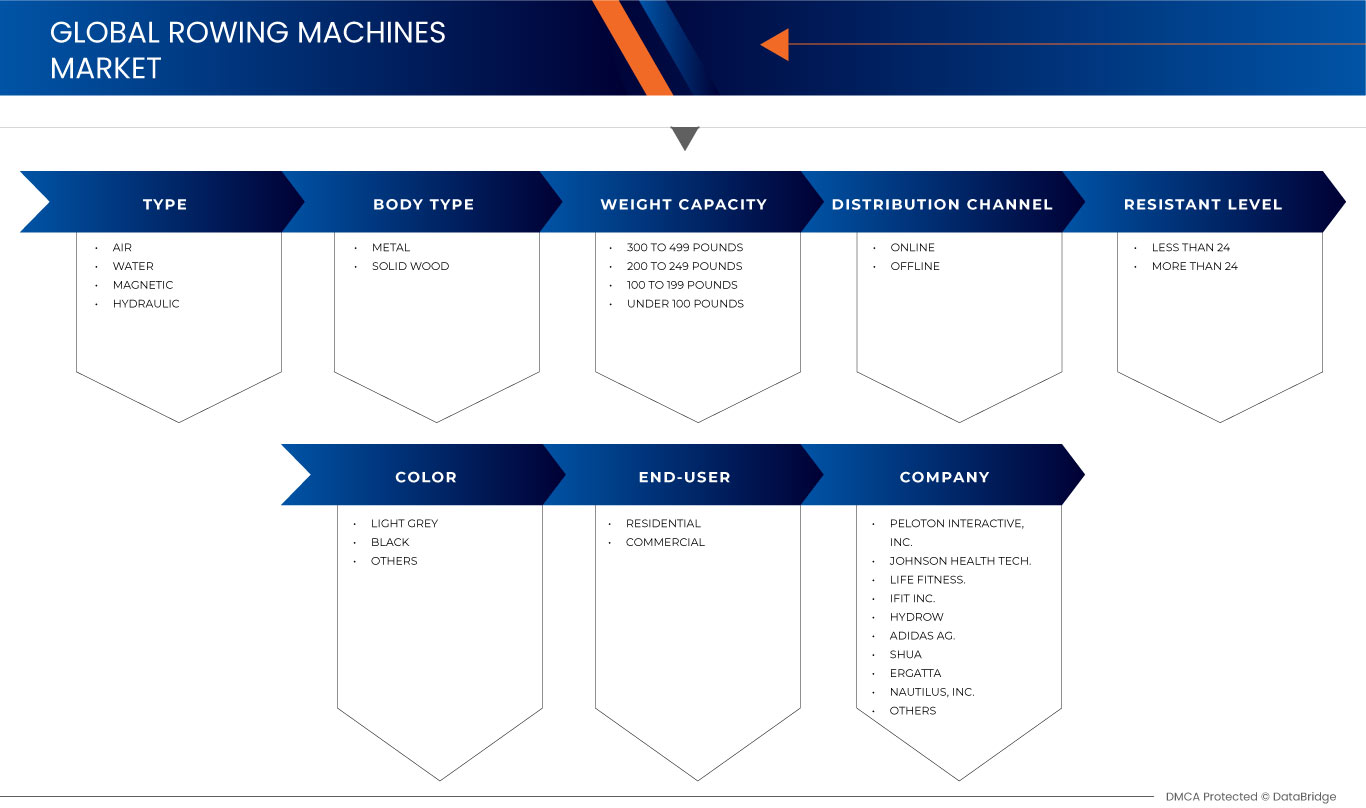
The global rowing machines market is segmented into seven notable segments based on type, body type, weight capacity, distribution channel, resistant level, color, and end-user. The growth amongst these segments will help you analyze major growth segments in the industries and provide the users with a valuable market overview and market insights to make strategic decisions to identify core market applications.
Type
- Air
- Water
- Magnetic
- Hydraulic
On the basis of type, the market is segmented into air, water, magnetic, and hydraulic.
Body Type
- Metal
- Solid Wood
On the basis of body type, the market is segmented into metal and solid wood.
Weight Capacity
- 300 to 499 Pounds
- 200 to 249 Pounds
- 100 to 199 Pounds
- Under 100 Pounds
On the basis of weight capacity, the market is segmented into 300 to 499 Pounds, 200 to 249 Pounds, 100 to 199 Pounds, and Under 100 Pounds.
Distribution Channel
- Online
- Offline
On the basis of distribution channel, the market is segmented into online and offline.
Resistant Level
- Less Than 24
- More Than 24
On the basis of resistant level, the market is segmented into less than 24 and more than 24.
Color
- Black
- Light Grey
- Others
On the basis of color, the market is segmented into black, light grey, and others.
End-User
- Commercial
- Residential
On the basis of end-user, the market is segmented into commercial and residential.
Global Rowing Machines Market Regional Analysis/Insights
The global rowing machines market is segmented into seven notable segments based on type, body type, weight capacity, distribution channel, resistant level, color, and end-user.
The countries in the global rowing machines market are the U.S., Canada, Mexico, Brazil, Argentina, rest of South America, Germany, Italy, U.K., France, Spain, Netherlands, Belgium, Switzerland, Turkey, Russia, rest of Europe, Japan, China, India, South Korea, Australia, Singapore, Malaysia, Thailand, Indonesia, Philippines, rest of Asia-Pacific, Saudi Arabia, UAE, South Africa, Egypt, Israel, and rest of Middle East and Africa.
North America is dominating the global rowing machines market with a CAGR of around 4.5%. The U.S. is dominating the North America rowing machines market due to growing awareness of the properties of rowing machine products. Germany is dominating the Europe rowing machines market due to the growing technologies of rowing machine products. South Africa is dominating the Middle East and Africa due to the rising popularity of rowing machines among children.
The country section of the report also provides individual market-impacting factors and changes in market regulation that impact the current and future trends of the market. Data point downstream and upstream value chain analysis, technical trends, porter's five forces analysis, and case studies are some of the pointers used to forecast the market scenario for individual countries. Also, the presence and availability of global brands and their challenges faced due to large or scarce competition from local and domestic brands, the impact of domestic tariffs, and trade routes are considered while providing forecast analysis of the country data.
Competitive Landscape and Global Rowing Machines Market Share Analysis
The global rowing machines market competitive landscape provides details of competitors. Details included are company overview, company financials, revenue generated, market potential, investment in research and development, new market initiatives, production sites and facilities, company strengths and weaknesses, product launch, product trials pipelines, product approvals, patents, product width and breadth, application dominance, and technology lifeline curve. The above data points provided are only related to the companies’ focus related to the market.
Some of the prominent participants operating in the global rowing machines market are BODYCRAFT, Johnson Health Tech, Nautilus, Inc., Mr Captain Brand, Stamina Products, Inc., Sunny Health and Fitness, iFIT Inc., York Fitness UK, Infiniti, Concept2 inc., WaterRower, RP3 Rowing, Peloton Interactive, Inc., ERGATTA, AVIRON INTERACTIVE INC., TECHNOGYM S.p.A, Hydrow, Oartec, Decathlon, Intense Enterprises, HAMMER Sport AG, Tunturi New Fitness, adidas AG., Cosco (India) Limited, Life Fitness, Pure Design Fitness, TOPIOM, Modcon Industries Private Limited, Shandong DHZ Fitness Equipment Co., Ltd, KAYA, SHUA, and SHANDONG BAODELONG FITNESS CO., LTD among others.
SKU-

- Interactive Data Analysis Dashboard
- Company Analysis Dashboard for high growth potential opportunities
- Research Analyst Access for customization & queries
- Competitor Analysis with Interactive dashboard
- Latest News, Updates & Trend analysis
- Harness the Power of Benchmark Analysis for Comprehensive Competitor Tracking
Table of Content
1 INTRODUCTION
1.1 OBJECTIVES OF THE STUDY
1.2 MARKET DEFINITION
1.3 LIMITATIONS
1.4 MARKETS COVERED
2 MARKET SEGMENTATION
2.1 MARKETS COVERED
2.2 GEOGRAPHICAL SCOPE
2.3 YEARS CONSIDERED FOR THE STUDY
2.4 CURRENCY AND PRICING
2.5 DBMR TRIPOD DATA VALIDATION MODEL
2.6 TYPE LIFE LINE CURVE
2.7 MULTIVARIATE MODELING
2.8 PRIMARY INTERVIEWS WITH KEY OPINION LEADERS
2.9 DBMR MARKET POSITION GRID
2.1 DBMR MARKET CHALLENGE MATRIX
2.11 DBMR VENDOR SHARE ANALYSIS
2.12 SECONDARY SOURCES
2.13 ASSUMPTIONS
3 EXECUTIVE SUMMARY
4 PREMIUM INSIGHTS
5 MARKET OVERVIEW
5.1 DRIVERS
5.1.1 RISING AWARENESS TOWARDS WEIGHT MANAGEMENT AMONG MILLENNIALS
5.1.2 INCREASING SPENDING ON PROFESSIONAL SPORTS ON A GLOBAL LEVEL
5.1.3 RISING PREFERENCE FOR AT-HOME FITNESS
5.1.4 GROWING ACCEPTANCE OF FITNESS EQUIPMENT IN THE FLOURISHING HOSPITALITY SECTOR
5.1.5 RISING AWARENESS TOWARDS FITNESS THROUGH SUGGESTIONS BY HEALTH PROFESSIONALS
5.2 RESTRAINTS
5.2.1 HIGH PRICES ASSOCIATED WITH ROWING MACHINES
5.2.2 AVAILABILITY OF OTHER FITNESS EQUIPMENT AND VARIOUS EXERCISES
5.3 OPPORTUNITIES
5.3.1 RISING SPENDING ON FOLDABLE VARIANTS
5.3.2 INCREASING INCORPORATION OF OTHER FEATURES, NAMELY ENTERTAINMENT AND VIRTUAL ROWING EXPERIENCE
5.4 CHALLENGES
5.4.1 A LARGE AMOUNT OF SPACE REQUIREMENT
5.4.2 SAFETY CONCERNS ASSOCIATED WITH THE USE OF ROWING MACHINES
6 GLOBAL ROWING MACHINES MARKET, BY REGION
6.1 OVERVIEW
6.2 NORTH AMERICA
6.2.1 U.S.
6.2.2 CANADA
6.2.3 MEXICO
6.3 EUROPE
6.3.1 GERMANY
6.3.2 FRANCE
6.3.3 U.K.
6.3.4 ITALY
6.3.5 RUSSIA
6.3.6 SPAIN
6.3.7 TURKEY
6.3.8 NETHERLANDS
6.3.9 SWITZERLAND
6.3.10 BELGIUM
6.3.11 REST OF EUROPE
6.4 ASIA-PACIFIC
6.4.1 CHINA
6.4.2 JAPAN
6.4.3 SOUTH KOREA
6.4.4 INDIA
6.4.5 AUSTRALIA
6.4.6 SINGAPORE
6.4.7 THAILAND
6.4.8 INDONESIA
6.4.9 MALAYSIA
6.4.10 PHILIPPINES
6.4.11 REST OF ASIA-PACIFIC
6.5 SOUTH AMERICA
6.5.1 BRAZIL
6.5.2 ARGENTINA
6.5.3 COLOMBIA
6.5.4 CHILE
6.5.5 PERU
6.5.6 ECUADOR
6.5.7 VENEZUELA
6.5.8 REST OF SOUTH AMERICA
6.6 MIDDLE EAST AND AFRICA
6.6.1 SOUTH AFRICA
6.6.2 SAUDI ARABIA
6.6.3 UNITED ARAB EMIRATES
6.6.4 EGYPT
6.6.5 ISRAEL
6.6.6 REST OF MIDDLE EAST AND AFRICA
7 GLOBAL ROWING MACHINES MARKET: COMPANY LANDSCAPE
7.1 COMPANY SHARE ANALYSIS: GLOBAL
7.2 COMPANY SHARE ANALYSIS: NORTH AMERICA
7.3 COMPANY SHARE ANALYSIS: EUROPE
7.4 COMPANY SHARE ANALYSIS: ASIA-PACIFIC
7.5 PARTNERSHIP
7.6 ACQUISITION
7.7 PRODUCT LAUNCH
7.8 REVIEW
7.9 AWARD
7.1 EXHIBITION
7.11 EVENT
8 SWOT ANALYSIS
9 COMPANY PROFILES
9.1 PELOTON INTERACTIVE, INC.
9.1.1 COMPANY SNAPSHOT
9.1.2 REVENUE ANALYSIS
9.1.3 COMPANY SHARE ANALYSIS
9.1.4 PRODUCT PORTFOLIO
9.1.5 RECENT DEVELOPMENT
9.2 JOHNSON HEALTH TECH.
9.2.1 COMPANY SNAPSHOT
9.2.2 REVENUE ANALYSIS
9.2.3 COMPANY SHARE ANALYSIS
9.2.4 PRODUCT PORTFOLIO
9.2.5 RECENT DEVELOPMENTS
9.3 LIFE FITNESS.
9.3.1 COMPANY SNAPSHOT
9.3.2 COMPANY SHARE ANALYSIS
9.3.3 PRODUCT PORTFOLIO
9.3.4 RECENT DEVELOPMENTS
9.4 IFIT INC.
9.4.1 COMPANY SNAPSHOT
9.4.2 COMPANY SHARE ANALYSIS
9.4.3 PRODUCT PORTFOLIO
9.4.4 RECENT DEVELOPMENT
9.5 HYDROW
9.5.1 COMPANY SNAPSHOT
9.5.2 COMPANY SHARE ANALYSIS
9.5.3 PRODUCT PORTFOLIO
9.5.4 RECENT DEVELOPMENT
9.6 ADIDAS AG.
9.6.1 COMPANY SNAPSHOT
9.6.2 REVENUE ANALYSIS
9.6.3 PRODUCT PORTFOLIO
9.6.4 RECENT DEVELOPMENT
9.7 AVIRON INTERACTIVE INC,
9.7.1 COMPANY SNAPSHOT
9.7.2 PRODUCT PORTFOLIO
9.7.3 RECENT DEVELOPMENT
9.8 BODYCRAFT®
9.8.1 COMPANY SNAPSHOT
9.8.2 PRODUCT PORTFOLIO
9.8.3 RECENT DEVELOPMENT
9.9 CONCEPT2 INC.
9.9.1 COMPANY SNAPSHOT
9.9.2 PRODUCT PORTFOLIO
9.9.3 RECENT DEVELOPMENT
9.1 COSCO (INDIA) LIMITED
9.10.1 COMPANY SNAPSHOT
9.10.2 REVENUE ANALYSIS
9.10.3 PRODUCT PORTFOLIO
9.10.4 RECENT DEVELOPMENT
9.11 DECATHLON
9.11.1 COMPANY SNAPSHOT
9.11.2 PRODUCT PORTFOLIO
9.11.3 RECENT DEVELOPMENT
9.12 ERGATTA
9.12.1 COMPANY SNAPSHOT
9.12.2 PRODUCT PORTFOLIO
9.12.3 RECENT DEVELOPMENT
9.13 HAMMER SPORT AG
9.13.1 COMPANY SNAPSHOT
9.13.2 PRODUCT PORTFOLIO
9.13.3 RECENT DEVELOPMENT
9.14 INFINITI
9.14.1 COMPANY SNAPSHOT
9.14.2 PRODUCT PORTFOLIO
9.14.3 RECENT DEVELOPMENT
9.15 INTENSE ENTERPRISES
9.15.1 COMPANY SNAPSHOT
9.15.2 PRODUCT PORTFOLIO
9.15.3 RECENT DEVELOPMENT
9.16 KAYA
9.16.1 COMPANY SNAPSHOT
9.16.2 PRODUCT PORTFOLIO
9.16.3 RECENT DEVELOPMENT
9.17 MODCON INDUSTRIES PRIVATE LIMITED.
9.17.1 COMPANY SNAPSHOT
9.17.2 PRODUCT PORTFOLIO
9.17.3 RECENT DEVELOPMENT
9.18 MR CAPTAIN BRAND
9.18.1 COMPANY SNAPSHOT
9.18.2 PRODUCT PORTFOLIO
9.18.3 RECENT DEVELOPMENT
9.19 NAUTILUS, INC.
9.19.1 COMPANY SNAPSHOT
9.19.2 REVENUE ANALYSIS
9.19.3 PRODUCT PORTFOLIO
9.19.4 RECENT DEVELOPMENTS
9.2 OARTEC
9.20.1 COMPANY SNAPSHOT
9.20.2 PRODUCT PORTFOLIO
9.20.3 RECENT DEVELOPMENT
9.21 PURE DESIGN FITNESS
9.21.1 COMPANY SNAPSHOT
9.21.2 PRODUCT PORTFOLIO
9.21.3 RECENT DEVELOPMENT
9.22 RP3 ROWING
9.22.1 COMPANY SNAPSHOT
9.22.2 PRODUCT PORTFOLIO
9.22.3 RECENT DEVELOPMENT
9.23 STAMINA PRODUCTS, INC.
9.23.1 COMPANY SNAPSHOT
9.23.2 PRODUCT PORTFOLIO
9.23.3 RECENT DEVELOPMENT
9.24 SHANDONG BAODELONG FITNESS CO., LTD
9.24.1 COMPANY SNAPSHOT
9.24.2 PRODUCT PORTFOLIO
9.24.3 RECENT DEVELOPMENT
9.25 SHANDONG DHZ FITNESS EQUIPMENT CO., LTD
9.25.1 COMPANY SNAPSHOT
9.25.2 PRODUCT PORTFOLIO
9.25.3 RECENT DEVELOPMENTS
9.26 SHUA
9.26.1 COMPANY SNAPSHOT
9.26.2 PRODUCT PORTFOLIO
9.26.3 RECENT DEVELOPMENTS
9.27 SUNNY HEALTH AND FITNESS
9.27.1 COMPANY SNAPSHOT
9.27.2 PRODUCT PORTFOLIO
9.27.3 RECENT DEVELOPMENT
9.28 TECHNOGYM S.P.A
9.28.1 COMPANY SNAPSHOT
9.28.2 REVENUE ANALYSIS
9.28.3 PRODUCT PORTFOLIO
9.28.4 RECENT DEVELOPMENT
9.29 TOPIOM
9.29.1 COMPANY SNAPSHOT
9.29.2 PRODUCT PORTFOLIO
9.29.3 RECENT DEVELOPMENT
9.3 TUNTURI NEW FITNESS
9.30.1 COMPANY SNAPSHOT
9.30.2 PRODUCT PORTFOLIO
9.30.3 RECENT DEVELOPMENT
9.31 WATERROWER
9.31.1 COMPANY SNAPSHOT
9.31.2 PRODUCT PORTFOLIO
9.31.3 RECENT DEVELOPMENT
9.32 YORK FITNESS UK
9.32.1 COMPANY SNAPSHOT
9.32.2 PRODUCT PORTFOLIO
9.32.3 RECENT DEVELOPMENT
10 QUESTIONNAIRE
11 RELATED REPORTS
List of Table
TABLE 1 GLOBAL ROWING MACHINES MARKET, BY REGION, 2018-2030 (USD THOUSAND)
TABLE 2 GLOBAL ROWING MACHINES MARKET, BY TYPE, 2018-2030 (USD THOUSAND)
TABLE 3 GLOBAL ROWING MACHINES MARKET, BY BODY TYPE, 2018-2030 (USD THOUSAND)
TABLE 4 GLOBAL ROWING MACHINES MARKET, BY WEIGHT CAPACITY, 2018-2030 (USD THOUSAND)
TABLE 5 GLOBAL ROWING MACHINES MARKET, BY DISTRIBUTION CHANNEL, 2018-2030 (USD THOUSAND)
TABLE 6 GLOBAL ROWING MACHINES MARKET, BY RESISTANT LEVEL, 2018-2030 (USD THOUSAND)
TABLE 7 GLOBAL ROWING MACHINES MARKET, BY COLOR, 2018-2030 (USD THOUSAND)
TABLE 8 GLOBAL ROWING MACHINES MARKET, BY END-USER, 2018-2030 (USD THOUSAND)
TABLE 9 GLOBAL COMMERCIAL IN ROWING MACHINES MARKET, BY TYPE, 2018-2030 (USD THOUSAND)
TABLE 10 NORTH AMERICA ROWING MACHINES MARKET, BY COUNTRY, 2018-2030 (USD THOUSAND)
TABLE 11 NORTH AMERICA ROWING MACHINES MARKET, BY TYPE, 2018-2030 (USD THOUSAND)
TABLE 12 NORTH AMERICA ROWING MACHINES MARKET, BY BODY TYPE, 2018-2030 (USD THOUSAND)
TABLE 13 NORTH AMERICA ROWING MACHINES MARKET, BY WEIGHT CAPACITY, 2018-2030 (USD THOUSAND)
TABLE 14 NORTH AMERICA ROWING MACHINES MARKET, BY DISTRIBUTION CHANNEL, 2018-2030 (USD THOUSAND)
TABLE 15 NORTH AMERICA ROWING MACHINES MARKET, BY RESISTANT LEVEL, 2018-2030 (USD THOUSAND)
TABLE 16 NORTH AMERICA ROWING MACHINES MARKET, BY COLOR, 2018-2030 (USD THOUSAND)
TABLE 17 NORTH AMERICA ROWING MACHINES MARKET, BY END-USER, 2018-2030 (USD THOUSAND)
TABLE 18 NORTH AMERICA COMMERCIAL IN ROWING MACHINES MARKET, BY TYPE, 2018-2030 (USD THOUSAND)
TABLE 19 U.S. ROWING MACHINES MARKET, BY TYPE, 2018-2030 (USD THOUSAND)
TABLE 20 U.S. ROWING MACHINES MARKET, BY BODY TYPE, 2018-2030 (USD THOUSAND)
TABLE 21 U.S. ROWING MACHINES MARKET, BY WEIGHT CAPACITY, 2018-2030 (USD THOUSAND)
TABLE 22 U.S. ROWING MACHINES MARKET, BY DISTRIBUTION CHANNEL, 2018-2030 (USD THOUSAND)
TABLE 23 U.S. ROWING MACHINES MARKET, BY RESISTANT LEVEL, 2018-2030 (USD THOUSAND)
TABLE 24 U.S. ROWING MACHINES MARKET, BY COLOR, 2018-2030 (USD THOUSAND)
TABLE 25 U.S. ROWING MACHINES MARKET, BY END-USER, 2018-2030 (USD THOUSAND)
TABLE 26 U.S. COMMERCIAL IN ROWING MACHINES MARKET, BY TYPE, 2018-2030 (USD THOUSAND)
TABLE 27 CANADA ROWING MACHINES MARKET, BY TYPE, 2018-2030 (USD THOUSAND)
TABLE 28 CANADA ROWING MACHINES MARKET, BY BODY TYPE, 2018-2030 (USD THOUSAND)
TABLE 29 CANADA ROWING MACHINES MARKET, BY WEIGHT CAPACITY, 2018-2030 (USD THOUSAND)
TABLE 30 CANADA ROWING MACHINES MARKET, BY DISTRIBUTION CHANNEL, 2018-2030 (USD THOUSAND)
TABLE 31 CANADA ROWING MACHINES MARKET, BY RESISTANT LEVEL, 2018-2030 (USD THOUSAND)
TABLE 32 CANADA ROWING MACHINES MARKET, BY COLOR, 2018-2030 (USD THOUSAND)
TABLE 33 CANADA ROWING MACHINES MARKET, BY END-USER, 2018-2030 (USD THOUSAND)
TABLE 34 CANADA COMMERCIAL IN ROWING MACHINES MARKET, BY TYPE, 2018-2030 (USD THOUSAND)
TABLE 35 MEXICO ROWING MACHINES MARKET, BY TYPE, 2018-2030 (USD THOUSAND)
TABLE 36 MEXICO ROWING MACHINES MARKET, BY BODY TYPE, 2018-2030 (USD THOUSAND)
TABLE 37 MEXICO ROWING MACHINES MARKET, BY WEIGHT CAPACITY, 2018-2030 (USD THOUSAND)
TABLE 38 MEXICO ROWING MACHINES MARKET, BY DISTRIBUTION CHANNEL, 2018-2030 (USD THOUSAND)
TABLE 39 MEXICO ROWING MACHINES MARKET, BY RESISTANT LEVEL, 2018-2030 (USD THOUSAND)
TABLE 40 MEXICO ROWING MACHINES MARKET, BY COLOR, 2018-2030 (USD THOUSAND)
TABLE 41 MEXICO ROWING MACHINES MARKET, BY END-USER, 2018-2030 (USD THOUSAND)
TABLE 42 MEXICO COMMERCIAL IN ROWING MACHINES MARKET, BY TYPE, 2018-2030 (USD THOUSAND)
TABLE 43 EUROPE ROWING MACHINES MARKET, BY COUNTRY, 2018-2030 (USD THOUSAND)
TABLE 44 EUROPE ROWING MACHINES MARKET, BY TYPE, 2018-2030 (USD THOUSAND)
TABLE 45 EUROPE ROWING MACHINES MARKET, BY BODY TYPE, 2018-2030 (USD THOUSAND)
TABLE 46 EUROPE ROWING MACHINES MARKET, BY WEIGHT CAPACITY, 2018-2030 (USD THOUSAND)
TABLE 47 EUROPE ROWING MACHINES MARKET, BY DISTRIBUTION CHANNEL, 2018-2030 (USD THOUSAND)
TABLE 48 EUROPE ROWING MACHINES MARKET, BY RESISTANT LEVEL, 2018-2030 (USD THOUSAND)
TABLE 49 EUROPE ROWING MACHINES MARKET, BY COLOR, 2018-2030 (USD THOUSAND)
TABLE 50 EUROPE ROWING MACHINES MARKET, BY END-USER, 2018-2030 (USD THOUSAND)
TABLE 51 EUROPE COMMERCIAL IN ROWING MACHINES MARKET, BY TYPE, 2018-2030 (USD THOUSAND)
TABLE 52 GERMANY ROWING MACHINES MARKET, BY TYPE, 2018-2030 (USD THOUSAND)
TABLE 53 GERMANY ROWING MACHINES MARKET, BY BODY TYPE, 2018-2030 (USD THOUSAND)
TABLE 54 GERMANY ROWING MACHINES MARKET, BY WEIGHT CAPACITY, 2018-2030 (USD THOUSAND)
TABLE 55 GERMANY ROWING MACHINES MARKET, BY DISTRIBUTION CHANNEL, 2018-2030 (USD THOUSAND)
TABLE 56 GERMANY ROWING MACHINES MARKET, BY RESISTANT LEVEL, 2018-2030 (USD THOUSAND)
TABLE 57 GERMANY ROWING MACHINES MARKET, BY COLOR, 2018-2030 (USD THOUSAND)
TABLE 58 GERMANY ROWING MACHINES MARKET, BY END-USER, 2018-2030 (USD THOUSAND)
TABLE 59 GERMANY COMMERCIAL IN ROWING MACHINES MARKET, BY TYPE, 2018-2030 (USD THOUSAND)
TABLE 60 FRANCE ROWING MACHINES MARKET, BY TYPE, 2018-2030 (USD THOUSAND)
TABLE 61 FRANCE ROWING MACHINES MARKET, BY BODY TYPE, 2018-2030 (USD THOUSAND)
TABLE 62 FRANCE ROWING MACHINES MARKET, BY WEIGHT CAPACITY, 2018-2030 (USD THOUSAND)
TABLE 63 FRANCE ROWING MACHINES MARKET, BY DISTRIBUTION CHANNEL, 2018-2030 (USD THOUSAND)
TABLE 64 FRANCE ROWING MACHINES MARKET, BY RESISTANT LEVEL, 2018-2030 (USD THOUSAND)
TABLE 65 FRANCE ROWING MACHINES MARKET, BY COLOR, 2018-2030 (USD THOUSAND)
TABLE 66 FRANCE ROWING MACHINES MARKET, BY END-USER, 2018-2030 (USD THOUSAND)
TABLE 67 FRANCE COMMERCIAL IN ROWING MACHINES MARKET, BY TYPE, 2018-2030 (USD THOUSAND)
TABLE 68 U.K. ROWING MACHINES MARKET, BY TYPE, 2018-2030 (USD THOUSAND)
TABLE 69 U.K. ROWING MACHINES MARKET, BY BODY TYPE, 2018-2030 (USD THOUSAND)
TABLE 70 U.K. ROWING MACHINES MARKET, BY WEIGHT CAPACITY, 2018-2030 (USD THOUSAND)
TABLE 71 U.K. ROWING MACHINES MARKET, BY DISTRIBUTION CHANNEL, 2018-2030 (USD THOUSAND)
TABLE 72 U.K. ROWING MACHINES MARKET, BY RESISTANT LEVEL, 2018-2030 (USD THOUSAND)
TABLE 73 U.K. ROWING MACHINES MARKET, BY COLOR, 2018-2030 (USD THOUSAND)
TABLE 74 U.K. ROWING MACHINES MARKET, BY END-USER, 2018-2030 (USD THOUSAND)
TABLE 75 U.K. COMMERCIAL IN ROWING MACHINES MARKET, BY TYPE, 2018-2030 (USD THOUSAND)
TABLE 76 ITALY ROWING MACHINES MARKET, BY TYPE, 2018-2030 (USD THOUSAND)
TABLE 77 ITALY ROWING MACHINES MARKET, BY BODY TYPE, 2018-2030 (USD THOUSAND)
TABLE 78 ITALY ROWING MACHINES MARKET, BY WEIGHT CAPACITY, 2018-2030 (USD THOUSAND)
TABLE 79 ITALY ROWING MACHINES MARKET, BY DISTRIBUTION CHANNEL, 2018-2030 (USD THOUSAND)
TABLE 80 ITALY ROWING MACHINES MARKET, BY RESISTANT LEVEL, 2018-2030 (USD THOUSAND)
TABLE 81 ITALY ROWING MACHINES MARKET, BY COLOR, 2018-2030 (USD THOUSAND)
TABLE 82 ITALY ROWING MACHINES MARKET, BY END-USER, 2018-2030 (USD THOUSAND)
TABLE 83 ITALY COMMERCIAL IN ROWING MACHINES MARKET, BY TYPE, 2018-2030 (USD THOUSAND)
TABLE 84 RUSSIA ROWING MACHINES MARKET, BY TYPE, 2018-2030 (USD THOUSAND)
TABLE 85 RUSSIA ROWING MACHINES MARKET, BY BODY TYPE, 2018-2030 (USD THOUSAND)
TABLE 86 RUSSIA ROWING MACHINES MARKET, BY WEIGHT CAPACITY, 2018-2030 (USD THOUSAND)
TABLE 87 RUSSIA ROWING MACHINES MARKET, BY DISTRIBUTION CHANNEL, 2018-2030 (USD THOUSAND)
TABLE 88 RUSSIA ROWING MACHINES MARKET, BY RESISTANT LEVEL, 2018-2030 (USD THOUSAND)
TABLE 89 RUSSIA ROWING MACHINES MARKET, BY COLOR, 2018-2030 (USD THOUSAND)
TABLE 90 RUSSIA ROWING MACHINES MARKET, BY END-USER, 2018-2030 (USD THOUSAND)
TABLE 91 RUSSIA COMMERCIAL IN ROWING MACHINES MARKET, BY TYPE, 2018-2030 (USD THOUSAND)
TABLE 92 SPAIN ROWING MACHINES MARKET, BY TYPE, 2018-2030 (USD THOUSAND)
TABLE 93 SPAIN ROWING MACHINES MARKET, BY BODY TYPE, 2018-2030 (USD THOUSAND)
TABLE 94 SPAIN ROWING MACHINES MARKET, BY WEIGHT CAPACITY, 2018-2030 (USD THOUSAND)
TABLE 95 SPAIN ROWING MACHINES MARKET, BY DISTRIBUTION CHANNEL, 2018-2030 (USD THOUSAND)
TABLE 96 SPAIN ROWING MACHINES MARKET, BY RESISTANT LEVEL, 2018-2030 (USD THOUSAND)
TABLE 97 SPAIN ROWING MACHINES MARKET, BY COLOR, 2018-2030 (USD THOUSAND)
TABLE 98 SPAIN ROWING MACHINES MARKET, BY END-USER, 2018-2030 (USD THOUSAND)
TABLE 99 SPAIN COMMERCIAL IN ROWING MACHINES MARKET, BY TYPE, 2018-2030 (USD THOUSAND)
TABLE 100 TURKEY ROWING MACHINES MARKET, BY TYPE, 2018-2030 (USD THOUSAND)
TABLE 101 TURKEY ROWING MACHINES MARKET, BY BODY TYPE, 2018-2030 (USD THOUSAND)
TABLE 102 TURKEY ROWING MACHINES MARKET, BY WEIGHT CAPACITY, 2018-2030 (USD THOUSAND)
TABLE 103 TURKEY ROWING MACHINES MARKET, BY DISTRIBUTION CHANNEL, 2018-2030 (USD THOUSAND)
TABLE 104 TURKEY ROWING MACHINES MARKET, BY RESISTANT LEVEL, 2018-2030 (USD THOUSAND)
TABLE 105 TURKEY ROWING MACHINES MARKET, BY COLOR, 2018-2030 (USD THOUSAND)
TABLE 106 TURKEY ROWING MACHINES MARKET, BY END-USER, 2018-2030 (USD THOUSAND)
TABLE 107 TURKEY COMMERCIAL IN ROWING MACHINES MARKET, BY TYPE, 2018-2030 (USD THOUSAND)
TABLE 108 NETHERLANDS ROWING MACHINES MARKET, BY TYPE, 2018-2030 (USD THOUSAND)
TABLE 109 NETHERLANDS ROWING MACHINES MARKET, BY BODY TYPE, 2018-2030 (USD THOUSAND)
TABLE 110 NETHERLANDS ROWING MACHINES MARKET, BY WEIGHT CAPACITY, 2018-2030 (USD THOUSAND)
TABLE 111 NETHERLANDS ROWING MACHINES MARKET, BY DISTRIBUTION CHANNEL, 2018-2030 (USD THOUSAND)
TABLE 112 NETHERLANDS ROWING MACHINES MARKET, BY RESISTANT LEVEL, 2018-2030 (USD THOUSAND)
TABLE 113 NETHERLANDS ROWING MACHINES MARKET, BY COLOR, 2018-2030 (USD THOUSAND)
TABLE 114 NETHERLANDS ROWING MACHINES MARKET, BY END-USER, 2018-2030 (USD THOUSAND)
TABLE 115 NETHERLANDS COMMERCIAL IN ROWING MACHINES MARKET, BY TYPE, 2018-2030 (USD THOUSAND)
TABLE 116 SWITZERLAND ROWING MACHINES MARKET, BY TYPE, 2018-2030 (USD THOUSAND)
TABLE 117 SWITZERLAND ROWING MACHINES MARKET, BY BODY TYPE, 2018-2030 (USD THOUSAND)
TABLE 118 SWITZERLAND ROWING MACHINES MARKET, BY WEIGHT CAPACITY, 2018-2030 (USD THOUSAND)
TABLE 119 SWITZERLAND ROWING MACHINES MARKET, BY DISTRIBUTION CHANNEL, 2018-2030 (USD THOUSAND)
TABLE 120 SWITZERLAND ROWING MACHINES MARKET, BY RESISTANT LEVEL, 2018-2030 (USD THOUSAND)
TABLE 121 SWITZERLAND ROWING MACHINES MARKET, BY COLOR, 2018-2030 (USD THOUSAND)
TABLE 122 SWITZERLAND ROWING MACHINES MARKET, BY END-USER, 2018-2030 (USD THOUSAND)
TABLE 123 SWITZERLAND COMMERCIAL IN ROWING MACHINES MARKET, BY TYPE, 2018-2030 (USD THOUSAND)
TABLE 124 BELGIUM ROWING MACHINES MARKET, BY TYPE, 2018-2030 (USD THOUSAND)
TABLE 125 BELGIUM ROWING MACHINES MARKET, BY BODY TYPE, 2018-2030 (USD THOUSAND)
TABLE 126 BELGIUM ROWING MACHINES MARKET, BY WEIGHT CAPACITY, 2018-2030 (USD THOUSAND)
TABLE 127 BELGIUM ROWING MACHINES MARKET, BY DISTRIBUTION CHANNEL, 2018-2030 (USD THOUSAND)
TABLE 128 BELGIUM ROWING MACHINES MARKET, BY RESISTANT LEVEL, 2018-2030 (USD THOUSAND)
TABLE 129 BELGIUM ROWING MACHINES MARKET, BY COLOR, 2018-2030 (USD THOUSAND)
TABLE 130 BELGIUM ROWING MACHINES MARKET, BY END-USER, 2018-2030 (USD THOUSAND)
TABLE 131 BELGIUM COMMERCIAL IN ROWING MACHINES MARKET, BY TYPE, 2018-2030 (USD THOUSAND)
TABLE 132 REST OF EUROPE ROWING MACHINES MARKET, BY TYPE, 2018-2030 (USD THOUSAND)
TABLE 133 ASIA-PACIFIC ROWING MACHINES MARKET, BY COUNTRY, 2018-2030 (USD THOUSAND)
TABLE 134 ASIA-PACIFIC ROWING MACHINES MARKET, BY TYPE, 2018-2030 (USD THOUSAND)
TABLE 135 ASIA-PACIFIC ROWING MACHINES MARKET, BY BODY TYPE, 2018-2030 (USD THOUSAND)
TABLE 136 ASIA-PACIFIC ROWING MACHINES MARKET, BY WEIGHT CAPACITY, 2018-2030 (USD THOUSAND)
TABLE 137 ASIA-PACIFIC ROWING MACHINES MARKET, BY DISTRIBUTION CHANNEL, 2018-2030 (USD THOUSAND)
TABLE 138 ASIA-PACIFIC ROWING MACHINES MARKET, BY RESISTANT LEVEL, 2018-2030 (USD THOUSAND)
TABLE 139 ASIA-PACIFIC ROWING MACHINES MARKET, BY COLOR, 2018-2030 (USD THOUSAND)
TABLE 140 ASIA-PACIFIC ROWING MACHINES MARKET, BY END-USER, 2018-2030 (USD THOUSAND)
TABLE 141 ASIA-PACIFIC COMMERCIAL IN ROWING MACHINES MARKET, BY TYPE, 2018-2030 (USD THOUSAND)
TABLE 142 CHINA ROWING MACHINES MARKET, BY TYPE, 2018-2030 (USD THOUSAND)
TABLE 143 CHINA ROWING MACHINES MARKET, BY BODY TYPE, 2018-2030 (USD THOUSAND)
TABLE 144 CHINA ROWING MACHINES MARKET, BY WEIGHT CAPACITY, 2018-2030 (USD THOUSAND)
TABLE 145 CHINA ROWING MACHINES MARKET, BY DISTRIBUTION CHANNEL, 2018-2030 (USD THOUSAND)
TABLE 146 CHINA ROWING MACHINES MARKET, BY RESISTANT LEVEL, 2018-2030 (USD THOUSAND)
TABLE 147 CHINA ROWING MACHINES MARKET, BY COLOR, 2018-2030 (USD THOUSAND)
TABLE 148 CHINA ROWING MACHINES MARKET, BY END-USER, 2018-2030 (USD THOUSAND)
TABLE 149 CHINA COMMERCIAL IN ROWING MACHINES MARKET, BY TYPE, 2018-2030 (USD THOUSAND)
TABLE 150 JAPAN ROWING MACHINES MARKET, BY TYPE, 2018-2030 (USD THOUSAND)
TABLE 151 JAPAN ROWING MACHINES MARKET, BY BODY TYPE, 2018-2030 (USD THOUSAND)
TABLE 152 JAPAN ROWING MACHINES MARKET, BY WEIGHT CAPACITY, 2018-2030 (USD THOUSAND)
TABLE 153 JAPAN ROWING MACHINES MARKET, BY DISTRIBUTION CHANNEL, 2018-2030 (USD THOUSAND)
TABLE 154 JAPAN ROWING MACHINES MARKET, BY RESISTANT LEVEL, 2018-2030 (USD THOUSAND)
TABLE 155 JAPAN ROWING MACHINES MARKET, BY COLOR, 2018-2030 (USD THOUSAND)
TABLE 156 JAPAN ROWING MACHINES MARKET, BY END-USER, 2018-2030 (USD THOUSAND)
TABLE 157 JAPAN COMMERCIAL IN ROWING MACHINES MARKET, BY TYPE, 2018-2030 (USD THOUSAND)
TABLE 158 SOUTH KOREA ROWING MACHINES MARKET, BY TYPE, 2018-2030 (USD THOUSAND)
TABLE 159 SOUTH KOREA ROWING MACHINES MARKET, BY BODY TYPE, 2018-2030 (USD THOUSAND)
TABLE 160 SOUTH KOREA ROWING MACHINES MARKET, BY WEIGHT CAPACITY, 2018-2030 (USD THOUSAND)
TABLE 161 SOUTH KOREA ROWING MACHINES MARKET, BY DISTRIBUTION CHANNEL, 2018-2030 (USD THOUSAND)
TABLE 162 SOUTH KOREA ROWING MACHINES MARKET, BY RESISTANT LEVEL, 2018-2030 (USD THOUSAND)
TABLE 163 SOUTH KOREA ROWING MACHINES MARKET, BY COLOR, 2018-2030 (USD THOUSAND)
TABLE 164 SOUTH KOREA ROWING MACHINES MARKET, BY END-USER, 2018-2030 (USD THOUSAND)
TABLE 165 SOUTH KOREA COMMERCIAL IN ROWING MACHINES MARKET, BY TYPE, 2018-2030 (USD THOUSAND)
TABLE 166 INDIA ROWING MACHINES MARKET, BY TYPE, 2018-2030 (USD THOUSAND)
TABLE 167 INDIA ROWING MACHINES MARKET, BY BODY TYPE, 2018-2030 (USD THOUSAND)
TABLE 168 INDIA ROWING MACHINES MARKET, BY WEIGHT CAPACITY, 2018-2030 (USD THOUSAND)
TABLE 169 INDIA ROWING MACHINES MARKET, BY DISTRIBUTION CHANNEL, 2018-2030 (USD THOUSAND)
TABLE 170 INDIA ROWING MACHINES MARKET, BY RESISTANT LEVEL, 2018-2030 (USD THOUSAND)
TABLE 171 INDIA ROWING MACHINES MARKET, BY COLOR, 2018-2030 (USD THOUSAND)
TABLE 172 INDIA ROWING MACHINES MARKET, BY END-USER, 2018-2030 (USD THOUSAND)
TABLE 173 INDIA COMMERCIAL IN ROWING MACHINES MARKET, BY TYPE, 2018-2030 (USD THOUSAND)
TABLE 174 AUSTRALIA ROWING MACHINES MARKET, BY TYPE, 2018-2030 (USD THOUSAND)
TABLE 175 AUSTRALIA ROWING MACHINES MARKET, BY BODY TYPE, 2018-2030 (USD THOUSAND)
TABLE 176 AUSTRALIA ROWING MACHINES MARKET, BY WEIGHT CAPACITY, 2018-2030 (USD THOUSAND)
TABLE 177 AUSTRALIA ROWING MACHINES MARKET, BY DISTRIBUTION CHANNEL, 2018-2030 (USD THOUSAND)
TABLE 178 AUSTRALIA ROWING MACHINES MARKET, BY RESISTANT LEVEL, 2018-2030 (USD THOUSAND)
TABLE 179 AUSTRALIA ROWING MACHINES MARKET, BY COLOR, 2018-2030 (USD THOUSAND)
TABLE 180 AUSTRALIA ROWING MACHINES MARKET, BY END-USER, 2018-2030 (USD THOUSAND)
TABLE 181 AUSTRALIA COMMERCIAL IN ROWING MACHINES MARKET, BY TYPE, 2018-2030 (USD THOUSAND)
TABLE 182 SINGAPORE ROWING MACHINES MARKET, BY TYPE, 2018-2030 (USD THOUSAND)
TABLE 183 SINGAPORE ROWING MACHINES MARKET, BY BODY TYPE, 2018-2030 (USD THOUSAND)
TABLE 184 SINGAPORE ROWING MACHINES MARKET, BY WEIGHT CAPACITY, 2018-2030 (USD THOUSAND)
TABLE 185 SINGAPORE ROWING MACHINES MARKET, BY DISTRIBUTION CHANNEL, 2018-2030 (USD THOUSAND)
TABLE 186 SINGAPORE ROWING MACHINES MARKET, BY RESISTANT LEVEL, 2018-2030 (USD THOUSAND)
TABLE 187 SINGAPORE ROWING MACHINES MARKET, BY COLOR, 2018-2030 (USD THOUSAND)
TABLE 188 SINGAPORE ROWING MACHINES MARKET, BY END-USER, 2018-2030 (USD THOUSAND)
TABLE 189 SINGAPORE COMMERCIAL IN ROWING MACHINES MARKET, BY TYPE, 2018-2030 (USD THOUSAND)
TABLE 190 THAILAND ROWING MACHINES MARKET, BY TYPE, 2018-2030 (USD THOUSAND)
TABLE 191 THAILAND ROWING MACHINES MARKET, BY BODY TYPE, 2018-2030 (USD THOUSAND)
TABLE 192 THAILAND ROWING MACHINES MARKET, BY WEIGHT CAPACITY, 2018-2030 (USD THOUSAND)
TABLE 193 THAILAND ROWING MACHINES MARKET, BY DISTRIBUTION CHANNEL, 2018-2030 (USD THOUSAND)
TABLE 194 THAILAND ROWING MACHINES MARKET, BY RESISTANT LEVEL, 2018-2030 (USD THOUSAND)
TABLE 195 THAILAND ROWING MACHINES MARKET, BY COLOR, 2018-2030 (USD THOUSAND)
TABLE 196 THAILAND ROWING MACHINES MARKET, BY END-USER, 2018-2030 (USD THOUSAND)
TABLE 197 THAILAND COMMERCIAL IN ROWING MACHINES MARKET, BY TYPE, 2018-2030 (USD THOUSAND)
TABLE 198 INDONESIA ROWING MACHINES MARKET, BY TYPE, 2018-2030 (USD THOUSAND)
TABLE 199 INDONESIA ROWING MACHINES MARKET, BY BODY TYPE, 2018-2030 (USD THOUSAND)
TABLE 200 INDONESIA ROWING MACHINES MARKET, BY WEIGHT CAPACITY, 2018-2030 (USD THOUSAND)
TABLE 201 INDONESIA ROWING MACHINES MARKET, BY DISTRIBUTION CHANNEL, 2018-2030 (USD THOUSAND)
TABLE 202 INDONESIA ROWING MACHINES MARKET, BY RESISTANT LEVEL, 2018-2030 (USD THOUSAND)
TABLE 203 INDONESIA ROWING MACHINES MARKET, BY COLOR, 2018-2030 (USD THOUSAND)
TABLE 204 INDONESIA ROWING MACHINES MARKET, BY END-USER, 2018-2030 (USD THOUSAND)
TABLE 205 INDONESIA COMMERCIAL IN ROWING MACHINES MARKET, BY TYPE, 2018-2030 (USD THOUSAND)
TABLE 206 MALAYSIA ROWING MACHINES MARKET, BY TYPE, 2018-2030 (USD THOUSAND)
TABLE 207 MALAYSIA ROWING MACHINES MARKET, BY BODY TYPE, 2018-2030 (USD THOUSAND)
TABLE 208 MALAYSIA ROWING MACHINES MARKET, BY WEIGHT CAPACITY, 2018-2030 (USD THOUSAND)
TABLE 209 MALAYSIA ROWING MACHINES MARKET, BY DISTRIBUTION CHANNEL, 2018-2030 (USD THOUSAND)
TABLE 210 MALAYSIA ROWING MACHINES MARKET, BY RESISTANT LEVEL, 2018-2030 (USD THOUSAND)
TABLE 211 MALAYSIA ROWING MACHINES MARKET, BY COLOR, 2018-2030 (USD THOUSAND)
TABLE 212 MALAYSIA ROWING MACHINES MARKET, BY END-USER, 2018-2030 (USD THOUSAND)
TABLE 213 MALAYSIA COMMERCIAL IN ROWING MACHINES MARKET, BY TYPE, 2018-2030 (USD THOUSAND)
TABLE 214 PHILIPPINES ROWING MACHINES MARKET, BY TYPE, 2018-2030 (USD THOUSAND)
TABLE 215 PHILIPPINES ROWING MACHINES MARKET, BY BODY TYPE, 2018-2030 (USD THOUSAND)
TABLE 216 PHILIPPINES ROWING MACHINES MARKET, BY WEIGHT CAPACITY, 2018-2030 (USD THOUSAND)
TABLE 217 PHILIPPINES ROWING MACHINES MARKET, BY DISTRIBUTION CHANNEL, 2018-2030 (USD THOUSAND)
TABLE 218 PHILIPPINES ROWING MACHINES MARKET, BY RESISTANT LEVEL, 2018-2030 (USD THOUSAND)
TABLE 219 PHILIPPINES ROWING MACHINES MARKET, BY COLOR, 2018-2030 (USD THOUSAND)
TABLE 220 PHILIPPINES ROWING MACHINES MARKET, BY END-USER, 2018-2030 (USD THOUSAND)
TABLE 221 PHILIPPINES COMMERCIAL IN ROWING MACHINES MARKET, BY TYPE, 2018-2030 (USD THOUSAND)
TABLE 222 REST OF ASIA-PACIFIC ROWING MACHINES MARKET, BY TYPE, 2018-2030 (USD THOUSAND)
TABLE 223 SOUTH AMERICA ROWING MACHINES MARKET, BY COUNTRY, 2018-2030 (USD THOUSAND)
TABLE 224 SOUTH AMERICA ROWING MACHINES MARKET, BY TYPE, 2018-2030 (USD THOUSAND)
TABLE 225 SOUTH AMERICA ROWING MACHINES MARKET, BY BODY TYPE, 2018-2030 (USD THOUSAND)
TABLE 226 SOUTH AMERICA ROWING MACHINES MARKET, BY WEIGHT CAPACITY, 2018-2030 (USD THOUSAND)
TABLE 227 SOUTH AMERICA ROWING MACHINES MARKET, BY DISTRIBUTION CHANNEL, 2018-2030 (USD THOUSAND)
TABLE 228 SOUTH AMERICA ROWING MACHINES MARKET, BY RESISTANT LEVEL, 2018-2030 (USD THOUSAND)
TABLE 229 SOUTH AMERICA ROWING MACHINES MARKET, BY COLOR, 2018-2030 (USD THOUSAND)
TABLE 230 SOUTH AMERICA ROWING MACHINES MARKET, BY END-USER, 2018-2030 (USD THOUSAND)
TABLE 231 SOUTH AMERICA COMMERCIAL IN ROWING MACHINES MARKET, BY TYPE, 2018-2030 (USD THOUSAND)
TABLE 232 BRAZIL ROWING MACHINES MARKET, BY TYPE, 2018-2030 (USD THOUSAND)
TABLE 233 BRAZIL ROWING MACHINES MARKET, BY BODY TYPE, 2018-2030 (USD THOUSAND)
TABLE 234 BRAZIL ROWING MACHINES MARKET, BY WEIGHT CAPACITY, 2018-2030 (USD THOUSAND)
TABLE 235 BRAZIL ROWING MACHINES MARKET, BY DISTRIBUTION CHANNEL, 2018-2030 (USD THOUSAND)
TABLE 236 BRAZIL ROWING MACHINES MARKET, BY RESISTANT LEVEL, 2018-2030 (USD THOUSAND)
TABLE 237 BRAZIL ROWING MACHINES MARKET, BY COLOR, 2018-2030 (USD THOUSAND)
TABLE 238 BRAZIL ROWING MACHINES MARKET, BY END-USER, 2018-2030 (USD THOUSAND)
TABLE 239 BRAZIL COMMERCIAL IN ROWING MACHINES MARKET, BY TYPE, 2018-2030 (USD THOUSAND)
TABLE 240 ARGENTINA ROWING MACHINES MARKET, BY TYPE, 2018-2030 (USD THOUSAND)
TABLE 241 ARGENTINA ROWING MACHINES MARKET, BY BODY TYPE, 2018-2030 (USD THOUSAND)
TABLE 242 ARGENTINA ROWING MACHINES MARKET, BY WEIGHT CAPACITY, 2018-2030 (USD THOUSAND)
TABLE 243 ARGENTINA ROWING MACHINES MARKET, BY DISTRIBUTION CHANNEL, 2018-2030 (USD THOUSAND)
TABLE 244 ARGENTINA ROWING MACHINES MARKET, BY RESISTANT LEVEL, 2018-2030 (USD THOUSAND)
TABLE 245 ARGENTINA ROWING MACHINES MARKET, BY COLOR, 2018-2030 (USD THOUSAND)
TABLE 246 ARGENTINA ROWING MACHINES MARKET, BY END-USER, 2018-2030 (USD THOUSAND)
TABLE 247 ARGENTINA COMMERCIAL IN ROWING MACHINES MARKET, BY TYPE, 2018-2030 (USD THOUSAND)
TABLE 248 COLOMBIA ROWING MACHINES MARKET, BY TYPE, 2018-2030 (USD THOUSAND)
TABLE 249 COLOMBIA ROWING MACHINES MARKET, BY BODY TYPE, 2018-2030 (USD THOUSAND)
TABLE 250 COLOMBIA ROWING MACHINES MARKET, BY WEIGHT CAPACITY, 2018-2030 (USD THOUSAND)
TABLE 251 COLOMBIA ROWING MACHINES MARKET, BY DISTRIBUTION CHANNEL, 2018-2030 (USD THOUSAND)
TABLE 252 COLOMBIA ROWING MACHINES MARKET, BY RESISTANT LEVEL, 2018-2030 (USD THOUSAND)
TABLE 253 COLOMBIA ROWING MACHINES MARKET, BY COLOR, 2018-2030 (USD THOUSAND)
TABLE 254 COLOMBIA ROWING MACHINES MARKET, BY END-USER, 2018-2030 (USD THOUSAND)
TABLE 255 COLOMBIA COMMERCIAL IN ROWING MACHINES MARKET, BY TYPE, 2018-2030 (USD THOUSAND)
TABLE 256 CHILE ROWING MACHINES MARKET, BY TYPE, 2018-2030 (USD THOUSAND)
TABLE 257 CHILE ROWING MACHINES MARKET, BY BODY TYPE, 2018-2030 (USD THOUSAND)
TABLE 258 CHILE ROWING MACHINES MARKET, BY WEIGHT CAPACITY, 2018-2030 (USD THOUSAND)
TABLE 259 CHILE ROWING MACHINES MARKET, BY DISTRIBUTION CHANNEL, 2018-2030 (USD THOUSAND)
TABLE 260 CHILE ROWING MACHINES MARKET, BY RESISTANT LEVEL, 2018-2030 (USD THOUSAND)
TABLE 261 CHILE ROWING MACHINES MARKET, BY COLOR, 2018-2030 (USD THOUSAND)
TABLE 262 CHILE ROWING MACHINES MARKET, BY END-USER, 2018-2030 (USD THOUSAND)
TABLE 263 CHILE COMMERCIAL IN ROWING MACHINES MARKET, BY TYPE, 2018-2030 (USD THOUSAND)
TABLE 264 PERU ROWING MACHINES MARKET, BY TYPE, 2018-2030 (USD THOUSAND)
TABLE 265 PERU ROWING MACHINES MARKET, BY BODY TYPE, 2018-2030 (USD THOUSAND)
TABLE 266 PERU ROWING MACHINES MARKET, BY WEIGHT CAPACITY, 2018-2030 (USD THOUSAND)
TABLE 267 PERU ROWING MACHINES MARKET, BY DISTRIBUTION CHANNEL, 2018-2030 (USD THOUSAND)
TABLE 268 PERU ROWING MACHINES MARKET, BY RESISTANT LEVEL, 2018-2030 (USD THOUSAND)
TABLE 269 PERU ROWING MACHINES MARKET, BY COLOR, 2018-2030 (USD THOUSAND)
TABLE 270 PERU ROWING MACHINES MARKET, BY END-USER, 2018-2030 (USD THOUSAND)
TABLE 271 PERU COMMERCIAL IN ROWING MACHINES MARKET, BY TYPE, 2018-2030 (USD THOUSAND)
TABLE 272 ECUADOR ROWING MACHINES MARKET, BY TYPE, 2018-2030 (USD THOUSAND)
TABLE 273 ECUADOR ROWING MACHINES MARKET, BY BODY TYPE, 2018-2030 (USD THOUSAND)
TABLE 274 ECUADOR ROWING MACHINES MARKET, BY WEIGHT CAPACITY, 2018-2030 (USD THOUSAND)
TABLE 275 ECUADOR ROWING MACHINES MARKET, BY DISTRIBUTION CHANNEL, 2018-2030 (USD THOUSAND)
TABLE 276 ECUADOR ROWING MACHINES MARKET, BY RESISTANT LEVEL, 2018-2030 (USD THOUSAND)
TABLE 277 ECUADOR ROWING MACHINES MARKET, BY COLOR, 2018-2030 (USD THOUSAND)
TABLE 278 ECUADOR ROWING MACHINES MARKET, BY END-USER, 2018-2030 (USD THOUSAND)
TABLE 279 ECUADOR COMMERCIAL IN ROWING MACHINES MARKET, BY TYPE, 2018-2030 (USD THOUSAND)
TABLE 280 VENEZUELA ROWING MACHINES MARKET, BY TYPE, 2018-2030 (USD THOUSAND)
TABLE 281 VENEZUELA ROWING MACHINES MARKET, BY BODY TYPE, 2018-2030 (USD THOUSAND)
TABLE 282 VENEZUELA ROWING MACHINES MARKET, BY WEIGHT CAPACITY, 2018-2030 (USD THOUSAND)
TABLE 283 VENEZUELA ROWING MACHINES MARKET, BY DISTRIBUTION CHANNEL, 2018-2030 (USD THOUSAND)
TABLE 284 VENEZUELA ROWING MACHINES MARKET, BY RESISTANT LEVEL, 2018-2030 (USD THOUSAND)
TABLE 285 VENEZUELA ROWING MACHINES MARKET, BY COLOR, 2018-2030 (USD THOUSAND)
TABLE 286 VENEZUELA ROWING MACHINES MARKET, BY END-USER, 2018-2030 (USD THOUSAND)
TABLE 287 VENEZUELA COMMERCIAL IN ROWING MACHINES MARKET, BY TYPE, 2018-2030 (USD THOUSAND)
TABLE 288 REST OF SOUTH AMERICA ROWING MACHINES MARKET, BY TYPE, 2018-2030 (USD THOUSAND)
TABLE 289 MIDDLE EAST AND AFRICA ROWING MACHINES MARKET, BY COUNTRY, 2018-2030 (USD THOUSAND)
TABLE 290 MIDDLE EAST AND AFRICA ROWING MACHINES MARKET, BY TYPE, 2018-2030 (USD THOUSAND)
TABLE 291 MIDDLE EAST AND AFRICA ROWING MACHINES MARKET, BY BODY TYPE, 2018-2030 (USD THOUSAND)
TABLE 292 MIDDLE EAST AND AFRICA ROWING MACHINES MARKET, BY WEIGHT CAPACITY, 2018-2030 (USD THOUSAND)
TABLE 293 MIDDLE EAST AND AFRICA ROWING MACHINES MARKET, BY DISTRIBUTION CHANNEL, 2018-2030 (USD THOUSAND)
TABLE 294 MIDDLE EAST AND AFRICA ROWING MACHINES MARKET, BY RESISTANT LEVEL, 2018-2030 (USD THOUSAND)
TABLE 295 MIDDLE EAST AND AFRICA ROWING MACHINES MARKET, BY COLOR, 2018-2030 (USD THOUSAND)
TABLE 296 MIDDLE EAST AND AFRICA ROWING MACHINES MARKET, BY END-USER, 2018-2030 (USD THOUSAND)
TABLE 297 MIDDLE EAST AND AFRICA COMMERCIAL IN ROWING MACHINES MARKET, BY TYPE, 2018-2030 (USD THOUSAND)
TABLE 298 SOUTH AFRICA ROWING MACHINES MARKET, BY TYPE, 2018-2030 (USD THOUSAND)
TABLE 299 SOUTH AFRICA ROWING MACHINES MARKET, BY BODY TYPE, 2018-2030 (USD THOUSAND)
TABLE 300 SOUTH AFRICA ROWING MACHINES MARKET, BY WEIGHT CAPACITY, 2018-2030 (USD THOUSAND)
TABLE 301 SOUTH AFRICA ROWING MACHINES MARKET, BY DISTRIBUTION CHANNEL, 2018-2030 (USD THOUSAND)
TABLE 302 SOUTH AFRICA ROWING MACHINES MARKET, BY RESISTANT LEVEL, 2018-2030 (USD THOUSAND)
TABLE 303 SOUTH AFRICA ROWING MACHINES MARKET, BY COLOR, 2018-2030 (USD THOUSAND)
TABLE 304 SOUTH AFRICA ROWING MACHINES MARKET, BY END-USER, 2018-2030 (USD THOUSAND)
TABLE 305 SOUTH AFRICA COMMERCIAL IN ROWING MACHINES MARKET, BY TYPE, 2018-2030 (USD THOUSAND)
TABLE 306 SAUDI ARABIA ROWING MACHINES MARKET, BY TYPE, 2018-2030 (USD THOUSAND)
TABLE 307 SAUDI ARABIA ROWING MACHINES MARKET, BY BODY TYPE, 2018-2030 (USD THOUSAND)
TABLE 308 SAUDI ARABIA ROWING MACHINES MARKET, BY WEIGHT CAPACITY, 2018-2030 (USD THOUSAND)
TABLE 309 SAUDI ARABIA ROWING MACHINES MARKET, BY DISTRIBUTION CHANNEL, 2018-2030 (USD THOUSAND)
TABLE 310 SAUDI ARABIA ROWING MACHINES MARKET, BY RESISTANT LEVEL, 2018-2030 (USD THOUSAND)
TABLE 311 SAUDI ARABIA ROWING MACHINES MARKET, BY COLOR, 2018-2030 (USD THOUSAND)
TABLE 312 SAUDI ARABIA ROWING MACHINES MARKET, BY END-USER, 2018-2030 (USD THOUSAND)
TABLE 313 SAUDI ARABIA COMMERCIAL IN ROWING MACHINES MARKET, BY TYPE, 2018-2030 (USD THOUSAND)
TABLE 314 UNITED ARAB EMIRATES ROWING MACHINES MARKET, BY TYPE, 2018-2030 (USD THOUSAND)
TABLE 315 UNITED ARAB EMIRATES ROWING MACHINES MARKET, BY BODY TYPE, 2018-2030 (USD THOUSAND)
TABLE 316 UNITED ARAB EMIRATES ROWING MACHINES MARKET, BY WEIGHT CAPACITY, 2018-2030 (USD THOUSAND)
TABLE 317 UNITED ARAB EMIRATES ROWING MACHINES MARKET, BY DISTRIBUTION CHANNEL, 2018-2030 (USD THOUSAND)
TABLE 318 UNITED ARAB EMIRATES ROWING MACHINES MARKET, BY RESISTANT LEVEL, 2018-2030 (USD THOUSAND)
TABLE 319 UNITED ARAB EMIRATES ROWING MACHINES MARKET, BY COLOR, 2018-2030 (USD THOUSAND)
TABLE 320 UNITED ARAB EMIRATES ROWING MACHINES MARKET, BY END-USER, 2018-2030 (USD THOUSAND)
TABLE 321 UNITED ARAB EMIRATES COMMERCIAL IN ROWING MACHINES MARKET, BY TYPE, 2018-2030 (USD THOUSAND)
TABLE 322 EGYPT ROWING MACHINES MARKET, BY TYPE, 2018-2030 (USD THOUSAND)
TABLE 323 EGYPT ROWING MACHINES MARKET, BY BODY TYPE, 2018-2030 (USD THOUSAND)
TABLE 324 EGYPT ROWING MACHINES MARKET, BY WEIGHT CAPACITY, 2018-2030 (USD THOUSAND)
TABLE 325 EGYPT ROWING MACHINES MARKET, BY DISTRIBUTION CHANNEL, 2018-2030 (USD THOUSAND)
TABLE 326 EGYPT ROWING MACHINES MARKET, BY RESISTANT LEVEL, 2018-2030 (USD THOUSAND)
TABLE 327 EGYPT ROWING MACHINES MARKET, BY COLOR, 2018-2030 (USD THOUSAND)
TABLE 328 EGYPT ROWING MACHINES MARKET, BY END-USER, 2018-2030 (USD THOUSAND)
TABLE 329 EGYPT COMMERCIAL IN ROWING MACHINES MARKET, BY TYPE, 2018-2030 (USD THOUSAND)
TABLE 330 ISRAEL ROWING MACHINES MARKET, BY TYPE, 2018-2030 (USD THOUSAND)
TABLE 331 ISRAEL ROWING MACHINES MARKET, BY BODY TYPE, 2018-2030 (USD THOUSAND)
TABLE 332 ISRAEL ROWING MACHINES MARKET, BY WEIGHT CAPACITY, 2018-2030 (USD THOUSAND)
TABLE 333 ISRAEL ROWING MACHINES MARKET, BY DISTRIBUTION CHANNEL, 2018-2030 (USD THOUSAND)
TABLE 334 ISRAEL ROWING MACHINES MARKET, BY RESISTANT LEVEL, 2018-2030 (USD THOUSAND)
TABLE 335 ISRAEL ROWING MACHINES MARKET, BY COLOR, 2018-2030 (USD THOUSAND)
TABLE 336 ISRAEL ROWING MACHINES MARKET, BY END-USER, 2018-2030 (USD THOUSAND)
TABLE 337 ISRAEL COMMERCIAL IN ROWING MACHINES MARKET, BY TYPE, 2018-2030 (USD THOUSAND)
TABLE 338 REST OF MIDDLE EAST AND AFRICA ROWING MACHINES MARKET, BY TYPE, 2018-2030 (USD THOUSAND)
List of Figure
FIGURE 1 GLOBAL ROWING MACHINES MARKET
FIGURE 2 GLOBAL ROWING MACHINES MARKET: DATA TRIANGULATION
FIGURE 3 GLOBAL ROWING MACHINES MARKET: DROC ANALYSIS
FIGURE 4 GLOBAL ROWING MACHINES MARKET: GLOBAL VS REGIONAL MARKET ANALYSIS
FIGURE 5 GLOBAL ROWING MACHINES MARKET: COMPANY RESEARCH ANALYSIS
FIGURE 6 GLOBAL ROWING MACHINES MARKET: THE TYPE LIFE LINE CURVE
FIGURE 7 GLOBAL ROWING MACHINES MARKET: MULTIVARIATE MODELLING
FIGURE 8 GLOBAL ROWING MACHINES MARKET: INTERVIEW DEMOGRAPHICS
FIGURE 9 GLOBAL ROWING MACHINES MARKET: DBMR MARKET POSITION GRID
FIGURE 10 GLOBAL ROWING MACHINES MARKET: THE MARKET CHALLENGE MATRIX
FIGURE 11 GLOBAL ROWING MACHINES MARKET: VENDOR SHARE ANALYSIS
FIGURE 12 GLOBAL ROWING MACHINES MARKET: SEGMENTATION
FIGURE 13 NORTH AMERICA IS EXPECTED TO DOMINATE THE GLOBAL ROWING MACHINES MARKET, WHILE ASIA-PACIFIC IS EXPECTED TO GROW WITH THE HIGHEST CAGR IN THE FORECAST PERIOD
FIGURE 14 RISING AWARENESS TOWARDS WEIGHT MANAGEMENT AMONG MILLENNIALS IS EXPECTED TO DRIVE THE GLOBAL ROWING MACHINES MARKET IN THE FORECAST PERIOD
FIGURE 15 THE AIR SEGMENT IS EXPECTED TO ACCOUNT FOR THE LARGEST SHARE OF THE GLOBAL ROWING MACHINES MARKET IN 2023 AND 2030
FIGURE 16 NORTH AMERICA IS THE FASTEST-GROWING MARKET FOR ROWING MACHINES MARKET MANUFACTURERS IN THE FORECAST PERIOD
FIGURE 17 DRIVERS, RESTRAINTS, OPPORTUNITIES, AND CHALLENGES OF THE GLOBAL ROWING MACHINES MARKET
FIGURE 18 GLOBAL ROWING MACHINES MARKET: SNAPSHOT (2022)
FIGURE 19 GLOBAL ROWING MACHINES MARKET: BY REGION (2022)
FIGURE 20 GLOBAL ROWING MACHINES MARKET: BY REGION (2023 & 2030)
FIGURE 21 GLOBAL ROWING MACHINES MARKET: BY REGION (2022 & 2030)
FIGURE 22 GLOBAL ROWING MACHINES MARKET: BY TYPE (2023-2030)
FIGURE 23 NORTH AMERICA ROWING MACHINES MARKET: SNAPSHOT (2022)
FIGURE 24 NORTH AMERICA ROWING MACHINES MARKET: BY COUNTRY (2022)
FIGURE 25 NORTH AMERICA ROWING MACHINES MARKET: BY COUNTRY (2023 & 2030)
FIGURE 26 NORTH AMERICA ROWING MACHINES MARKET: BY COUNTRY (2022 & 2030)
FIGURE 27 NORTH AMERICA ROWING MACHINES MARKET: BY TYPE (2023 - 2030)
FIGURE 28 EUROPE ROWING MACHINES MARKET: SNAPSHOT (2022)
FIGURE 29 EUROPE ROWING MACHINES MARKET: BY COUNTRY (2022)
FIGURE 30 EUROPE ROWING MACHINES MARKET: BY COUNTRY (2023 & 2030)
FIGURE 31 EUROPE ROWING MACHINES MARKET: BY COUNTRY (2022 & 2030)
FIGURE 32 EUROPE ROWING MACHINES MARKET: BY TYPE (2023 - 2030)
FIGURE 33 ASIA-PACIFIC ROWING MACHINES MARKET: SNAPSHOT (2022)
FIGURE 34 ASIA-PACIFIC ROWING MACHINES MARKET: BY COUNTRY (2022)
FIGURE 35 ASIA-PACIFIC ROWING MACHINES MARKET: BY COUNTRY (2023 & 2030)
FIGURE 36 ASIA-PACIFIC ROWING MACHINES MARKET: BY COUNTRY (2022 & 2030)
FIGURE 37 ASIA-PACIFIC ROWING MACHINES MARKET: BY TYPE (2022 - 2030)
FIGURE 38 SOUTH AMERICA ROWING MACHINES MARKET: SNAPSHOT (2022)
FIGURE 39 SOUTH AMERICA ROWING MACHINES MARKET: BY COUNTRY (2022)
FIGURE 40 SOUTH AMERICA ROWING MACHINES MARKET: BY COUNTRY (2023 & 2030)
FIGURE 41 SOUTH AMERICA ROWING MACHINES MARKET: BY COUNTRY (2022 & 2030)
FIGURE 42 SOUTH AMERICA ROWING MACHINES MARKET: BY TYPE (2023 - 2030)
FIGURE 43 MIDDLE EAST AND AFRICA ROWING MACHINES MARKET: SNAPSHOT (2022)
FIGURE 44 MIDDLE EAST AND AFRICA ROWING MACHINES MARKET: BY COUNTRY (2022)
FIGURE 45 MIDDLE EAST AND AFRICA ROWING MACHINES MARKET: BY COUNTRY (2023 & 2030)
FIGURE 46 MIDDLE EAST AND AFRICA ROWING MACHINES MARKET: BY COUNTRY (2022 & 2030)
FIGURE 47 MIDDLE EAST AND AFRICA ROWING MACHINES MARKET: BY TYPE (2023 - 2030)
FIGURE 48 GLOBAL ROWING MACHINES MARKET: COMPANY SHARE 2022 (%)
FIGURE 49 NORTH AMERICA ROWING MACHINES MARKET: COMPANY SHARE 2022 (%)
FIGURE 50 EUROPE ROWING MACHINES MARKET: COMPANY SHARE 2022 (%)
FIGURE 51 ASIA PACIFIC ROWING MACHINES MARKET: COMPANY SHARE 2022 (%)
Data collection and base year analysis are done using data collection modules with large sample sizes. The stage includes obtaining market information or related data through various sources and strategies. It includes examining and planning all the data acquired from the past in advance. It likewise envelops the examination of information inconsistencies seen across different information sources. The market data is analysed and estimated using market statistical and coherent models. Also, market share analysis and key trend analysis are the major success factors in the market report. To know more, please request an analyst call or drop down your inquiry.
The key research methodology used by DBMR research team is data triangulation which involves data mining, analysis of the impact of data variables on the market and primary (industry expert) validation. Data models include Vendor Positioning Grid, Market Time Line Analysis, Market Overview and Guide, Company Positioning Grid, Patent Analysis, Pricing Analysis, Company Market Share Analysis, Standards of Measurement, Global versus Regional and Vendor Share Analysis. To know more about the research methodology, drop in an inquiry to speak to our industry experts.
Data Bridge Market Research is a leader in advanced formative research. We take pride in servicing our existing and new customers with data and analysis that match and suits their goal. The report can be customized to include price trend analysis of target brands understanding the market for additional countries (ask for the list of countries), clinical trial results data, literature review, refurbished market and product base analysis. Market analysis of target competitors can be analyzed from technology-based analysis to market portfolio strategies. We can add as many competitors that you require data about in the format and data style you are looking for. Our team of analysts can also provide you data in crude raw excel files pivot tables (Fact book) or can assist you in creating presentations from the data sets available in the report.


