
SiC Power Semiconductor Market Analysis and Size
SiC power semiconductors are the most prevalent semiconductors and are considered the best choice for electronics. These SiC power semiconductors are applied in domestic, commercial, and industrial sectors and various other areas. SiC power semiconductors are available in two types of devices, such as SiC discrete devices and SiC bare die. Due to technological advancements, the prevalence of SiC discrete devices has been increasing faster. The SiC power semiconductor' significant property is high thermal conductive properties along with various others that efficiently use electricity. SiC power semiconductors are used in telecommunication, energy and power, renewable power generation, and several other places. SiC power semiconductors are used in power electronics gaining prevalence among individuals. The demand for SiC power semiconductors in the global SiC power semiconductor market is increasing at a higher rate. For this, various market players are introducing new products and forming a partnership to expand their business in the global SiC power semiconductor market.
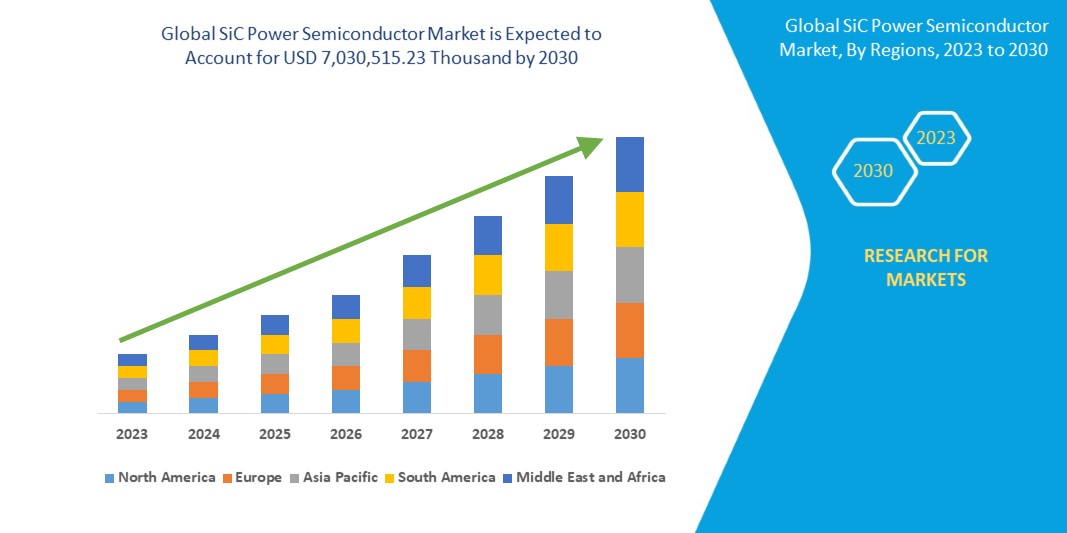
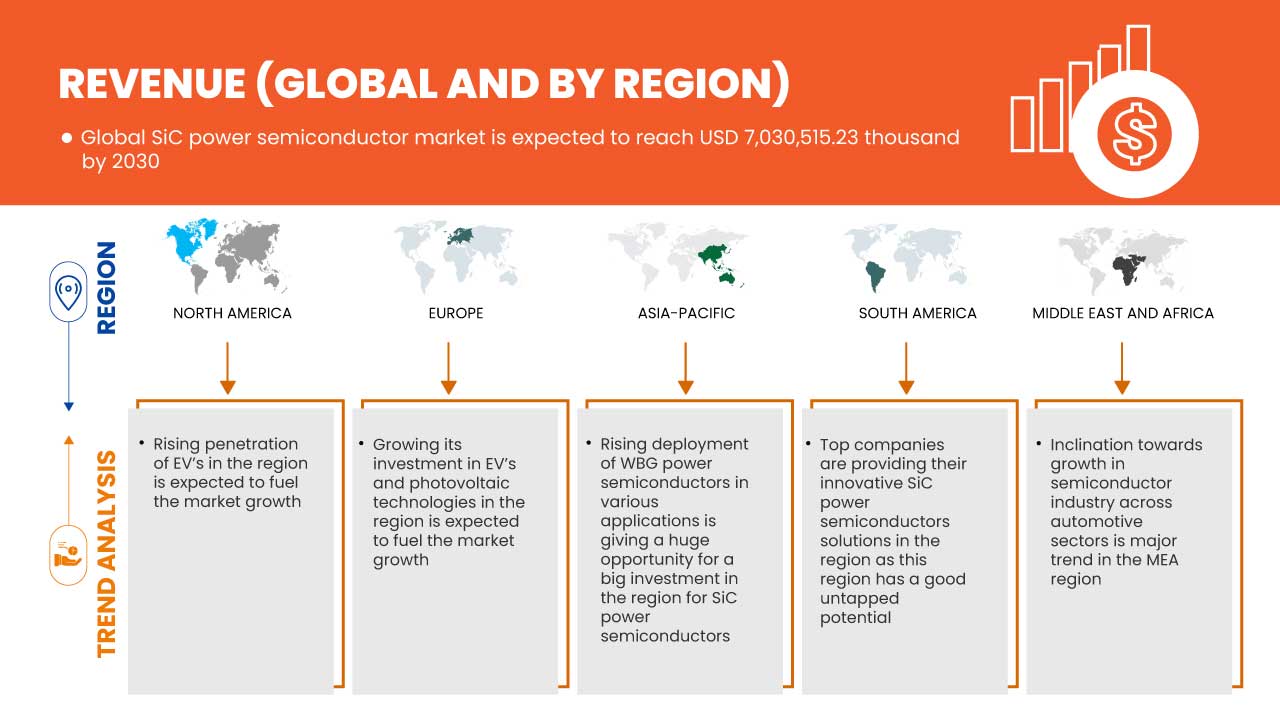
Data Bridge Market Research analyses that the global SiC power semiconductor market is expected to reach a value of USD 7,030,515.23 thousand by 2030, at a CAGR of 26.0% during the forecast period. The global SiC power semiconductor market report also comprehensively covers pricing analysis, patent analysis, and technological advancements.
|
Report Metric |
Details |
|
Forecast Period |
2023 to 2030 |
|
Base Year |
2022 |
|
Historic Years |
2021 (Customizable to 2020-2016) |
|
Quantitative Units |
Revenue in USD Thousand, Volumes in Units, Pricing in USD |
|
Segments Covered |
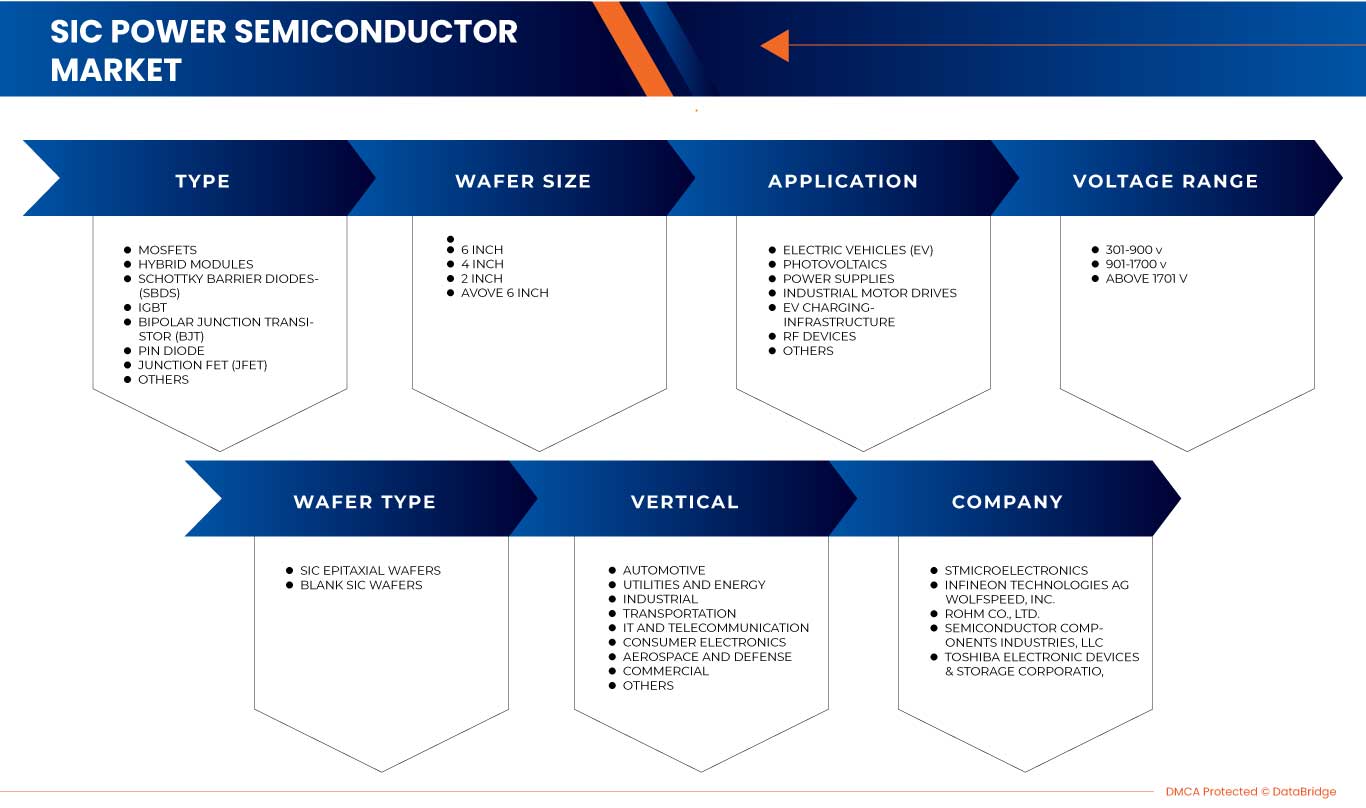
By Type (MOSFETS, Hybrid Modules, Schottky Barrier Diodes (SBDS), IGBT, Bipolar Junction Transistor (BJT), Pin Diode, Junction FET (JFET), and Others), Voltage Range (301-900 V, 901-1700 V, Above 1701 V), Wafer size (6 Inch, 4 Inch, 2 Inch, Above 6 Inch), Wafer type (SiC Epitaxial Wafers, Blank SiC Wafers), Application (Electric Vehicles (EV), Photovoltaics, Power Supplies, Industrial Motor Drives, EV Charging Infrastructure, RF Devices, and Others), Vertical (Automotive, Utilities and Energy, Industrial, Transportation, IT and Telecommunication, Consumer Electronics, Aerospace and Defense, Commercial, and Others). |
|
Regions Covered |
U.S., Canada, Mexico, Germany, U.K., Italy, France, Spain, Switzerland, Netherlands, Belgium, Russia, Turkey, Poland, Sweden, Denmark, Rest of Europe, Japan, China, South Korea, India, Australia and New Zealand, Hong Kong, Taiwan, Singapore, Thailand, Indonesia, Malaysia, Philippines, Vietnam, and Rest of Asia-Pacific, South Africa, UAE., Israel, Egypt, Qatar, Saudi Arabia, Kuwait, Rest of the Middle East and Africa, Brazil, Argentina, and Rest of South America. |
|
Market Players Covered |
WOLFSPEED, INC., STMicroelectronics, ROHM CO., LTD., Fuji Electric Co., Ltd., Mitsubishi Electric Corporation, Texas Instruments Incorporated, Infineon Technologies AG, Semikron Danfoss, Xiamen Powerway Advanced Material Co., Ltd., Renesas Electronics Corporation, TOSHIBA ELECTRONIC DEVICES & STORAGE CORPORATION, Microchip Technology Inc., Semiconductor Components Industries, LLC, NXP Semiconductors, UnitedSiC, SemiQ Inc., Littlefuse, Inc., Allegro MicroSystems, Inc., Hitachi Power Semiconductor Device, Ltd. (A Subsidiary of Hitachi Group), and GeneSiC Semiconductor Inc. among others. |
Market Definition
SiC power semiconductor refers to the type of semiconductor that contains carbon and silicon and operates at very high voltage and temperature. SiC power semiconductors can be used in producing a strong as well as a very hard material. SiC power semiconductors can be implemented in various sectors such as telecommunication, energy and power, automotive, renewable power generation, and in different other areas. They are basically considered due to higher maximum thermal conductive properties that have widened the area of application. SiC power semiconductors are devices that are considered high-frequency power devices that are majorly applicable in wireless communications. SiC semiconductor offers ten times the dielectric breakdown field strength, three times the thermal conductivity, and three times the bandgap as compared to a silicon semiconductor. The SiC semiconductor has taken over the market because of its high performance and efficiency. The SiC power semiconductor offers to work at high voltage and current and offers low on-resistance in addition to being efficient at high temperatures. The combination of silicon carbide has thus proved to be a better and optimum choice of semiconductor.
Global SiC Power Semiconductor Market Dynamics
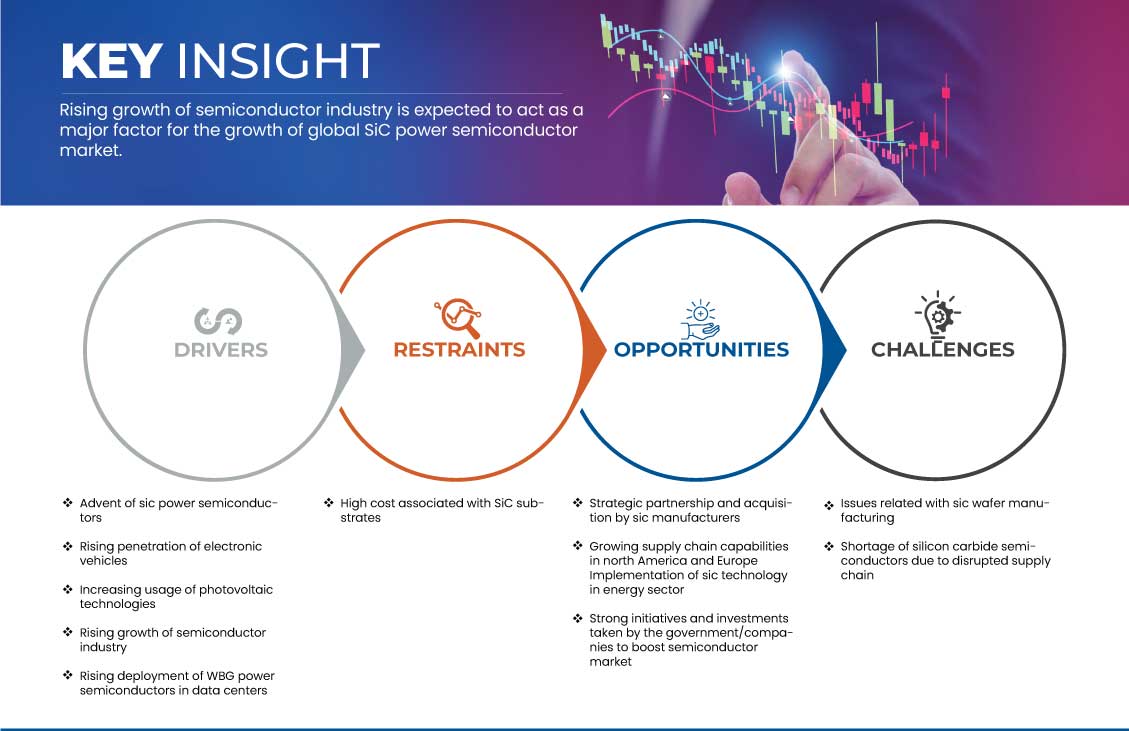
This section deals with understanding the market drivers, advantages, opportunities, restraints, and challenges. All of this is discussed in detail below:
Drivers
- Advent Of SiC Power Semiconductors
There are very useful properties of SiC as a semiconductor material. In applications such as inverters, motor drives, and battery chargers, silicon carbide (SiC) devices offer many advantages, such as improved power density, reduced cooling requirements, and reduced overall system cost. These advantages are enough to make SiC power semiconductors at the high efficient stage.
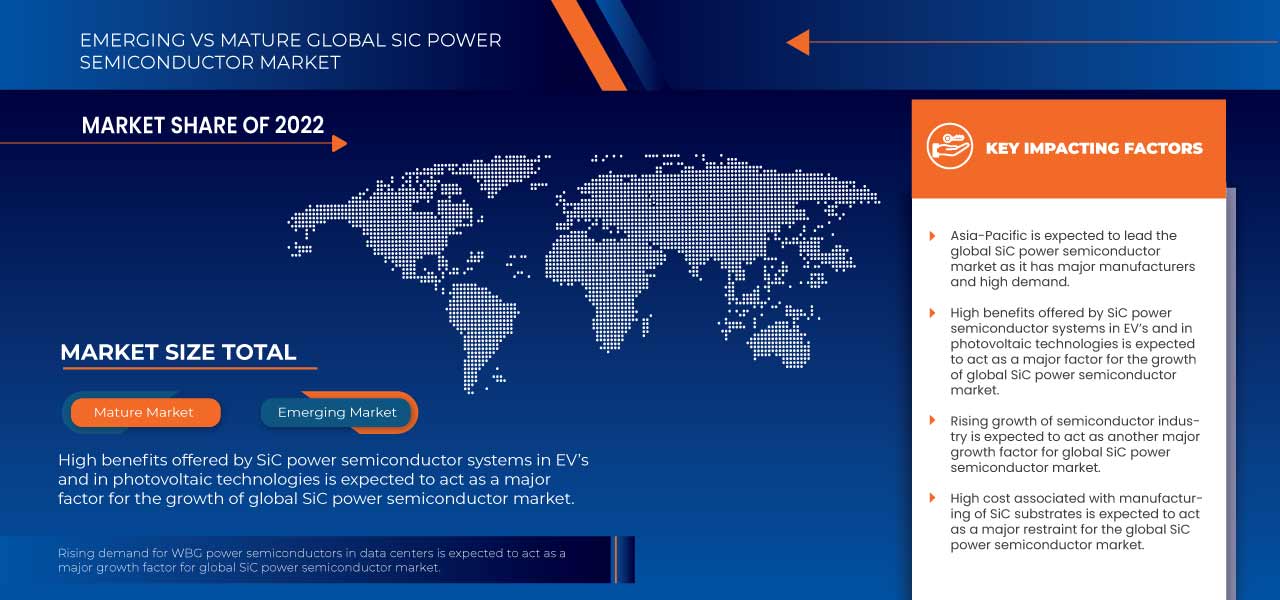
The energy lost by SiC during the reverse recovery phase is only 1% of the energy lost by silicon which creates a huge difference in the efficiency of the material. The virtual absence of a tail current allows a faster turn‑off, and it makes lower losses. Since there is less energy to dissipate, a SiC device able to switch at higher frequencies and improve efficiency. The more efficient, small size, and lower weight of SiC as compared to other materials can create a higher-rated solution or a smaller design with reduced cooling requirements. Thus, the advent of SiC power semiconductors is a major factor expected to drive the growth of the Global SiC power semiconductor market.
- Rising Penetration of Electronic Vehicles
The world is changing so fast, and it is turning towards renewable energy. All sectors, market players, and government institutes are making more focus to build electric vehicle infrastructure and generate more demand for electric vehicles.
As per the information from International Energy Agency (IEA), 16.5 million electric cars were on the road in 2021, a tripling in just three years, and this is a big number as compared to 2020. Electric car sales increased and doubled in China, continued to increase in Europe, and picked up in the U.S. in 2021. This data shows that there is a tremendous increase in the penetration of EVs in the market, which may positively affect the environment as well as the Global SiC power semiconductor market. SiC is highly efficient at high voltages, enabling fast battery charging times that are comparable to filling the tank of conventional vehicles. Silicon carbide power electronics are enabling a surge in 800-volt drive systems, paving the way for lighter EVs with greater range.
Opportunity
- Strategic Partnership and Acquisition by SiC Manufacturers
There are various organizations and market players which are creating strategic partnerships and acquisitions. This partnership creates a huge positive impact on the growth of the Global SiC power semiconductor market. This collaboration results in cooperation, becoming a low-cost route for new competitors to gain technology and market access.
A joint venture involves two or more businesses pooling their resources and expertise to achieve a particular goal. There are many organizations that collaborate with each other's and create a positive impact on the growth of the Global SiC power semiconductor market.
Restraint/Challenge
- Issues Related With SiC Wafer Manufacturing
A SiC wafer is a semiconductor material that has excellent electrical and thermal properties. It is a high-performance semiconductor that is ideal for a wide variety of applications. In addition to its high thermal resistance, it also features a very high level of hardness. There is a lot of fabrication challenge faced by SiC wafer manufacturers. The main defects that can occur during the manufacturing of SiC substrates are crystalline stacking faults, micro pipes, pits, scratches, stains, and surface particles. These factors are adversely affecting the performance of SiC devices which have been detected more frequently on 150-mm wafers than on 100-mm wafers. This is because SiC is the third-hardest composite material in the world and is also very fragile, and its production poses complex challenges related to cycle time, cost, and dicing performance. It is effective to predict that even switching to 200-mm wafers will entail significant issues. In fact, it will be necessary to guarantee the same quality of the substrate, facing an inevitably higher density of defects.
Post-COVID-19 Impact on Global SiC Power Semiconductor Market
The SiC power semiconductor industry noted a gradual decrease in demand due to the lockdown and COVID-19 governmental laws, as manufacturing facilities and services were closed. Even private and public development was called off. Moreover, the industry was also affected by the halt of the supply chain, especially of raw materials used in the manufacturing process of SiC power semiconductors. Stringent government regulations for different industries and restrictions on trade & transportation were some of the top factors that caused a dent in the growth of the market for SiC power semiconductors around the world in 2020 and in the first two quarters of 2021. As the SiC power semiconductor production slowed down owing to the restrictions by governments across the globe, the production was not meeting the demand in the first three quarters of 2020. Moreover, high demand/requirement for SiC power semiconductor products in the automotive and defense industry, in the medical sector, and in hydraulics applications has been witnessed. The resumption of production of the oil and gas industry and automotive; further fuelled the rising demand for SiC power semiconductors across the globe. Thus, this not only led to a hike in demand but also increased the cost of the product.
Recent Developments
- In December 2022, STMicroelectronics and Soitec (Euronext Paris), in designing and manufacturing innovative semiconductor materials, announced the next stage of their cooperation on Silicon Carbide (SiC) substrates, with the qualification of Soitec's SiC substrate technology by ST planned over the next 18 months. The goal of this cooperation is the adoption by ST of Soitec's SmartSiC technology for its future 200mm substrate manufacturing, feeding its devices and modules manufacturing business, with volume production expected in the midterm. This collaboration will help the company to boost its financials as well as the growth of the Global SiC power semiconductor market.
- In July 2022, Semikron Danfoss and the Kyoto-based company ROHM Semiconductor have been collaborating for more than ten years with regard to the implementation of silicon carbide (SiC) inside power modules. Recently, ROHM's latest 4th generation of SiC MOSFETs has been fully qualified in SEMIKRON's eMPack modules for automotive use. Hence, both companies serve worldwide customers' needs. This collaboration enhanced the company's financials and made a positive impact on the growth of the Global SiC power semiconductor market.
Global SiC Power Semiconductor Market Scope
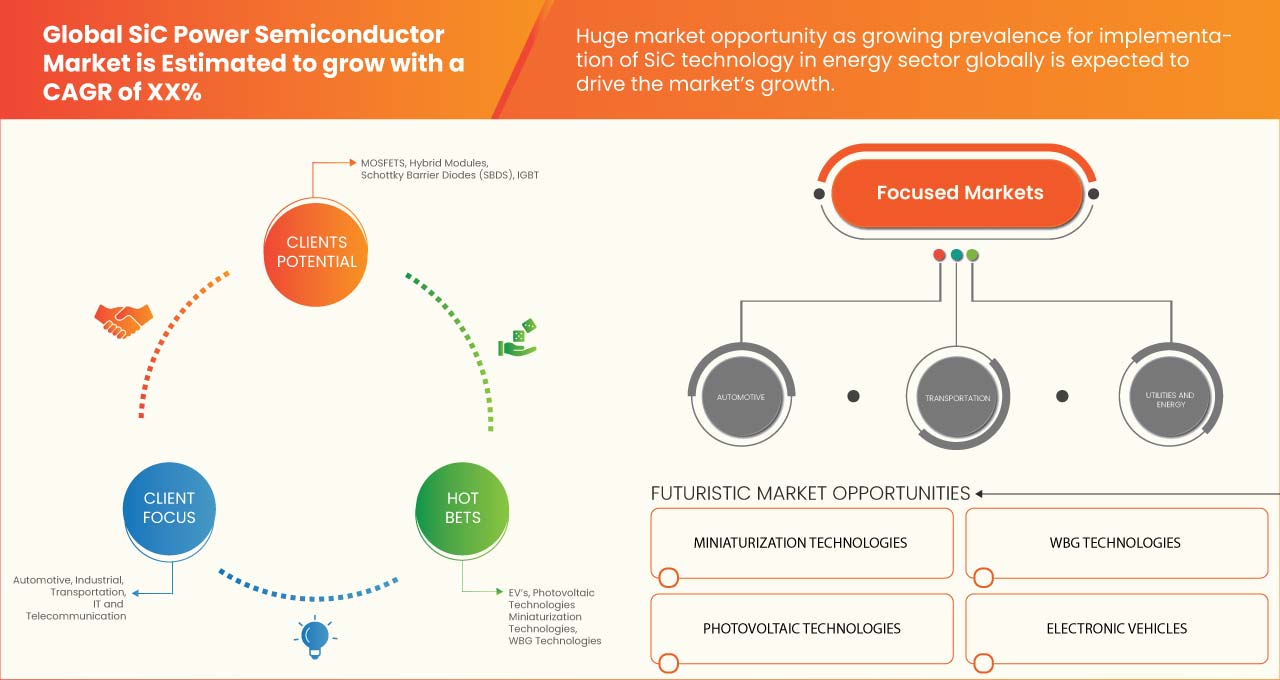
The global SiC power semiconductor market is segmented on the basis of type, voltage range, wafer size, wafer type, application, and vertical. The growth amongst these segments will help you analyze meager growth segments in the industries and provide the users with a valuable market overview and market insights to help them make strategic decisions for identifying core market applications.
By Type
- MOSFETS
- Hybrid Modules
- Schottky Barrier Diodes (SBDS)
- IGBT
- Bipolar Junction Transistor (BJT)
- Pin Diode
- Junction FET (JFET)
- Others
On the basis of type, the global SiC power semiconductor market is segmented into MOSFETS, Hybrid Modules, Schottky Barrier Diodes (SBDS), IGBT, Bipolar Junction Transistor (BJT), Pin Diode, Junction FET (JFET) and others.
By Voltage Range
- 301-900 V
- 901-1700 V
- Above 1701 V
On the basis of voltage range, the global SiC power semiconductor market is segmented into 301-900 V, 901-1700 V, and above 1701 V.
By Wafer Size
- 6 Inch
- 4 Inch
- 2 Inch
- Above 6 Inch
On the basis of wafer size, the global SiC power semiconductor market is segmented into 6 Inch, 4 Inch, 2 Inch, and above 6 Inch.
By Wafer Type
- SiC epitaxial wafers
- Blank SiC wafers
On the basis of the wafer type, the global SiC power semiconductor market is segmented into SiC epitaxial wafers and blank SiC wafers.
By Application
- Electric Vehicles (EV)
- Photovoltaics
- Power supplies
- Industrial motor drives
- EV charging infrastructure
- RF Devices
- Others
On the basis of the application, the global sic power semiconductor market is segmented into electric vehicles (EV), photovoltaics, power supplies, industrial motor drives, EV charging infrastructure, RF devices, and others.
By Vertical
- Automotive
- Utilities and energy
- Industrial
- Transportation
- IT and telecommunication
- Consumer electronics
- Aerospace and defense
- Commercial
- Others
On the basis of the vertical, the global SiC power semiconductor market is segmented into automotive, utilities and energy, industrial, transportation, IT and telecommunication, consumer electronics, aerospace and defense, commercial, and others.
Global SiC Power Semiconductor Market Regional Analysis/Insights
The global SiC power semiconductor market is analyzed, and market size insights and trends are provided by region, type, voltage range, wafer size, wafer type, application, and vertical as referenced above.
The countries covered in the global SiC power semiconductor market report are U.S., Canada, Mexico, Germany, U.K., Italy, France, Spain, Switzerland, Netherlands, Belgium, Russia, Turkey, Poland, Sweden, Denmark, Rest of Europe, Japan, China, South Korea, India, Australia and New Zealand, Hong Kong, Taiwan, Singapore, Thailand, Indonesia, Malaysia, Philippines, Vietnam, and Rest of Asia-Pacific, South Africa, UAE., Israel, Egypt, Qatar, Saudi Arabia, Kuwait, Rest of the Middle East and Africa, Brazil, Argentina, and Rest of South America.
In 2023, the Asia-Pacific region is expected to dominate the global SiC power semiconductor market due to the high demand for SiC power semiconductors. Additionally, the high demand for power modules and related devices is expected to act as a driving factor for the market's growth.
The region section of the report also provides individual market-impacting factors and changes in market regulation that impact the current and future trends of the market. Data points like downstream and upstream value chain analysis, technical trends, and porter's five forces analysis, case studies are some of the pointers used to forecast the market scenario for individual countries. Also, the presence and availability of global brands and their challenges faced due to large or scarce competition from local and domestic brands, the impact of domestic tariffs, and trade routes are considered while providing forecast analysis of the region data.
Competitive Landscape and Global SiC Power Semiconductor Market Share Analysis
The global SiC power semiconductor market competitive landscape provides details by the competitor. Details included are company overview, company financials, revenue generated, market potential, investment in research and development, new market initiatives, global presence, production sites and facilities, production capacities, company strengths and weaknesses, product launch, product width and breadth, and application dominance. The above data points provided are only related to the companies' focus related to the global SiC power semiconductor market.
Some of the major players operating in the global SiC power semiconductor market are WOLFSPEED, INC., STMicroelectronics, ROHM CO., LTD., Fuji Electric Co., Ltd., Mitsubishi Electric Corporation, Texas Instruments Incorporated, Infineon Technologies AG, Semikron Danfoss, Xiamen Powerway Advanced Material Co., Ltd., Renesas Electronics Corporation, TOSHIBA ELECTRONIC DEVICES & STORAGE CORPORATION, Microchip Technology Inc., Semiconductor Components Industries, LLC, NXP Semiconductors, UnitedSiC, SemiQ Inc., Littlefuse, Inc., Allegro MicroSystems, Inc., Hitachi Power Semiconductor Device, Ltd. (A Subsidiary of Hitachi Group), and GeneSiC Semiconductor Inc. among others.
SKU-

- Interactive Data Analysis Dashboard
- Company Analysis Dashboard for high growth potential opportunities
- Research Analyst Access for customization & queries
- Competitor Analysis with Interactive dashboard
- Latest News, Updates & Trend analysis
- Harness the Power of Benchmark Analysis for Comprehensive Competitor Tracking
Table of Content
1 INTRODUCTION
1.1 OBJECTIVES OF THE STUDY
1.2 MARKET DEFINITION
1.3 OVERVIEW OF THE GLOBAL SIC POWER SEMICONDUCTOR MARKET
1.4 CURRENCY AND PRICING
1.5 LIMITATIONS
1.6 MARKET COVERED
2 MARKET SEGMENTATION
2.1 MARKETS COVERED
2.2 YEARS CONSIDERED FOR THE STUDY
2.3 GEOGRAPHIC SCOPE
2.4 DBMR TRIPOD DATA VALIDATION MODEL
2.5 PRIMARY INTERVIEWS WITH KEY OPINION LEADERS
2.6 DBMR MARKET POSITION GRID
2.7 VENDOR SHARE ANALYSIS
2.8 MULTIVARIATE MODELLING
2.9 TYPE CURVE
2.1 MARKET APPLICATION COVERAGE GRID
2.11 SECONDARY SOURCES
2.12 ASSUMPTIONS
3 EXECUTIVE SUMMARY
4 PREMIUM INSIGHTS
5 MARKET OVERVIEW
5.1 DRIVERS
5.1.1 ADVENT OF SIC POWER SEMICONDUCTORS
5.1.2 RISING PENETRATION OF ELECTRONIC VEHICLES
5.1.3 INCREASING USAGE OF PHOTOVOLTAIC TECHNOLOGIES
5.1.4 RISING GROWTH OF SEMICONDUCTOR INDUSTRY
5.1.5 RISING DEPLOYMENT OF WBG POWER SEMICONDUCTORS IN DATA CENTERS
5.2 RESTRAINTS
5.2.1 HIGH COST ASSOCIATED WITH SIC SUBSTRATES
5.3 OPPORTUNITIES
5.3.1 STRATEGIC PARTNERSHIP AND ACQUISITION BY SIC MANUFACTURERS
5.3.2 GROWING SUPPLY CHAIN CAPABILITIES IN NORTH AMERICA AND EUROPE
5.3.3 IMPLEMENTATION OF SIC TECHNOLOGY IN THE ENERGY SECTOR
5.3.4 STRONG INITIATIVES AND INVESTMENTS TAKEN BY THE GOVERNMENT/COMPANIES TO BOOST SEMICONDUCTOR MARKET.
5.4 CHALLENGES
5.4.1 ISSUES RELATED WITH SIC WAFER MANUFACTURING
5.4.2 SHORTAGE OF SILICON CARBIDE SEMICONDUCTORS DUE TO DISRUPTED SUPPLY CHAIN
6 GLOBAL SIC POWER SEMICONDUCTOR MARKET, BY TYPE
6.1 OVERVIEW
6.2 MOSFETS
6.3 HYBRID MODULES
6.4 SCHOTTKY BARRIER DIODES (SBDS)
6.5 IGBT
6.6 BIPOLAR JUNCTION TRANSISTOR (BJT)
6.7 PIN DIODE
6.8 JUNCTION FET (JFET)
6.9 OTHERS
7 GLOBAL SIC POWER SEMICONDUCTOR MARKET, BY VOLTAGE RANGE
7.1 OVERVIEW
7.2 301-900 V
7.3 901-1700 V
7.4 ABOVE 1701 V
8 GLOBAL SIC POWER SEMICONDUCTOR MARKET, BY WAFER SIZE
8.1 OVERVIEW
8.2 6 INCH
8.3 4 INCH
8.4 2 INCH
8.5 ABOVE 6 INCH
9 GLOBAL SIC POWER SEMICONDUCTOR MARKET, BY WAFER TYPE
9.1 OVERVIEW
9.2 SIC EPITAXIAL WAFERS
9.3 BLANK SIC WAFERS
10 GLOBAL SIC POWER SEMICONDUCTOR MARKET, BY APPLICATION
10.1 OVERVIEW
10.2 ELECTRIC VEHICLES
10.3 PHOTOVOLTAICS
10.4 POWER SUPPLIES
10.5 INDUSTRIAL MOTOR DRIVES
10.6 EV CHARGING INFRASTRUCTURE
10.7 RF DEVICES
10.8 OTHERS
11 GLOBAL SIC POWER SEMICONDUCTOR MARKET, BY VERTICAL
11.1 OVERVIEW
11.2 AUTOMOTIVE
11.3 UTILITIES AND ENERGY
11.4 INDUSTRIAL
11.5 TRANSPORTATION
11.6 IT AND TELECOMMUNICATION
11.7 CONSUMER ELECTRONICS
11.8 AEROSPACE AND DEFENSE
11.9 COMMERCIAL
11.1 OTHERS
12 GLOBAL SIC POWER SEMICONDUCTOR MARKET, BY REGION
12.1 OVERVIEW
12.2 ASIA-PACIFIC
12.2.1 CHINA
12.2.2 JAPAN
12.2.3 SOUTH KOREA
12.2.4 INDIA
12.2.5 TAIWAN
12.2.6 AUSTRALIA AND NEW ZEALAND
12.2.7 SINGAPORE
12.2.8 THAILAND
12.2.9 INDONESIA
12.2.10 MALAYSIA
12.2.11 PHILIPPINES
12.2.12 VIETNAM
12.2.13 REST OF ASIA-PACIFIC
12.3 NORTH AMERICA
12.3.1 U.S.
12.3.2 CANADA
12.3.3 MEXICO
12.4 EUROPE
12.4.1 GERMANY
12.4.2 FRANCE
12.4.3 U.K
12.4.4 NETHERLANDS
12.4.5 ITALY
12.4.6 SPAIN
12.4.7 SWITZERLAND
12.4.8 RUSSIA
12.4.9 TURKEY
12.4.10 BELGIUM
12.4.11 POLAND
12.4.12 SWEDEN
12.4.13 DENMARK
12.4.14 REST OF EUROPE
12.5 MIDDLE EAST & AFRICA
12.5.1 ISRAEL
12.5.2 U.A.E.
12.5.3 SAUDI ARABIA
12.5.4 SOUTH AFRICA
12.5.5 EGYPT
12.5.6 KUWAIT
12.5.7 QATAR
12.5.8 REST OF MIDDLE EAST AND AFRICA
12.6 SOUTH AMERICA
12.6.1 BRAZIL
12.6.2 ARGENTINA
12.6.3 REST OF SOUTH AMERICA
13 GLOBAL SIC POWER SEMICONDUCTOR MARKET, COMPANY LANDSCAPE
13.1 COMPANY SHARE ANALYSIS: GLOBAL
13.2 COMPANY SHARE ANALYSIS: NORTH AMERICA
13.3 COMPANY SHARE ANALYSIS: EUROPE
13.4 COMPANY SHARE ANALYSIS: ASIA-PACIFIC
14 SWOT ANALYSIS
15 COMPANY PROFILINGS
15.1 STMICROELECTRONICS
15.1.1 COMPANY SNAPSHOT
15.1.2 REVENUE ANALYSIS
15.1.3 COMPANY SHARE ANALYSIS
15.1.4 PRODUCT PORTFOLIO
15.1.5 RECENT DEVELOPMENTS
15.2 INFINEON TECHNOLOGIES AG
15.2.1 COMPANY SNAPSHOT
15.2.2 REVENUE ANALYSIS
15.2.3 COMPANY SHARE ANALYSIS
15.2.4 PRODUCT PORTFOLIO
15.2.5 RECENT DEVELOPMENTS
15.3 WOLFSPEED INC.
15.3.1 COMPANY SNAPSHOT
15.3.2 REVENUE ANALYSIS
15.3.3 COMPANY SHARE ANALYSIS
15.3.4 PRODUCT PORTFOLIO
15.3.5 RECENT DEVELOPMENTS
15.4 ROHM CO., LTD.
15.4.1 COMPANY SNAPSHOT
15.4.2 REVENUE ANALYSIS
15.4.3 COMPANY SHARE ANALYSIS
15.4.4 PRODUCT PORTFOLIO
15.4.5 RECENT DEVELOPMENTS
15.5 SEMICONDUCTOR COMPONENTS INDUSTRIES LLC
15.5.1 COMPANY SNAPSHOT
15.5.2 REVENUE ANALYSIS
15.5.3 COMPANY SHARE ANALYSIS
15.5.4 PRODUCT PORTFOLIO
15.5.5 RECENT DEVELOPMENTS
15.6 ALLEGRO MICROSYSTEMS, INC.
15.6.1 COMPANY SNAPSHOT
15.6.2 REVENUE ANALYSIS
15.6.3 COMPANY SHARE ANALYSIS
15.6.4 PRODUCT PORTFOLIO
15.6.5 RECENT DEVELOPMENTS
15.7 FUJI ELECTRIC CO. LTD.
15.7.1 COMPANY SNAPSHOT
15.7.2 REVENUE ANALYSIS
15.7.3 PRODUCT PORTFOLIO
15.7.4 RECENT DEVELOPMENTS
15.8 GENESIC SEMICONDUCTOR INC.
15.8.1 COMPANY SNAPSHOT
15.8.2 PRODUCT PORTFOLIO
15.8.3 RECENT DEVELOPMENTS
15.9 HITACHI POWER SEMICONDUCTOR DEVICE, LTD.
15.9.1 COMPANY SNAPSHOT
15.9.2 PRODUCT PORTFOLIO
15.9.3 RECENT DEVELOPMENTS
15.1 LITTLEFUSE, INC.
15.10.1 COMPANY SNAPSHOT
15.10.2 REVENUE ANALYSIS
15.10.3 PRODUCT PORTFOLIO
15.10.4 RECENT DEVELOPMENTS
15.11 MICROCHIP TECHNOLOGY INC.
15.11.1 COMPANY SNAPSHOT
15.11.2 REVENUE ANALYSIS
15.11.3 PRODUCT PORTFOLIO
15.11.4 RECENT DEVELOPMENTS
15.12 MITSUBISHI ELECTRIC CORPORATION
15.12.1 COMPANY SNAPSHOT
15.12.2 REVENUE ANALYSIS
15.12.3 PRODUCT PORTFOLIO
15.12.4 RECENT DEVELOPMENTS
15.13 NXP SEMICONDUCTORS
15.13.1 COMPANY SNAPSHOT
15.13.2 REVENUE ANALYSIS
15.13.3 DESIGN PORTFOLIO
15.13.4 RECENT DEVELOPMENTS
15.14 RENESAS ELECTRONICS CORPORATION
15.14.1 COMPANY SNAPSHOT
15.14.2 REVENUE ANALYSIS
15.14.3 PRODUCT PORTFOLIO
15.14.4 RECENT DEVELOPMENTS
15.15 SEMIKRON DANFOSS
15.15.1 COMPANY SNAPSHOT
15.15.2 PRODUCT PORTFOLIO
15.15.3 RECENT DEVELOPMENTS
15.16 SEMIQ INC.
15.16.1 COMPANY SNAPSHOT
15.16.2 PRODUCT PORTFOLIO
15.16.3 RECENT DEVELOPMENTS
15.17 TEXAS INSTRUMENTS INCORPORATED
15.17.1 COMPANY SNAPSHOT
15.17.2 REVENUE ANALYSIS
15.17.3 PRODUCT PORTFOLIO
15.17.4 RECENT DEVELOPMENTS
15.18 TOSHIBA ELECTRONIC DEVICES AND STORAGE CORPORATION
15.18.1 COMPANY SNAPSHOT
15.18.2 PRODUCTS PORTFOLIO
15.18.3 RECENT DEVELOPMENTS
15.19 UNITEDSIC
15.19.1 COMPANY SNAPSHOT
15.19.2 PRODUCT PORTFOLIO
15.19.3 RECENT DEVELOPMENTS
15.2 XIAMEN POWERWAY ADVANCED MATERIAL CO. LTD.
15.20.1 COMPANY SNAPSHOT
15.20.2 PRODUCT PORTFOLIO
15.20.3 RECENT DEVELOPMENTS
16 QUESTIONNAIRE
17 RELATED REPORTS
List of Table
TABLE 1 GLOBAL SIC POWER SEMICONDUCTOR MARKET, BY TYPE, 2021-2030 (USD THOUSAND)
TABLE 2 GLOBAL MOSFETS IN SIC POWER SEMICONDUCTOR MARKET, BY REGION, 2021-2030 (USD THOUSAND)
TABLE 3 GLOBAL HYBRID MODULES IN SIC POWER SEMICONDUCTOR MARKET, BY REGION, 2021-2030 (USD THOUSAND)
TABLE 4 GLOBAL SCHOTTKY BARRIER DIODES (SBDS) IN SIC POWER SEMICONDUCTOR MARKET, BY REGION, 2021-2030 (USD THOUSAND)
TABLE 5 GLOBAL IGBT IN SIC POWER SEMICONDUCTOR MARKET, BY REGION, 2021-2030 (USD THOUSAND)
TABLE 6 GLOBAL BIPOLAR JUNCTION TRANSISTOR (BJT) IN SIC POWER SEMICONDUCTOR MARKET, BY REGION, 2021-2030 (USD THOUSAND)
TABLE 7 GLOBAL PIN DIODE IN SIC POWER SEMICONDUCTOR MARKET, BY REGION, 2021-2030 (USD THOUSAND)
TABLE 8 GLOBAL JUNCTION FET (JFET) IN SIC POWER SEMICONDUCTOR MARKET, BY REGION, 2021-2030 (USD THOUSAND)
TABLE 9 GLOBAL OTHERS IN SIC POWER SEMICONDUCTOR MARKET, BY REGION, 2021-2030 (USD THOUSAND)
TABLE 10 GLOBAL SIC POWER SEMICONDUCTOR MARKET, BY VOLTAGE RANGE, 2021-2030 (USD THOUSAND)
TABLE 11 GLOBAL 301-900 V IN SIC POWER SEMICONDUCTOR MARKET, BY REGION, 2021-2030 (USD THOUSAND)
TABLE 12 GLOBAL 901-1700 V IN SIC POWER SEMICONDUCTOR MARKET, BY REGION, 2021-2030 (USD THOUSAND)
TABLE 13 GLOBAL ABOVE 1701 V IN SIC POWER SEMICONDUCTOR MARKET, BY REGION, 2021-2030 (USD THOUSAND)
TABLE 14 GLOBAL SIC POWER SEMICONDUCTOR MARKET, BY WAFER SIZE, 2021-2030 (USD THOUSAND)
TABLE 15 GLOBAL 6 INCH IN SIC POWER SEMICONDUCTOR MARKET, BY REGION, 2021-2030 (USD THOUSAND)
TABLE 16 GLOBAL 4 INCH IN SIC POWER SEMICONDUCTOR MARKET, BY REGION, 2021-2030 (USD THOUSAND)
TABLE 17 GLOBAL 2 INCH IN SIC POWER SEMICONDUCTOR MARKET, BY REGION, 2021-2030 (USD THOUSAND)
TABLE 18 GLOBAL ABOVE 6 INCH IN SIC POWER SEMICONDUCTOR MARKET, BY REGION, 2021-2030 (USD THOUSAND)
TABLE 19 GLOBAL SIC POWER SEMICONDUCTOR MARKET, BY WAFER TYPE, 2021-2030 (USD THOUSAND)
TABLE 20 GLOBAL SIC EPITAXIAL WAFERS IN SIC POWER SEMICONDUCTOR MARKET, BY REGION, 2021-2030 (USD THOUSAND)
TABLE 21 GLOBAL BLANK SIC WAFERS IN SIC POWER SEMICONDUCTOR MARKET, BY REGION, 2021-2030 (USD THOUSAND)
TABLE 22 GLOBAL SIC POWER SEMICONDUCTOR MARKET, BY APPLICATION, 2021-2030 (USD THOUSAND)
TABLE 23 GLOBAL ELECTRIC VEHICLES (EV) IN SIC POWER SEMICONDUCTOR MARKET, BY REGION, 2021-2030 (USD THOUSAND)
TABLE 24 GLOBAL PHOTOVOLTAICS IN SIC POWER SEMICONDUCTOR MARKET, BY REGION, 2021-2030 (USD THOUSAND)
TABLE 25 GLOBAL POWER SUPPLIES IN SIC POWER SEMICONDUCTOR MARKET, BY REGION, 2021-2030 (USD THOUSAND)
TABLE 26 GLOBAL INDUSTRIAL MOTOR DRIVES IN SIC POWER SEMICONDUCTOR MARKET, BY REGION, 2021-2030 (USD THOUSAND)
TABLE 27 GLOBAL EV CHARGING INFRASTRUCTURE IN SIC POWER SEMICONDUCTOR MARKET, BY REGION, 2021-2030 (USD THOUSAND)
TABLE 28 GLOBAL RF DEVICES IN SIC POWER SEMICONDUCTOR MARKET, BY REGION, 2021-2030 (USD THOUSAND)
TABLE 29 GLOBAL OTHERS IN SIC POWER SEMICONDUCTOR MARKET, BY REGION, 2021-2030 (USD THOUSAND)
TABLE 30 GLOBAL SIC POWER SEMICONDUCTOR MARKET, BY VERTICAL, 2021-2030 (USD THOUSAND)
TABLE 31 GLOBAL AUTOMOTIVE IN SIC POWER SEMICONDUCTOR MARKET, BY REGION, 2021-2030 (USD THOUSAND)
TABLE 32 GLOBAL UTILITIES AND ENERGY IN SIC POWER SEMICONDUCTOR MARKET, BY REGION, 2021-2030 (USD THOUSAND)
TABLE 33 GLOBAL INDUSTRIAL IN SIC POWER SEMICONDUCTOR MARKET, BY REGION, 2021-2030 (USD THOUSAND)
TABLE 34 GLOBAL TRANSPORTATION IN SIC POWER SEMICONDUCTOR MARKET, BY REGION, 2021-2030 (USD THOUSAND)
TABLE 35 GLOBAL IT AND TELECOMMUNICATION IN SIC POWER SEMICONDUCTOR MARKET, BY REGION, 2021-2030 (USD THOUSAND)
TABLE 36 GLOBAL CONSUMER ELECTRONICS IN SIC POWER SEMICONDUCTOR MARKET, BY REGION, 2021-2030 (USD THOUSAND)
TABLE 37 GLOBAL AEROSPACE AND DEFENSE IN SIC POWER SEMICONDUCTOR MARKET, BY REGION, 2021-2030 (USD THOUSAND)
TABLE 38 GLOBAL COMMERCIAL IN SIC POWER SEMICONDUCTOR MARKET, BY REGION, 2021-2030 (USD THOUSAND)
TABLE 39 GLOBAL OTHERS IN SIC POWER SEMICONDUCTOR MARKET, BY REGION, 2021-2030 (USD THOUSAND)
TABLE 40 GLOBAL SIC POWER SEMICONDUCTOR MARKET, BY REGION, 2021-2030 (USD THOUSAND)
TABLE 41 ASIA-PACIFIC SIC POWER SEMICONDUCTOR MARKET, BY COUNTRY, 2021-2030 (USD THOUSAND)
TABLE 42 ASIA-PACIFIC SIC POWER SEMICONDUCTOR MARKET, BY TYPE, 2021-2030 (USD THOUSAND)
TABLE 43 ASIA-PACIFIC SIC POWER SEMICONDUCTOR MARKET, BY VOLTAGE RANGE, 2021-2030 (USD THOUSAND)
TABLE 44 ASIA-PACIFIC SIC POWER SEMICONDUCTOR MARKET, BY WAFER SIZE, 2021-2030 (USD THOUSAND)
TABLE 45 ASIA-PACIFIC SIC POWER SEMICONDUCTOR MARKET, BY WAFER TYPE, 2021-2030 (USD THOUSAND)
TABLE 46 ASIA-PACIFIC SIC POWER SEMICONDUCTOR MARKET, BY APPLICATION, 2021-2030 (USD THOUSAND)
TABLE 47 ASIA-PACIFIC SIC POWER SEMICONDUCTOR MARKET, BY VERTICAL, 2021-2030 (USD THOUSAND)
TABLE 48 CHINA SIC POWER SEMICONDUCTOR MARKET, BY TYPE, 2021-2030 (USD THOUSAND)
TABLE 49 CHINA SIC POWER SEMICONDUCTOR MARKET, BY VOLTAGE RANGE, 2021-2030 (USD THOUSAND)
TABLE 50 CHINA SIC POWER SEMICONDUCTOR MARKET, BY WAFER SIZE, 2021-2030 (USD THOUSAND)
TABLE 51 CHINA SIC POWER SEMICONDUCTOR MARKET, BY WAFER TYPE, 2021-2030 (USD THOUSAND)
TABLE 52 CHINA SIC POWER SEMICONDUCTOR MARKET, BY APPLICATION, 2021-2030 (USD THOUSAND)
TABLE 53 CHINA SIC POWER SEMICONDUCTOR MARKET, BY VERTICAL, 2021-2030 (USD THOUSAND)
TABLE 54 JAPAN SIC POWER SEMICONDUCTOR MARKET, BY TYPE, 2021-2030 (USD THOUSAND)
TABLE 55 JAPAN SIC POWER SEMICONDUCTOR MARKET, BY VOLTAGE RANGE, 2021-2030 (USD THOUSAND)
TABLE 56 JAPAN SIC POWER SEMICONDUCTOR MARKET, BY WAFER SIZE, 2021-2030 (USD THOUSAND)
TABLE 57 JAPAN SIC POWER SEMICONDUCTOR MARKET, BY WAFER TYPE, 2021-2030 (USD THOUSAND)
TABLE 58 JAPAN SIC POWER SEMICONDUCTOR MARKET, BY APPLICATION, 2021-2030 (USD THOUSAND)
TABLE 59 JAPAN SIC POWER SEMICONDUCTOR MARKET, BY VERTICAL, 2021-2030 (USD THOUSAND)
TABLE 60 SOUTH KOREA SIC POWER SEMICONDUCTOR MARKET, BY TYPE, 2021-2030 (USD THOUSAND)
TABLE 61 SOUTH KOREA SIC POWER SEMICONDUCTOR MARKET, BY VOLTAGE RANGE, 2021-2030 (USD THOUSAND)
TABLE 62 SOUTH KOREA SIC POWER SEMICONDUCTOR MARKET, BY WAFER SIZE, 2021-2030 (USD THOUSAND)
TABLE 63 SOUTH KOREA SIC POWER SEMICONDUCTOR MARKET, BY WAFER TYPE, 2021-2030 (USD THOUSAND)
TABLE 64 SOUTH KOREA SIC POWER SEMICONDUCTOR MARKET, BY APPLICATION, 2021-2030 (USD THOUSAND)
TABLE 65 SOUTH KOREA SIC POWER SEMICONDUCTOR MARKET, BY VERTICAL, 2021-2030 (USD THOUSAND)
TABLE 66 INDIA SIC POWER SEMICONDUCTOR MARKET, BY TYPE, 2021-2030 (USD THOUSAND)
TABLE 67 INDIA SIC POWER SEMICONDUCTOR MARKET, BY VOLTAGE RANGE, 2021-2030 (USD THOUSAND)
TABLE 68 INDIA SIC POWER SEMICONDUCTOR MARKET, BY WAFER SIZE, 2021-2030 (USD THOUSAND)
TABLE 69 INDIA SIC POWER SEMICONDUCTOR MARKET, BY WAFER TYPE, 2021-2030 (USD THOUSAND)
TABLE 70 INDIA SIC POWER SEMICONDUCTOR MARKET, BY APPLICATION, 2021-2030 (USD THOUSAND)
TABLE 71 INDIA SIC POWER SEMICONDUCTOR MARKET, BY VERTICAL, 2021-2030 (USD THOUSAND)
TABLE 72 TAIWAN SIC POWER SEMICONDUCTOR MARKET, BY TYPE, 2021-2030 (USD THOUSAND)
TABLE 73 TAIWAN SIC POWER SEMICONDUCTOR MARKET, BY VOLTAGE RANGE, 2021-2030 (USD THOUSAND)
TABLE 74 TAIWAN SIC POWER SEMICONDUCTOR MARKET, BY WAFER SIZE, 2021-2030 (USD THOUSAND)
TABLE 75 TAIWAN SIC POWER SEMICONDUCTOR MARKET, BY WAFER TYPE, 2021-2030 (USD THOUSAND)
TABLE 76 TAIWAN SIC POWER SEMICONDUCTOR MARKET, BY APPLICATION, 2021-2030 (USD THOUSAND)
TABLE 77 TAIWAN SIC POWER SEMICONDUCTOR MARKET, BY VERTICAL, 2021-2030 (USD THOUSAND)
TABLE 78 AUSTRALIA AND NEW ZEALAND SIC POWER SEMICONDUCTOR MARKET, BY TYPE, 2021-2030 (USD THOUSAND)
TABLE 79 AUSTRALIA AND NEW ZEALAND SIC POWER SEMICONDUCTOR MARKET, BY VOLTAGE RANGE, 2021-2030 (USD THOUSAND)
TABLE 80 AUSTRALIA AND NEW ZEALAND SIC POWER SEMICONDUCTOR MARKET, BY WAFER SIZE, 2021-2030 (USD THOUSAND)
TABLE 81 AUSTRALIA AND NEW ZEALAND SIC POWER SEMICONDUCTOR MARKET, BY WAFER TYPE, 2021-2030 (USD THOUSAND)
TABLE 82 AUSTRALIA AND NEW ZEALAND SIC POWER SEMICONDUCTOR MARKET, BY APPLICATION, 2021-2030 (USD THOUSAND)
TABLE 83 AUSTRALIA AND NEW ZEALAND SIC POWER SEMICONDUCTOR MARKET, BY VERTICAL, 2021-2030 (USD THOUSAND)
TABLE 84 SINGAPORE SIC POWER SEMICONDUCTOR MARKET, BY TYPE, 2021-2030 (USD THOUSAND)
TABLE 85 SINGAPORE SIC POWER SEMICONDUCTOR MARKET, BY VOLTAGE RANGE, 2021-2030 (USD THOUSAND)
TABLE 86 SINGAPORE SIC POWER SEMICONDUCTOR MARKET, BY WAFER SIZE, 2021-2030 (USD THOUSAND)
TABLE 87 SINGAPORE SIC POWER SEMICONDUCTOR MARKET, BY WAFER TYPE, 2021-2030 (USD THOUSAND)
TABLE 88 SINGAPORE SIC POWER SEMICONDUCTOR MARKET, BY APPLICATION, 2021-2030 (USD THOUSAND)
TABLE 89 SINGAPORE SIC POWER SEMICONDUCTOR MARKET, BY VERTICAL, 2021-2030 (USD THOUSAND)
TABLE 90 THAILAND SIC POWER SEMICONDUCTOR MARKET, BY TYPE, 2021-2030 (USD THOUSAND)
TABLE 91 THAILAND SIC POWER SEMICONDUCTOR MARKET, BY VOLTAGE RANGE, 2021-2030 (USD THOUSAND)
TABLE 92 THAILAND SIC POWER SEMICONDUCTOR MARKET, BY WAFER SIZE, 2021-2030 (USD THOUSAND)
TABLE 93 THAILAND SIC POWER SEMICONDUCTOR MARKET, BY WAFER TYPE, 2021-2030 (USD THOUSAND)
TABLE 94 THAILAND SIC POWER SEMICONDUCTOR MARKET, BY APPLICATION, 2021-2030 (USD THOUSAND)
TABLE 95 THAILAND SIC POWER SEMICONDUCTOR MARKET, BY VERTICAL, 2021-2030 (USD THOUSAND)
TABLE 96 INDONESIA SIC POWER SEMICONDUCTOR MARKET, BY TYPE, 2021-2030 (USD THOUSAND)
TABLE 97 INDONESIA SIC POWER SEMICONDUCTOR MARKET, BY VOLTAGE RANGE, 2021-2030 (USD THOUSAND)
TABLE 98 INDONESIA SIC POWER SEMICONDUCTOR MARKET, BY WAFER SIZE, 2021-2030 (USD THOUSAND)
TABLE 99 INDONESIA SIC POWER SEMICONDUCTOR MARKET, BY WAFER TYPE, 2021-2030 (USD THOUSAND)
TABLE 100 INDONESIA SIC POWER SEMICONDUCTOR MARKET, BY APPLICATION, 2021-2030 (USD THOUSAND)
TABLE 101 INDONESIA SIC POWER SEMICONDUCTOR MARKET, BY VERTICAL, 2021-2030 (USD THOUSAND)
TABLE 102 MALAYSIA SIC POWER SEMICONDUCTOR MARKET, BY TYPE, 2021-2030 (USD THOUSAND)
TABLE 103 MALAYSIA SIC POWER SEMICONDUCTOR MARKET, BY VOLTAGE RANGE, 2021-2030 (USD THOUSAND)
TABLE 104 MALAYSIA SIC POWER SEMICONDUCTOR MARKET, BY WAFER SIZE, 2021-2030 (USD THOUSAND)
TABLE 105 MALAYSIA SIC POWER SEMICONDUCTOR MARKET, BY WAFER TYPE, 2021-2030 (USD THOUSAND)
TABLE 106 MALAYSIA SIC POWER SEMICONDUCTOR MARKET, BY APPLICATION, 2021-2030 (USD THOUSAND)
TABLE 107 MALAYSIA SIC POWER SEMICONDUCTOR MARKET, BY VERTICAL, 2021-2030 (USD THOUSAND)
TABLE 108 PHILIPPINES SIC POWER SEMICONDUCTOR MARKET, BY TYPE, 2021-2030 (USD THOUSAND)
TABLE 109 PHILIPPINES SIC POWER SEMICONDUCTOR MARKET, BY VOLTAGE RANGE, 2021-2030 (USD THOUSAND)
TABLE 110 PHILIPPINES SIC POWER SEMICONDUCTOR MARKET, BY WAFER SIZE, 2021-2030 (USD THOUSAND)
TABLE 111 PHILIPPINES SIC POWER SEMICONDUCTOR MARKET, BY WAFER TYPE, 2021-2030 (USD THOUSAND)
TABLE 112 PHILIPPINES SIC POWER SEMICONDUCTOR MARKET, BY APPLICATION, 2021-2030 (USD THOUSAND)
TABLE 113 PHILIPPINES SIC POWER SEMICONDUCTOR MARKET, BY VERTICAL, 2021-2030 (USD THOUSAND)
TABLE 114 VIETNAM SIC POWER SEMICONDUCTOR MARKET, BY TYPE, 2021-2030 (USD THOUSAND)
TABLE 115 VIETNAM SIC POWER SEMICONDUCTOR MARKET, BY VOLTAGE RANGE, 2021-2030 (USD THOUSAND)
TABLE 116 VIETNAM SIC POWER SEMICONDUCTOR MARKET, BY WAFER SIZE, 2021-2030 (USD THOUSAND)
TABLE 117 VIETNAM SIC POWER SEMICONDUCTOR MARKET, BY WAFER TYPE, 2021-2030 (USD THOUSAND)
TABLE 118 VIETNAM SIC POWER SEMICONDUCTOR MARKET, BY APPLICATION, 2021-2030 (USD THOUSAND)
TABLE 119 VIETNAM SIC POWER SEMICONDUCTOR MARKET, BY VERTICAL, 2021-2030 (USD THOUSAND)
TABLE 120 REST OF ASIA-PACIFIC SIC POWER SEMICONDUCTOR MARKET, BY TYPE, 2021-2030 (USD THOUSAND)
TABLE 121 NORTH AMERICA SIC POWER SEMICONDUCTOR MARKET, BY COUNTRY, 2021-2030 (USD THOUSAND)
TABLE 122 NORTH AMERICA SIC POWER SEMICONDUCTOR MARKET, BY TYPE, 2021-2030 (USD THOUSAND)
TABLE 123 NORTH AMERICA SIC POWER SEMICONDUCTOR MARKET, BY VOLTAGE RANGE, 2021-2030 (USD THOUSAND)
TABLE 124 NORTH AMERICA SIC POWER SEMICONDUCTOR MARKET, BY WAFER SIZE, 2021-2030 (USD THOUSAND)
TABLE 125 NORTH AMERICA SIC POWER SEMICONDUCTOR MARKET, BY WAFER TYPE, 2021-2030 (USD THOUSAND)
TABLE 126 NORTH AMERICA SIC POWER SEMICONDUCTOR MARKET, BY APPLICATION, 2021-2030 (USD THOUSAND)
TABLE 127 NORTH AMERICA SIC POWER SEMICONDUCTOR MARKET, BY VERTICAL, 2021-2030 (USD THOUSAND)
TABLE 128 U.S. SIC POWER SEMICONDUCTOR MARKET, BY TYPE, 2021-2030 (USD THOUSAND)
TABLE 129 U.S. SIC POWER SEMICONDUCTOR MARKET, BY VOLTAGE RANGE, 2021-2030 (USD THOUSAND)
TABLE 130 U.S. SIC POWER SEMICONDUCTOR MARKET, BY WAFER SIZE, 2021-2030 (USD THOUSAND)
TABLE 131 U.S. SIC POWER SEMICONDUCTOR MARKET, BY WAFER TYPE, 2021-2030 (USD THOUSAND)
TABLE 132 U.S. SIC POWER SEMICONDUCTOR MARKET, BY APPLICATION, 2021-2030 (USD THOUSAND)
TABLE 133 U.S. SIC POWER SEMICONDUCTOR MARKET, BY VERTICAL, 2021-2030 (USD THOUSAND)
TABLE 134 CANADA SIC POWER SEMICONDUCTOR MARKET, BY TYPE, 2021-2030 (USD THOUSAND)
TABLE 135 CANADA SIC POWER SEMICONDUCTOR MARKET, BY VOLTAGE RANGE, 2021-2030 (USD THOUSAND)
TABLE 136 CANADA SIC POWER SEMICONDUCTOR MARKET, BY WAFER SIZE, 2021-2030 (USD THOUSAND)
TABLE 137 CANADA SIC POWER SEMICONDUCTOR MARKET, BY WAFER TYPE, 2021-2030 (USD THOUSAND)
TABLE 138 CANADA SIC POWER SEMICONDUCTOR MARKET, BY APPLICATION, 2021-2030 (USD THOUSAND)
TABLE 139 CANADA SIC POWER SEMICONDUCTOR MARKET, BY VERTICAL, 2021-2030 (USD THOUSAND)
TABLE 140 MEXICO SIC POWER SEMICONDUCTOR MARKET, BY TYPE, 2021-2030 (USD THOUSAND)
TABLE 141 MEXICO SIC POWER SEMICONDUCTOR MARKET, BY VOLTAGE RANGE, 2021-2030 (USD THOUSAND)
TABLE 142 MEXICO SIC POWER SEMICONDUCTOR MARKET, BY WAFER SIZE, 2021-2030 (USD THOUSAND)
TABLE 143 MEXICO SIC POWER SEMICONDUCTOR MARKET, BY WAFER TYPE, 2021-2030 (USD THOUSAND)
TABLE 144 MEXICO SIC POWER SEMICONDUCTOR MARKET, BY APPLICATION, 2021-2030 (USD THOUSAND)
TABLE 145 MEXICO SIC POWER SEMICONDUCTOR MARKET, BY VERTICAL, 2021-2030 (USD THOUSAND)
TABLE 146 EUROPE SIC POWER SEMICONDUCTOR MARKET, BY COUNTRY, 2021-2030 (USD THOUSAND)
TABLE 147 EUROPE SIC POWER SEMICONDUCTOR MARKET, BY TYPE, 2021-2030 (USD THOUSAND)
TABLE 148 EUROPE SIC POWER SEMICONDUCTOR MARKET, BY VOLTAGE RANGE, 2021-2030 (USD THOUSAND)
TABLE 149 EUROPE SIC POWER SEMICONDUCTOR MARKET, BY WAFER SIZE, 2021-2030 (USD THOUSAND)
TABLE 150 EUROPE SIC POWER SEMICONDUCTOR MARKET, BY WAFER TYPE, 2021-2030 (USD THOUSAND)
TABLE 151 EUROPE SIC POWER SEMICONDUCTOR MARKET, BY APPLICATION, 2021-2030 (USD THOUSAND)
TABLE 152 EUROPE SIC POWER SEMICONDUCTOR MARKET, BY VERTICAL, 2021-2030 (USD THOUSAND)
TABLE 153 GERMANY SIC POWER SEMICONDUCTOR MARKET, BY TYPE, 2021-2030 (USD THOUSAND)
TABLE 154 GERMANY SIC POWER SEMICONDUCTOR MARKET, BY VOLTAGE RANGE, 2021-2030 (USD THOUSAND)
TABLE 155 GERMANY SIC POWER SEMICONDUCTOR MARKET, BY WAFER SIZE, 2021-2030 (USD THOUSAND)
TABLE 156 GERMANY SIC POWER SEMICONDUCTOR MARKET, BY WAFER TYPE, 2021-2030 (USD THOUSAND)
TABLE 157 GERMANY SIC POWER SEMICONDUCTOR MARKET, BY APPLICATION, 2021-2030 (USD THOUSAND)
TABLE 158 GERMANY SIC POWER SEMICONDUCTOR MARKET, BY VERTICAL, 2021-2030 (USD THOUSAND)
TABLE 159 FRANCE SIC POWER SEMICONDUCTOR MARKET, BY TYPE, 2021-2030 (USD THOUSAND)
TABLE 160 FRANCE SIC POWER SEMICONDUCTOR MARKET, BY VOLTAGE RANGE, 2021-2030 (USD THOUSAND)
TABLE 161 FRANCE SIC POWER SEMICONDUCTOR MARKET, BY WAFER SIZE, 2021-2030 (USD THOUSAND)
TABLE 162 FRANCE SIC POWER SEMICONDUCTOR MARKET, BY WAFER TYPE, 2021-2030 (USD THOUSAND)
TABLE 163 FRANCE SIC POWER SEMICONDUCTOR MARKET, BY APPLICATION, 2021-2030 (USD THOUSAND)
TABLE 164 FRANCE SIC POWER SEMICONDUCTOR MARKET, BY VERTICAL, 2021-2030 (USD THOUSAND)
TABLE 165 U.K. SIC POWER SEMICONDUCTOR MARKET, BY TYPE, 2021-2030 (USD THOUSAND)
TABLE 166 U.K. SIC POWER SEMICONDUCTOR MARKET, BY VOLTAGE RANGE, 2021-2030 (USD THOUSAND)
TABLE 167 U.K. SIC POWER SEMICONDUCTOR MARKET, BY WAFER SIZE, 2021-2030 (USD THOUSAND)
TABLE 168 U.K. SIC POWER SEMICONDUCTOR MARKET, BY WAFER TYPE, 2021-2030 (USD THOUSAND)
TABLE 169 U.K. SIC POWER SEMICONDUCTOR MARKET, BY APPLICATION, 2021-2030 (USD THOUSAND)
TABLE 170 U.K. SIC POWER SEMICONDUCTOR MARKET, BY VERTICAL, 2021-2030 (USD THOUSAND)
TABLE 171 NETHERLANDS SIC POWER SEMICONDUCTOR MARKET, BY TYPE, 2021-2030 (USD THOUSAND)
TABLE 172 NETHERLANDS SIC POWER SEMICONDUCTOR MARKET, BY VOLTAGE RANGE, 2021-2030 (USD THOUSAND)
TABLE 173 NETHERLANDS SIC POWER SEMICONDUCTOR MARKET, BY WAFER SIZE, 2021-2030 (USD THOUSAND)
TABLE 174 NETHERLANDS SIC POWER SEMICONDUCTOR MARKET, BY WAFER TYPE, 2021-2030 (USD THOUSAND)
TABLE 175 NETHERLANDS SIC POWER SEMICONDUCTOR MARKET, BY APPLICATION, 2021-2030 (USD THOUSAND)
TABLE 176 NETHERLANDS SIC POWER SEMICONDUCTOR MARKET, BY VERTICAL, 2021-2030 (USD THOUSAND)
TABLE 177 ITALY SIC POWER SEMICONDUCTOR MARKET, BY TYPE, 2021-2030 (USD THOUSAND)
TABLE 178 ITALY SIC POWER SEMICONDUCTOR MARKET, BY VOLTAGE RANGE, 2021-2030 (USD THOUSAND)
TABLE 179 ITALY SIC POWER SEMICONDUCTOR MARKET, BY WAFER SIZE, 2021-2030 (USD THOUSAND)
TABLE 180 ITALY SIC POWER SEMICONDUCTOR MARKET, BY WAFER TYPE, 2021-2030 (USD THOUSAND)
TABLE 181 ITALY SIC POWER SEMICONDUCTOR MARKET, BY APPLICATION, 2021-2030 (USD THOUSAND)
TABLE 182 ITALY SIC POWER SEMICONDUCTOR MARKET, BY VERTICAL, 2021-2030 (USD THOUSAND)
TABLE 183 SPAIN SIC POWER SEMICONDUCTOR MARKET, BY TYPE, 2021-2030 (USD THOUSAND)
TABLE 184 SPAIN SIC POWER SEMICONDUCTOR MARKET, BY VOLTAGE RANGE, 2021-2030 (USD THOUSAND)
TABLE 185 SPAIN SIC POWER SEMICONDUCTOR MARKET, BY WAFER SIZE, 2021-2030 (USD THOUSAND)
TABLE 186 SPAIN SIC POWER SEMICONDUCTOR MARKET, BY WAFER TYPE, 2021-2030 (USD THOUSAND)
TABLE 187 SPAIN SIC POWER SEMICONDUCTOR MARKET, BY APPLICATION, 2021-2030 (USD THOUSAND)
TABLE 188 SPAIN SIC POWER SEMICONDUCTOR MARKET, BY VERTICAL, 2021-2030 (USD THOUSAND)
TABLE 189 SWITZERLAND SIC POWER SEMICONDUCTOR MARKET, BY TYPE, 2021-2030 (USD THOUSAND)
TABLE 190 SWITZERLAND SIC POWER SEMICONDUCTOR MARKET, BY VOLTAGE RANGE, 2021-2030 (USD THOUSAND)
TABLE 191 SWITZERLAND SIC POWER SEMICONDUCTOR MARKET, BY WAFER SIZE, 2021-2030 (USD THOUSAND)
TABLE 192 SWITZERLAND SIC POWER SEMICONDUCTOR MARKET, BY WAFER TYPE, 2021-2030 (USD THOUSAND)
TABLE 193 SWITZERLAND SIC POWER SEMICONDUCTOR MARKET, BY APPLICATION, 2021-2030 (USD THOUSAND)
TABLE 194 SWITZERLAND SIC POWER SEMICONDUCTOR MARKET, BY VERTICAL, 2021-2030 (USD THOUSAND)
TABLE 195 RUSSIA SIC POWER SEMICONDUCTOR MARKET, BY TYPE, 2021-2030 (USD THOUSAND)
TABLE 196 RUSSIA SIC POWER SEMICONDUCTOR MARKET, BY VOLTAGE RANGE, 2021-2030 (USD THOUSAND)
TABLE 197 RUSSIA SIC POWER SEMICONDUCTOR MARKET, BY WAFER SIZE, 2021-2030 (USD THOUSAND)
TABLE 198 RUSSIA SIC POWER SEMICONDUCTOR MARKET, BY WAFER TYPE, 2021-2030 (USD THOUSAND)
TABLE 199 RUSSIA SIC POWER SEMICONDUCTOR MARKET, BY APPLICATION, 2021-2030 (USD THOUSAND)
TABLE 200 RUSSIA SIC POWER SEMICONDUCTOR MARKET, BY VERTICAL, 2021-2030 (USD THOUSAND)
TABLE 201 TURKEY SIC POWER SEMICONDUCTOR MARKET, BY TYPE, 2021-2030 (USD THOUSAND)
TABLE 202 TURKEY SIC POWER SEMICONDUCTOR MARKET, BY VOLTAGE RANGE, 2021-2030 (USD THOUSAND)
TABLE 203 TURKEY SIC POWER SEMICONDUCTOR MARKET, BY WAFER SIZE, 2021-2030 (USD THOUSAND)
TABLE 204 TURKEY SIC POWER SEMICONDUCTOR MARKET, BY WAFER TYPE, 2021-2030 (USD THOUSAND)
TABLE 205 TURKEY SIC POWER SEMICONDUCTOR MARKET, BY APPLICATION, 2021-2030 (USD THOUSAND)
TABLE 206 TURKEY SIC POWER SEMICONDUCTOR MARKET, BY VERTICAL, 2021-2030 (USD THOUSAND)
TABLE 207 BELGIUM SIC POWER SEMICONDUCTOR MARKET, BY TYPE, 2021-2030 (USD THOUSAND)
TABLE 208 BELGIUM SIC POWER SEMICONDUCTOR MARKET, BY VOLTAGE RANGE, 2021-2030 (USD THOUSAND)
TABLE 209 BELGIUM SIC POWER SEMICONDUCTOR MARKET, BY WAFER SIZE, 2021-2030 (USD THOUSAND)
TABLE 210 BELGIUM SIC POWER SEMICONDUCTOR MARKET, BY WAFER TYPE, 2021-2030 (USD THOUSAND)
TABLE 211 BELGIUM SIC POWER SEMICONDUCTOR MARKET, BY APPLICATION, 2021-2030 (USD THOUSAND)
TABLE 212 BELGIUM SIC POWER SEMICONDUCTOR MARKET, BY VERTICAL, 2021-2030 (USD THOUSAND)
TABLE 213 POLAND SIC POWER SEMICONDUCTOR MARKET, BY TYPE, 2021-2030 (USD THOUSAND)
TABLE 214 POLAND SIC POWER SEMICONDUCTOR MARKET, BY VOLTAGE RANGE, 2021-2030 (USD THOUSAND)
TABLE 215 POLAND SIC POWER SEMICONDUCTOR MARKET, BY WAFER SIZE, 2021-2030 (USD THOUSAND)
TABLE 216 POLAND SIC POWER SEMICONDUCTOR MARKET, BY WAFER TYPE, 2021-2030 (USD THOUSAND)
TABLE 217 POLAND SIC POWER SEMICONDUCTOR MARKET, BY APPLICATION, 2021-2030 (USD THOUSAND)
TABLE 218 POLAND SIC POWER SEMICONDUCTOR MARKET, BY VERTICAL, 2021-2030 (USD THOUSAND)
TABLE 219 SWEDEN SIC POWER SEMICONDUCTOR MARKET, BY TYPE, 2021-2030 (USD THOUSAND)
TABLE 220 SWEDEN SIC POWER SEMICONDUCTOR MARKET, BY VOLTAGE RANGE, 2021-2030 (USD THOUSAND)
TABLE 221 SWEDEN SIC POWER SEMICONDUCTOR MARKET, BY WAFER SIZE, 2021-2030 (USD THOUSAND)
TABLE 222 SWEDEN SIC POWER SEMICONDUCTOR MARKET, BY WAFER TYPE, 2021-2030 (USD THOUSAND)
TABLE 223 SWEDEN SIC POWER SEMICONDUCTOR MARKET, BY APPLICATION, 2021-2030 (USD THOUSAND)
TABLE 224 SWEDEN SIC POWER SEMICONDUCTOR MARKET, BY VERTICAL, 2021-2030 (USD THOUSAND)
TABLE 225 DENMARK SIC POWER SEMICONDUCTOR MARKET, BY TYPE, 2021-2030 (USD THOUSAND)
TABLE 226 DENMARK SIC POWER SEMICONDUCTOR MARKET, BY VOLTAGE RANGE, 2021-2030 (USD THOUSAND)
TABLE 227 DENMARK SIC POWER SEMICONDUCTOR MARKET, BY WAFER SIZE, 2021-2030 (USD THOUSAND)
TABLE 228 DENMARK SIC POWER SEMICONDUCTOR MARKET, BY WAFER TYPE, 2021-2030 (USD THOUSAND)
TABLE 229 DENMARK SIC POWER SEMICONDUCTOR MARKET, BY APPLICATION, 2021-2030 (USD THOUSAND)
TABLE 230 DENMARK SIC POWER SEMICONDUCTOR MARKET, BY VERTICAL, 2021-2030 (USD THOUSAND)
TABLE 231 REST OF EUROPE SIC POWER SEMICONDUCTOR MARKET, BY TYPE, 2021-2030 (USD THOUSAND)
TABLE 232 MIDDLE EAST AND AFRICA SIC POWER SEMICONDUCTOR MARKET, BY COUNTRY, 2021-2030 (USD THOUSAND)
TABLE 233 MIDDLE EAST AND AFRICA SIC POWER SEMICONDUCTOR MARKET, BY TYPE, 2021-2030 (USD THOUSAND)
TABLE 234 MIDDLE EAST AND AFRICA SIC POWER SEMICONDUCTOR MARKET, BY VOLTAGE RANGE, 2021-2030 (USD THOUSAND)
TABLE 235 MIDDLE EAST AND AFRICA SIC POWER SEMICONDUCTOR MARKET, BY WAFER SIZE, 2021-2030 (USD THOUSAND)
TABLE 236 MIDDLE EAST AND AFRICA SIC POWER SEMICONDUCTOR MARKET, BY WAFER TYPE, 2021-2030 (USD THOUSAND)
TABLE 237 MIDDLE EAST AND AFRICA SIC POWER SEMICONDUCTOR MARKET, BY APPLICATION, 2021-2030 (USD THOUSAND)
TABLE 238 MIDDLE EAST AND AFRICA SIC POWER SEMICONDUCTOR MARKET, BY VERTICAL, 2021-2030 (USD THOUSAND)
TABLE 239 ISRAEL SIC POWER SEMICONDUCTOR MARKET, BY TYPE, 2021-2030 (USD THOUSAND)
TABLE 240 ISRAEL SIC POWER SEMICONDUCTOR MARKET, BY VOLTAGE RANGE, 2021-2030 (USD THOUSAND)
TABLE 241 ISRAEL SIC POWER SEMICONDUCTOR MARKET, BY WAFER SIZE, 2021-2030 (USD THOUSAND)
TABLE 242 ISRAEL SIC POWER SEMICONDUCTOR MARKET, BY WAFER TYPE, 2021-2030 (USD THOUSAND)
TABLE 243 ISRAEL SIC POWER SEMICONDUCTOR MARKET, BY APPLICATION, 2021-2030 (USD THOUSAND)
TABLE 244 ISRAEL SIC POWER SEMICONDUCTOR MARKET, BY VERTICAL, 2021-2030 (USD THOUSAND)
TABLE 245 U.A.E. SIC POWER SEMICONDUCTOR MARKET, BY TYPE, 2021-2030 (USD THOUSAND)
TABLE 246 U.A.E. SIC POWER SEMICONDUCTOR MARKET, BY VOLTAGE RANGE, 2021-2030 (USD THOUSAND)
TABLE 247 U.A.E. SIC POWER SEMICONDUCTOR MARKET, BY WAFER SIZE, 2021-2030 (USD THOUSAND)
TABLE 248 U.A.E. SIC POWER SEMICONDUCTOR MARKET, BY WAFER TYPE, 2021-2030 (USD THOUSAND)
TABLE 249 U.A.E. SIC POWER SEMICONDUCTOR MARKET, BY APPLICATION, 2021-2030 (USD THOUSAND)
TABLE 250 U.A.E. SIC POWER SEMICONDUCTOR MARKET, BY VERTICAL, 2021-2030 (USD THOUSAND)
TABLE 251 SAUDI ARABIA SIC POWER SEMICONDUCTOR MARKET, BY TYPE, 2021-2030 (USD THOUSAND)
TABLE 252 SAUDI ARABIA SIC POWER SEMICONDUCTOR MARKET, BY VOLTAGE RANGE, 2021-2030 (USD THOUSAND)
TABLE 253 SAUDI ARABIA SIC POWER SEMICONDUCTOR MARKET, BY WAFER SIZE, 2021-2030 (USD THOUSAND)
TABLE 254 SAUDI ARABIA SIC POWER SEMICONDUCTOR MARKET, BY WAFER TYPE, 2021-2030 (USD THOUSAND)
TABLE 255 SAUDI ARABIA SIC POWER SEMICONDUCTOR MARKET, BY APPLICATION, 2021-2030 (USD THOUSAND)
TABLE 256 SAUDI ARABIA SIC POWER SEMICONDUCTOR MARKET, BY VERTICAL, 2021-2030 (USD THOUSAND)
TABLE 257 SOUTH AFRICA SIC POWER SEMICONDUCTOR MARKET, BY TYPE, 2021-2030 (USD THOUSAND)
TABLE 258 SOUTH AFRICA SIC POWER SEMICONDUCTOR MARKET, BY VOLTAGE RANGE, 2021-2030 (USD THOUSAND)
TABLE 259 SOUTH AFRICA SIC POWER SEMICONDUCTOR MARKET, BY WAFER SIZE, 2021-2030 (USD THOUSAND)
TABLE 260 SOUTH AFRICA SIC POWER SEMICONDUCTOR MARKET, BY WAFER TYPE, 2021-2030 (USD THOUSAND)
TABLE 261 SOUTH AFRICA SIC POWER SEMICONDUCTOR MARKET, BY APPLICATION, 2021-2030 (USD THOUSAND)
TABLE 262 SOUTH AFRICA SIC POWER SEMICONDUCTOR MARKET, BY VERTICAL, 2021-2030 (USD THOUSAND)
TABLE 263 EGYPT SIC POWER SEMICONDUCTOR MARKET, BY TYPE, 2021-2030 (USD THOUSAND)
TABLE 264 EGYPT SIC POWER SEMICONDUCTOR MARKET, BY VOLTAGE RANGE, 2021-2030 (USD THOUSAND)
TABLE 265 EGYPT SIC POWER SEMICONDUCTOR MARKET, BY WAFER SIZE, 2021-2030 (USD THOUSAND)
TABLE 266 EGYPT SIC POWER SEMICONDUCTOR MARKET, BY WAFER TYPE, 2021-2030 (USD THOUSAND)
TABLE 267 EGYPT SIC POWER SEMICONDUCTOR MARKET, BY APPLICATION, 2021-2030 (USD THOUSAND)
TABLE 268 EGYPT SIC POWER SEMICONDUCTOR MARKET, BY VERTICAL, 2021-2030 (USD THOUSAND)
TABLE 269 KUWAIT SIC POWER SEMICONDUCTOR MARKET, BY TYPE, 2021-2030 (USD THOUSAND)
TABLE 270 KUWAIT SIC POWER SEMICONDUCTOR MARKET, BY VOLTAGE RANGE, 2021-2030 (USD THOUSAND)
TABLE 271 KUWAIT SIC POWER SEMICONDUCTOR MARKET, BY WAFER SIZE, 2021-2030 (USD THOUSAND)
TABLE 272 KUWAIT SIC POWER SEMICONDUCTOR MARKET, BY WAFER TYPE, 2021-2030 (USD THOUSAND)
TABLE 273 KUWAIT SIC POWER SEMICONDUCTOR MARKET, BY APPLICATION, 2021-2030 (USD THOUSAND)
TABLE 274 KUWAIT SIC POWER SEMICONDUCTOR MARKET, BY VERTICAL, 2021-2030 (USD THOUSAND)
TABLE 275 QATAR SIC POWER SEMICONDUCTOR MARKET, BY TYPE, 2021-2030 (USD THOUSAND)
TABLE 276 QATAR SIC POWER SEMICONDUCTOR MARKET, BY VOLTAGE RANGE, 2021-2030 (USD THOUSAND)
TABLE 277 QATAR SIC POWER SEMICONDUCTOR MARKET, BY WAFER SIZE, 2021-2030 (USD THOUSAND)
TABLE 278 QATAR SIC POWER SEMICONDUCTOR MARKET, BY WAFER TYPE, 2021-2030 (USD THOUSAND)
TABLE 279 QATAR SIC POWER SEMICONDUCTOR MARKET, BY APPLICATION, 2021-2030 (USD THOUSAND)
TABLE 280 QATAR SIC POWER SEMICONDUCTOR MARKET, BY VERTICAL, 2021-2030 (USD THOUSAND)
TABLE 281 REST OF MIDDLE EAST AND AFRICA SIC POWER SEMICONDUCTOR MARKET, BY TYPE, 2021-2030 (USD THOUSAND)
TABLE 282 SOUTH AMERICA SIC POWER SEMICONDUCTOR MARKET, BY COUNTRY, 2021-2030 (USD THOUSAND)
TABLE 283 SOUTH AMERICA SIC POWER SEMICONDUCTOR MARKET, BY TYPE, 2021-2030 (USD THOUSAND)
TABLE 284 SOUTH AMERICA SIC POWER SEMICONDUCTOR MARKET, BY VOLTAGE RANGE, 2021-2030 (USD THOUSAND)
TABLE 285 SOUTH AMERICA SIC POWER SEMICONDUCTOR MARKET, BY WAFER SIZE, 2021-2030 (USD THOUSAND)
TABLE 286 SOUTH AMERICA SIC POWER SEMICONDUCTOR MARKET, BY WAFER TYPE, 2021-2030 (USD THOUSAND)
TABLE 287 SOUTH AMERICA SIC POWER SEMICONDUCTOR MARKET, BY APPLICATION, 2021-2030 (USD THOUSAND)
TABLE 288 SOUTH AMERICA SIC POWER SEMICONDUCTOR MARKET, BY VERTICAL, 2021-2030 (USD THOUSAND)
TABLE 289 BRAZIL SIC POWER SEMICONDUCTOR MARKET, BY TYPE, 2021-2030 (USD THOUSAND)
TABLE 290 BRAZIL SIC POWER SEMICONDUCTOR MARKET, BY VOLTAGE RANGE, 2021-2030 (USD THOUSAND)
TABLE 291 BRAZIL SIC POWER SEMICONDUCTOR MARKET, BY WAFER SIZE, 2021-2030 (USD THOUSAND)
TABLE 292 BRAZIL SIC POWER SEMICONDUCTOR MARKET, BY WAFER TYPE, 2021-2030 (USD THOUSAND)
TABLE 293 BRAZIL SIC POWER SEMICONDUCTOR MARKET, BY APPLICATION, 2021-2030 (USD THOUSAND)
TABLE 294 BRAZIL SIC POWER SEMICONDUCTOR MARKET, BY VERTICAL, 2021-2030 (USD THOUSAND)
TABLE 295 ARGENTINA SIC POWER SEMICONDUCTOR MARKET, BY TYPE, 2021-2030 (USD THOUSAND)
TABLE 296 ARGENTINA SIC POWER SEMICONDUCTOR MARKET, BY VOLTAGE RANGE, 2021-2030 (USD THOUSAND)
TABLE 297 ARGENTINA SIC POWER SEMICONDUCTOR MARKET, BY WAFER SIZE, 2021-2030 (USD THOUSAND)
TABLE 298 ARGENTINA SIC POWER SEMICONDUCTOR MARKET, BY WAFER TYPE, 2021-2030 (USD THOUSAND)
TABLE 299 ARGENTINA SIC POWER SEMICONDUCTOR MARKET, BY APPLICATION, 2021-2030 (USD THOUSAND)
TABLE 300 ARGENTINA SIC POWER SEMICONDUCTOR MARKET, BY VERTICAL, 2021-2030 (USD THOUSAND)
TABLE 301 REST OF SOUTH AMERICA SIC POWER SEMICONDUCTOR MARKET, BY TYPE, 2021-2030 (USD THOUSAND)
List of Figure
FIGURE 1 GLOBAL SIC POWER SEMICONDUCTOR MARKET: SEGMENTATION
FIGURE 2 GLOBAL SIC POWER SEMICONDUCTOR MARKET: DATA TRIANGULATION
FIGURE 3 GLOBAL SIC POWER SEMICONDUCTOR MARKET: DROC ANALYSIS
FIGURE 4 GLOBAL SIC POWER SEMICONDUCTOR MARKET: REGIONAL MARKET ANALYSIS
FIGURE 5 GLOBAL SIC POWER SEMICONDUCTOR MARKET: COMPANY RESEARCH ANALYSIS
FIGURE 6 GLOBAL SIC POWER SEMICONDUCTOR MARKET: INTERVIEW DEMOGRAPHICS
FIGURE 7 GLOBAL SIC POWER SEMICONDUCTOR MARKET: DBMR MARKET POSITION GRID
FIGURE 8 GLOBAL SIC POWER SEMICONDUCTOR MARKET: VENDOR SHARE ANALYSIS
FIGURE 9 GLOBAL SIC POWER SEMICONDUCTOR MARKET: MULTIVARIATE MODELLING
FIGURE 10 GLOBAL SIC POWER SEMICONDUCTOR MARKET: TYPE CURVE
FIGURE 11 GLOBAL SIC POWER SEMICONDUCTOR MARKET:MARKET APPLICATION COVERAGE GRID
FIGURE 12 GLOBAL SIC POWER SEMICONDUCTOR MARKET: SEGMENTATION
FIGURE 13 RISING PENETRATION OF ELECTRONIC VEHICLES IN THE MARKET IS EXPECTED TO DRIVE THE GLOBAL SIC POWER SEMICONDUCTOR MARKET GROWTH IN THE FORECAST PERIOD OF 2023 TO 2030
FIGURE 14 MOSFETS SEGMENT IS EXPECTED TO ACCOUNT FOR THE LARGEST SHARE OF THE GLOBAL SIC POWER SEMICONDUCTOR MARKET IN 2023 & 2030
FIGURE 15 ASIA-PACIFIC IS EXPECTED TO DOMINATE AND EUROPE IS THE FASTEST-GROWING REGION IN THE GLOBAL SIC POWER SEMICONDUCTOR MARKET IN THE FORECAST PERIOD OF 2023 TO 2030
FIGURE 16 EUROPE IS THE FASTEST GROWING MARKET FOR SIC POWER SEMICONDUCTOR MANUFACTURERS IN THE FORECAST PERIOD OF 2023 TO 2030
FIGURE 17 DRIVERS, RESTRAINTS, OPPORTUNITIES, AND CHALLENGES OF THE GLOBAL SIC POWER SEMICONDUCTOR MARKET
FIGURE 18 GLOBAL SIC POWER SEMICONDUCTOR MARKET: BY TYPE, 2022
FIGURE 19 GLOBAL SIC POWER SEMICONDUCTOR MARKET: VOLTAGE RANGE, 2022
FIGURE 20 GLOBAL SIC POWER SEMICONDUCTOR MARKET: BY WAFER SIZE, 2022
FIGURE 21 GLOBAL SIC POWER SEMICONDUCTOR MARKET: BY WAFER TYPE, 2022
FIGURE 22 GLOBAL SIC POWER SEMICONDUCTOR MARKET: BY APPLICATION, 2022
FIGURE 23 GLOBAL SIC POWER SEMICONDUCTOR MARKET: BY VERTICAL, 2022
FIGURE 24 GLOBAL SIC POWER SEMICONDUCTOR MARKET: SNAPSHOT (2022)
FIGURE 25 GLOBAL SIC POWER SEMICONDUCTOR MARKET: BY GEOGRAPHY (2022)
FIGURE 26 GLOBAL SIC POWER SEMICONDUCTOR MARKET: BY GEOGRAPHY (2023 & 2030)
FIGURE 27 GLOBAL SIC POWER SEMICONDUCTOR MARKET: BY GEOGRAPHY (2022 & 2030)
FIGURE 28 GLOBAL SIC POWER SEMICONDUCTOR MARKET: BY TYPE (2023-2030)
FIGURE 29 ASIA-PACIFIC SIC POWER SEMICONDUCTOR MARKET: SNAPSHOT (2022)
FIGURE 30 ASIA-PACIFIC SIC POWER SEMICONDUCTOR MARKET: BY COUNTRY (2022)
FIGURE 31 ASIA-PACIFIC SIC POWER SEMICONDUCTOR MARKET: BY COUNTRY (2023 & 2030)
FIGURE 32 ASIA-PACIFIC SIC POWER SEMICONDUCTOR MARKET: BY COUNTRY (2022 & 2030)
FIGURE 33 ASIA-PACIFIC SIC POWER SEMICONDUCTOR MARKET: BY TYPE (2023-2030)
FIGURE 34 NORTH AMERICA SIC POWER SEMICONDUCTOR MARKET: SNAPSHOT (2022)
FIGURE 35 NORTH AMERICA SIC POWER SEMICONDUCTOR MARKET: BY COUNTRY (2022)
FIGURE 36 NORTH AMERICA SIC POWER SEMICONDUCTOR MARKET: BY COUNTRY (2023 & 2030)
FIGURE 37 NORTH AMERICA SIC POWER SEMICONDUCTOR MARKET: BY COUNTRY (2022 & 2030)
FIGURE 38 NORTH AMERICA SIC POWER SEMICONDUCTOR MARKET: BY TYPE (2023-2030)
FIGURE 39 EUROPE SIC POWER SEMICONDUCTOR MARKET: SNAPSHOT (2022)
FIGURE 40 EUROPE SIC POWER SEMICONDUCTOR MARKET: BY COUNTRY (2022)
FIGURE 41 EUROPE SIC POWER SEMICONDUCTOR MARKET: BY COUNTRY (2023 & 2030)
FIGURE 42 EUROPE SIC POWER SEMICONDUCTOR MARKET: BY COUNTRY (2022 & 2030)
FIGURE 43 EUROPE SIC POWER SEMICONDUCTOR MARKET: BY TYPE (2023-2030)
FIGURE 44 MIDDLE EAST & AFRICA SIC POWER SEMICONDUCTOR MARKET: SNAPSHOT (2022)
FIGURE 45 MIDDLE EAST & AFRICA SIC POWER SEMICONDUCTOR MARKET: BY COUNTRY (2022)
FIGURE 46 MIDDLE EAST & AFRICA SIC POWER SEMICONDUCTOR MARKET: BY COUNTRY (2023 & 2030)
FIGURE 47 MIDDLE EAST & AFRICA SIC POWER SEMICONDUCTOR MARKET: BY COUNTRY (2022 & 2030)
FIGURE 48 MIDDLE EAST & AFRICA SIC POWER SEMICONDUCTOR MARKET: BY TYPE (2023-2030)
FIGURE 49 SOUTH AMERICA SIC POWER SEMICONDUCTOR MARKET: SNAPSHOT (2022)
FIGURE 50 SOUTH AMERICA SIC POWER SEMICONDUCTOR MARKET: BY COUNTRY (2022)
FIGURE 51 SOUTH AMERICA SIC POWER SEMICONDUCTOR MARKET: BY COUNTRY (2023 & 2030)
FIGURE 52 SOUTH AMERICA SIC POWER SEMICONDUCTOR MARKET: BY COUNTRY (2022 & 2030)
FIGURE 53 SOUTH AMERICA SIC POWER SEMICONDUCTOR MARKET: BY TYPE (2023-2030)
FIGURE 54 GLOBAL SIC POWER SEMICONDUCTOR MARKET: COMPANY SHARE 2022 (%)
FIGURE 55 NORTH AMERICA SIC POWER SEMICONDUCTOR MARKET: COMPANY SHARE 2022 (%)
FIGURE 56 EUROPE SIC POWER SEMICONDUCTOR MARKET: COMPANY SHARE 2022 (%)
FIGURE 57 ASIA-PACIFIC SIC POWER SEMICONDUCTOR MARKET: COMPANY SHARE 2022 (%)
Global Sic Power Semiconductor Market, Supply Chain Analysis and Ecosystem Framework
To support market growth and help clients navigate the impact of geopolitical shifts, DBMR has integrated in-depth supply chain analysis into its Global Sic Power Semiconductor Market research reports. This addition empowers clients to respond effectively to global changes affecting their industries. The supply chain analysis section includes detailed insights such as Global Sic Power Semiconductor Market consumption and production by country, price trend analysis, the impact of tariffs and geopolitical developments, and import and export trends by country and HSN code. It also highlights major suppliers with data on production capacity and company profiles, as well as key importers and exporters. In addition to research, DBMR offers specialized supply chain consulting services backed by over a decade of experience, providing solutions like supplier discovery, supplier risk assessment, price trend analysis, impact evaluation of inflation and trade route changes, and comprehensive market trend analysis.
Data collection and base year analysis are done using data collection modules with large sample sizes. The stage includes obtaining market information or related data through various sources and strategies. It includes examining and planning all the data acquired from the past in advance. It likewise envelops the examination of information inconsistencies seen across different information sources. The market data is analysed and estimated using market statistical and coherent models. Also, market share analysis and key trend analysis are the major success factors in the market report. To know more, please request an analyst call or drop down your inquiry.
The key research methodology used by DBMR research team is data triangulation which involves data mining, analysis of the impact of data variables on the market and primary (industry expert) validation. Data models include Vendor Positioning Grid, Market Time Line Analysis, Market Overview and Guide, Company Positioning Grid, Patent Analysis, Pricing Analysis, Company Market Share Analysis, Standards of Measurement, Global versus Regional and Vendor Share Analysis. To know more about the research methodology, drop in an inquiry to speak to our industry experts.
Data Bridge Market Research is a leader in advanced formative research. We take pride in servicing our existing and new customers with data and analysis that match and suits their goal. The report can be customized to include price trend analysis of target brands understanding the market for additional countries (ask for the list of countries), clinical trial results data, literature review, refurbished market and product base analysis. Market analysis of target competitors can be analyzed from technology-based analysis to market portfolio strategies. We can add as many competitors that you require data about in the format and data style you are looking for. Our team of analysts can also provide you data in crude raw excel files pivot tables (Fact book) or can assist you in creating presentations from the data sets available in the report.


