
Global Smart Wheelchair Market
Market Size in USD Million
 USD
207.45 Million
USD
392.59 Million
2025
2033
USD
207.45 Million
USD
392.59 Million
2025
2033
| 2026 - 2033 | |
| USD 207.45 Million | |
| USD 392.59 Million | |
| % | |
|
Smart Wheelchair Market Overview
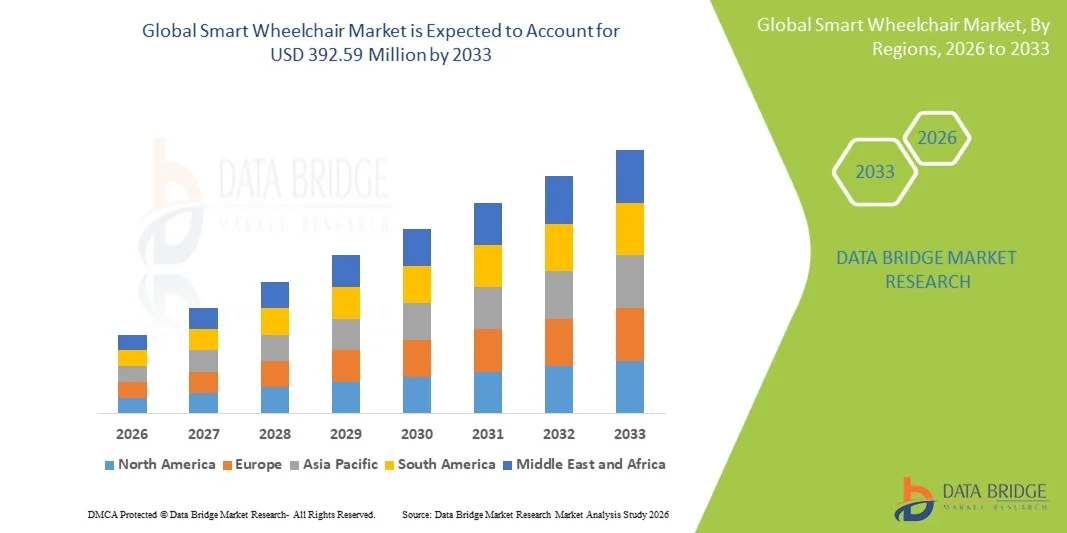
As per Data Bridge Market Research analysis The Smart Wheelchair Market was valued at USD 207.45 million in 2025 and is projected to reach USD 392.59 million by 2033, growing at a CAGR of 8.30% from 2026 to 2033. The market is witnessing steady growth driven by the rising prevalence of mobility impairments, increasing geriatric population worldwide, and growing demand for assistive mobility solutions that enhance independence and quality of life. Continuous improvements in sensor technologies, AI-enabled navigation systems, and battery efficiency are further supporting market expansion.
The increasing burden of neurological disorders, spinal cord injuries, and age-related disabilities is encouraging healthcare providers and rehabilitation centers to adopt advanced smart wheelchairs with features such as obstacle detection, voice control, and autonomous navigation. In addition, supportive government initiatives, reimbursement policies in developed regions, and integration of IoT and robotics in assistive devices are accelerating adoption across hospitals, homecare settings, and long-term care facilities, positioning smart wheelchairs as a key segment in the broader medical mobility solutions market.
Key Market Trends & Insights
- North America dominated the Smart Wheelchair Market with the largest revenue share of 34.12% in 2025, supported by strong healthcare infrastructure, high adoption of advanced assistive technologies, and favorable reimbursement frameworks.
- The Standard Powered Wheelchairs segment led the market with a 44.21% share in 2025, driven by their wide availability, affordability, and strong adoption in hospitals and rehabilitation centers for basic mobility assistance
- Asia-Pacific is expected to be the fastest-growing region at a CAGR of 8.1% from 2026 to 2033, fueled by a rapidly aging population, improving healthcare accessibility, and increasing investments in rehabilitation and assistive mobility technologies.
- Custom-Built Powered Wheelchairs are the fastest-growing type, projected to register a CAGR of 8.7%, reflecting the surge in demand for highly personalized mobility solutions tailored to specific medical conditions.
- The Electric Indoor Chair segment dominated the product category with a 38.67% revenue share in 2025, led by high usage in hospitals, rehabilitation centers, and homecare environments where indoor mobility assistance is the primary requirement
- Neurologically Impaired Patients accounted for 47.03% of the market, preferred by the rising prevalence of conditions such as spinal cord injuries, cerebral palsy, Parkinson’s disease, and multiple sclerosis.
- The Handicap Patients segment is the fastest-growing application category, with a CAGR of 8.6%, driven by rising global disability prevalence, increasing awareness of assistive mobility solutions, and expanding accessibility initiatives.
Market Size & Forecast
- Global Market Value (2025): USD 207.45 Million
- Expected Market Value (2033): USD 392.59 Million
- Forecast CAGR (2026–2033): 8.30%
- Leading Region in 2025: North America
- Fastest Growing Region: Asia Pacific
Report Scope and Smart Wheelchair Market Segmentation
|
Attributes |
Smart Wheelchair Key Market Insights |
|
Segments Covered |
|
|
Countries Covered |
North America · U.S. · Canada · Mexico Europe · Germany · France · U.K. · Netherlands · Switzerland · Belgium · Russia · Italy · Spain · Turkey · Rest of Europe Asia-Pacific · China · Japan · India · South Korea · Singapore · Malaysia · Australia · Thailand · Indonesia · Philippines · Rest of Asia-Pacific Middle East and Africa · Saudi Arabia · U.A.E. · South Africa · Egypt · Israel · Rest of Middle East and Africa South America · Brazil · Argentina · Rest of South America |
|
Key Market Players |
· Permobil (Sweden) · Sunrise Medical (Germany) · Invacare Corporation (U.S.) · Ottobock SE & Co. KGaA (Germany) · Pride Mobility Products Corp. (U.S.) · Quantum Rehab (U.S.) · WHILL Inc. (Japan) · MEYRA GmbH (Germany) · Karman Healthcare (U.S.) · Drive DeVilbiss Healthcare (U.S.) · Hoveround Corporation (U.S.) · Magic Mobility (Australia) · GF Health (U.S.) · Electric Mobility (U.K.) · LEVO AG (Switzerland) · DIETZ Power (Netherlands) · Life & Mobility (Netherlands) · LUCI Mobility (U.S.) · Küschall (Switzerland) · Broda Seating (Canada) |
|
Market Opportunities |
· Expansion of AI-powered autonomous navigation systems in smart wheelchairs · Growing integration of smart wheelchairs with telehealth and remote patient monitoring platforms · Increasing demand from aging populations in emerging economies |
|
Value Added Data Infosets |
In addition to the insights on market scenarios such as market value, growth rate, segmentation, geographical coverage, and major players, the market reports curated by the Data Bridge Market Research also include in-depth expert analysis, patient epidemiology, pipeline analysis, pricing analysis, and regulatory framework. |
Smart Wheelchair Market Trends
Trend: Rising Adoption of AI-Enabled Mobility & Smart Assistance Features
Smart wheelchairs are increasingly integrating AI-based navigation, obstacle detection, and adaptive control systems to enhance user independence and safety in complex indoor and outdoor environments. The incorporation of IoT connectivity and sensor fusion allows real-time mobility tracking, predictive maintenance, and personalized movement assistance tailored to user conditions. Rehabilitation centers and homecare providers are adopting these intelligent systems to improve mobility outcomes, reduce caregiver dependency, and support continuous patient monitoring, while cloud-enabled platforms enhance remote diagnostics and performance analytics. For instance, AI-based wheelchair navigation systems used in smart hospitals enable autonomous indoor movement and real-time route optimization.
Smart Wheelchair Market Dynamics
Key Market Driver: Rising Geriatric Population and Disability Prevalence Globally
The growing elderly population and increasing incidence of mobility-related disabilities such as spinal cord injuries, neurological disorders, and age-related musculoskeletal conditions are significantly driving demand for smart wheelchairs. Healthcare systems and rehabilitation facilities are adopting advanced mobility solutions to enhance patient independence, reduce caregiver burden, and improve long-term care efficiency. Government support programs and reimbursement policies in developed regions further accelerate adoption of intelligent mobility devices across hospitals and homecare settings. For instance, rehabilitation programs in aging societies such as Japan increasingly deploy powered smart wheelchairs for elderly mobility assistance.
Key Restraint/Challenge: High Cost and Limited Affordability of Advanced Smart Wheelchairs
A major restraint in the Smart Wheelchair Market is the high cost associated with advanced models equipped with AI navigation, IoT connectivity, and robotic control systems. The integration of sophisticated sensors, battery systems, and software algorithms significantly increases product pricing, limiting accessibility in price-sensitive and developing regions. In addition, maintenance costs, software upgrades, and limited insurance coverage in several countries further restrict widespread adoption among middle- and low-income users. For instance, advanced autonomous smart wheelchair models remain largely unaffordable for many patients in emerging healthcare markets due to limited reimbursement frameworks.
Key Market Opportunity: Expansion of Connected Healthcare & AI-Driven Assistive Ecosystems
The integration of smart wheelchairs with connected healthcare systems, including telehealth platforms, wearable medical devices, and hospital IoT networks, presents a significant growth opportunity in the market. These integrations enable real-time health monitoring, remote mobility control, and predictive maintenance, improving patient care efficiency and safety. In addition, advancements in AI and cloud computing are enabling the development of scalable, data-driven mobility ecosystems that support personalized rehabilitation and remote assistance services. For instance, AI-enabled smart wheelchairs linked with hospital monitoring systems allow clinicians to track patient movement patterns and adjust therapy plans remotely.
Smart Wheelchair Market Scope
The smart wheelchair market is segmented on the basis of type, product, application, end user, and distribution channel.
- By Type
On the basis of type, the Smart Wheelchair Market is segmented into standard powered wheelchairs, standard plus powered wheelchairs, and custom-built powered wheelchairs. The Standard Powered Wheelchairs segment dominated the market with a 44.21% share in 2025, owing to their wide availability, affordability, and strong adoption in hospitals and rehabilitation centers for basic mobility assistance. These wheelchairs provide essential powered mobility support for patients with moderate disabilities and are widely preferred in institutional care settings. Their relatively lower cost compared to advanced customized solutions makes them highly accessible across developing healthcare systems. Continuous improvements in battery life, motor efficiency, and ergonomic design are further strengthening their adoption. Integration with basic assistive features such as joystick control and safety sensors enhances usability. However, limited personalization restricts their application in highly complex mobility impairment cases.
The Custom-Built Powered Wheelchairs segment is expected to witness the fastest growth from 2026 to 2033 at a CAGR of 8.7%, driven by increasing demand for highly personalized mobility solutions tailored to specific medical conditions. These wheelchairs are designed to accommodate unique physical requirements, offering advanced seating systems, AI-enabled controls, and adaptive support features. Rising prevalence of severe neurological disorders and spinal cord injuries is significantly boosting demand for customized solutions. Rehabilitation specialists and occupational therapists are increasingly recommending personalized mobility systems for long-term patient care. Advancements in 3D modeling, sensor integration, and modular design are enhancing product development. Growing insurance coverage for advanced assistive devices in developed markets is further accelerating adoption.
- By Product
On the basis of product, the market is segmented into electric indoor chair, electric outdoor chair, dual purpose chair, rear wheel drive chair, front wheel drive chair, center wheel drive chair, standing electric wheelchair, and others. The Electric Indoor Chair segment dominated the market with a 38.67% share in 2025, driven by high usage in hospitals, rehabilitation centers, and homecare environments where indoor mobility assistance is the primary requirement. These chairs are optimized for tight spaces, smooth maneuverability, and user-friendly control systems, making them highly suitable for clinical and residential settings. Their compact design and safety-focused features support elderly and disabled users in daily indoor movement. Increasing adoption in assisted living facilities and nursing homes is further strengthening demand. Continuous improvements in joystick precision and battery efficiency are enhancing usability. However, limited outdoor performance restricts their usage scope.
The Standing Electric Wheelchair segment is expected to witness the fastest growth from 2026 to 2033 at a CAGR of 9.1%, driven by rising demand for advanced rehabilitation solutions that support posture correction and health benefits. These wheelchairs enable users to transition from sitting to standing positions, improving circulation, bone density, and psychological well-being. Increasing clinical awareness about long-term health benefits of standing mobility systems is supporting adoption. Technological advancements in motorized lifting mechanisms and stability control are enhancing safety and comfort. Rehabilitation centers are increasingly incorporating standing wheelchairs into therapy programs. Growing focus on active mobility and independence among disabled users is further driving segment growth.
- By Application
On the basis of application, the market is segmented into neurologically impaired patients, handicap patients, and others. The Neurologically Impaired Patients segment dominated the market with a 47.03% share in 2025, driven by the rising prevalence of conditions such as spinal cord injuries, cerebral palsy, Parkinson’s disease, and multiple sclerosis. These patients require advanced mobility support systems capable of adapting to progressive physical limitations. Smart wheelchairs with AI-assisted controls and stability features are widely adopted in neurological rehabilitation programs. Hospitals and specialized care centers increasingly rely on these systems to improve patient independence and therapy outcomes. Continuous advancements in brain-computer interfaces and sensor-based control systems are further enhancing usability. Growing clinical focus on long-term neurological care is strengthening segment dominance.
The Handicap Patients segment is expected to witness the fastest growth from 2026 to 2033 at a CAGR of 8.6%, driven by rising global disability prevalence, increasing awareness of assistive mobility solutions, and expanding accessibility initiatives. Growing urban infrastructure development focused on inclusivity is improving wheelchair usability in public and private spaces. Government support programs, disability benefits, and improved insurance coverage are further accelerating adoption of smart wheelchairs among physically handicapped individuals. Technological advancements in lightweight designs, AI-based navigation, and customizable control systems are enhancing usability and independence. Increasing adoption in homecare and community-based rehabilitation settings is also contributing to strong growth momentum.
- By End User
On the basis of end user, the market is segmented into rehab centers, hospitals, and others. The Hospitals segment dominated the market with the largest revenue share of 51.26% in 2025, driven by high patient inflow requiring mobility assistance in acute care and post-operative recovery. Hospitals are increasingly integrating smart wheelchairs into patient transport systems to improve efficiency and reduce caregiver workload. Advanced models with monitoring and safety features are widely used in inpatient rehabilitation and long-term care units. Government funding and institutional procurement further support adoption in hospital settings. Integration with hospital IoT systems and electronic health records is enhancing patient management. Continuous expansion of healthcare infrastructure globally is reinforcing segment leadership.
The Rehab Centers segment is expected to witness the fastest growth from 2026 to 2033 at a CAGR of 8.9%, driven by rising demand for specialized rehabilitation therapies for neurological and physical impairments. These centers are increasingly adopting smart wheelchairs to support structured mobility training and therapy programs. Advanced simulation and adaptive control features help improve patient recovery outcomes. Growing incidence of disability and post-injury rehabilitation needs is fueling demand. Increasing investment in rehabilitation infrastructure across emerging economies is further accelerating growth. Rising focus on personalized therapy and long-term functional recovery is strengthening segment expansion.
- By Distribution Channel
On the basis of distribution channel, the market is segmented into retail and e-commerce. The Retail segment dominated the market with a 62.14% share in 2025, driven by the preference for physical evaluation, customization, and professional consultation before purchase. Customers and healthcare providers often rely on medical equipment stores and authorized distributors for product trials and after-sales support. Retail channels also provide installation, maintenance, and training services, which are critical for smart wheelchair adoption. Strong presence of certified medical equipment retailers supports trust and compliance. Institutional procurement through retail networks further strengthens this segment. However, limited geographical reach in rural areas restricts expansion.
The E-Commerce segment is expected to witness the fastest growth from 2026 to 2033 at a CAGR of 9.4%, driven by increasing digitalization of healthcare procurement and rising consumer preference for online purchasing. Online platforms offer wider product variety, price comparison, and doorstep delivery, improving accessibility for end users. Growing adoption of telehealth and digital healthcare ecosystems is supporting online sales channels. Manufacturers are increasingly launching direct-to-consumer platforms to reduce distribution costs. Rising smartphone penetration and internet access in emerging markets are further accelerating growth. Enhanced online product demonstration tools and virtual consultations are improving buyer confidence.
Smart Wheelchair Market Regional Analysis
North America dominated the Smart Wheelchair Market with the largest revenue share of 34.12% in 2025, supported by strong healthcare infrastructure, high adoption of advanced assistive technologies, and favorable reimbursement frameworks. The region benefits from a well-established rehabilitation ecosystem, increasing prevalence of age-related disabilities, and strong presence of key medical device manufacturers. Rising integration of AI, IoT, and sensor-based mobility solutions in hospitals and homecare settings is further strengthening adoption. Growing focus on independent living for elderly and disabled populations continues to reinforce North America’s leadership position in the global market.
U.S. Smart Wheelchair Market Insight
The U.S. smart wheelchair market is witnessing strong growth due to rising healthcare expenditure, advanced rehabilitation infrastructure, and increasing adoption of AI-enabled assistive mobility solutions. The country’s well-established healthcare system, along with favorable insurance coverage and Medicare support, is driving demand across hospitals, homecare, and rehabilitation centers. Growing prevalence of age-related disabilities and neurological disorders is further boosting adoption of powered and smart wheelchairs. In addition, increasing integration of IoT-based monitoring, voice control, and autonomous navigation features is accelerating technological advancement across the market.
Europe Smart Wheelchair Market Insight
The Europe smart wheelchair market remains a major contributor to global revenue, driven by strong government support, robust healthcare systems, and high demand for advanced mobility assistance devices. The widespread adoption of rehabilitation technologies in elderly care facilities and hospitals is supporting market expansion across the region. Increasing investments in smart assistive technologies, coupled with strict accessibility regulations and aging population trends, continue to enhance adoption. Furthermore, rising focus on independent living and disability inclusion programs is strengthening Europe’s position in the Smart Wheelchair Market.
U.K. Smart Wheelchair Market Insight
The U.K. smart wheelchair market is experiencing steady growth, supported by rising adoption of assistive mobility technologies in healthcare institutions and homecare settings. Increasing government initiatives for disability support and improved access to advanced mobility devices are contributing to market expansion. Growing demand for AI-enabled and IoT-integrated wheelchairs is further enhancing user independence and safety. In addition, integration of digital healthcare systems and remote monitoring solutions is improving patient care efficiency, positioning the U.K. as an important innovation hub in the smart wheelchair industry.
Germany Smart Wheelchair Market Insight
The Germany smart wheelchair market is expanding steadily due to strong medical device manufacturing capabilities, advanced rehabilitation infrastructure, and growing adoption of intelligent mobility solutions. Hospitals, rehabilitation centers, and elderly care facilities are increasingly deploying smart wheelchairs for patient mobility and long-term care management. Continuous technological advancements in robotics, sensor systems, and AI-based navigation are further supporting market growth. Moreover, strong government focus on healthcare innovation and accessibility standards is driving wider adoption across clinical and residential applications.
Asia-Pacific Smart Wheelchair Market Insight
The Asia-Pacific smart wheelchair market is expected to witness rapid growth, driven by rising urbanization, expanding healthcare infrastructure, and increasing elderly population across countries such as China, India, and Japan. Growing awareness of assistive mobility technologies and improving affordability of smart wheelchairs are supporting regional market expansion. In addition, increasing government initiatives for disability inclusion and rehabilitation services are accelerating adoption. The rising presence of local manufacturers and advancements in cost-effective smart mobility solutions are further strengthening market penetration across the region.
Japan Smart Wheelchair Market Insight
The Japan smart wheelchair market is witnessing consistent growth due to its rapidly aging population, advanced healthcare system, and strong focus on robotics and assistive technologies. Hospitals and rehabilitation centers are increasingly adopting AI-powered wheelchairs to support elderly mobility and independent living. Integration of robotics, sensor fusion, and automated navigation systems is enhancing user safety and functionality. Moreover, Japan’s emphasis on innovation in elderly care and smart healthcare solutions continues to drive steady market expansion.
China Smart Wheelchair Market Insight
The China smart wheelchair market is growing rapidly, driven by rising healthcare modernization, increasing elderly population, and expanding adoption of intelligent assistive devices. Government support for elderly care infrastructure and rehabilitation services is significantly boosting demand. Growing integration of AI, IoT, and smart healthcare platforms is enhancing product functionality and accessibility. In addition, increasing domestic manufacturing capabilities and affordability-focused innovations are positioning China as one of the fastest-growing markets for smart wheelchairs globally.
Smart Wheelchair Market Share
The smart wheelchair industry is primarily led by well-established companies, including:
- Permobil (Sweden)
- Sunrise Medical (Germany)
- Invacare Corporation (U.S.)
- Ottobock SE & Co. KGaA (Germany)
- Pride Mobility Products Corp. (U.S.)
- Quantum Rehab (U.S.)
- WHILL Inc. (Japan)
- MEYRA GmbH (Germany)
- Karman Healthcare (U.S.)
- Drive DeVilbiss Healthcare (U.S.)
- Hoveround Corporation (U.S.)
- Magic Mobility (Australia)
- GF Health (U.S.)
- Electric Mobility (U.K.)
- LEVO AG (Switzerland)
- DIETZ Power (Netherlands)
- Life & Mobility (Netherlands)
- LUCI Mobility (U.S.)
- Küschall (Switzerland)
- Broda Seating (Canada)
Latest Developments in Smart Wheelchair Market
- In March 2024, WHILL Inc., a leading smart mobility device manufacturer, expanded its autonomous personal mobility service deployments in airports and public facilities across Japan and the United States. The service enables users to autonomously navigate large infrastructure spaces using app-based control and self-driving wheelchair systems. This initiative strengthens WHILL’s position in AI-enabled mobility solutions and real-world autonomous wheelchair deployment
- In November 2023, Permobil introduced enhanced digital connectivity features across its advanced powered wheelchair platforms, including improved app-based control and data-driven seating adjustments. These upgrades aim to improve patient outcomes through real-time monitoring, personalized mobility settings, and integration with rehabilitation workflows. The development reflects growing demand for connected and intelligent assistive mobility ecosystems
- In June 2023, LUCI Mobility, a U.S.-based assistive mobility technology company, announced FDA clearance for its LUCI System, an advanced collision-avoidance and smart connectivity platform designed for powered wheelchairs. The system uses sensors and AI-driven safety features to prevent tipping, collisions, and drop-offs, significantly improving user safety and independence. This development marks a major regulatory milestone for intelligent wheelchair technologies in healthcare mobility
- In October 2022, Toyota Mobility Foundation continued its collaboration with WHILL to advance autonomous mobility solutions for inclusive transportation systems in airports and urban environments. The initiative focuses on improving accessibility for elderly and disabled individuals through next-generation self-driving wheelchair platforms integrated with smart infrastructure. This collaboration supports the development of scalable mobility-as-a-service ecosystems
- In July 2021, Sunrise Medical announced product advancements across its Quickie powered wheelchair portfolio, enhancing digital control systems and seating customization technologies. The updates focused on improving comfort, adaptability, and user-specific configuration for individuals with complex mobility needs. These enhancements strengthened Sunrise Medical’s position in the premium rehabilitation and mobility assistive device market
SKU-

- Interactive Data Analysis Dashboard
- Company Analysis Dashboard for high growth potential opportunities
- Research Analyst Access for customization & queries
- Competitor Analysis with Interactive dashboard
- Latest News, Updates & Trend analysis
- Harness the Power of Benchmark Analysis for Comprehensive Competitor Tracking
Data collection and base year analysis are done using data collection modules with large sample sizes. The stage includes obtaining market information or related data through various sources and strategies. It includes examining and planning all the data acquired from the past in advance. It likewise envelops the examination of information inconsistencies seen across different information sources. The market data is analysed and estimated using market statistical and coherent models. Also, market share analysis and key trend analysis are the major success factors in the market report. To know more, please request an analyst call or drop down your inquiry.
The key research methodology used by DBMR research team is data triangulation which involves data mining, analysis of the impact of data variables on the market and primary (industry expert) validation. Data models include Vendor Positioning Grid, Market Time Line Analysis, Market Overview and Guide, Company Positioning Grid, Patent Analysis, Pricing Analysis, Company Market Share Analysis, Standards of Measurement, Global versus Regional and Vendor Share Analysis. To know more about the research methodology, drop in an inquiry to speak to our industry experts.
Data Bridge Market Research is a leader in advanced formative research. We take pride in servicing our existing and new customers with data and analysis that match and suits their goal. The report can be customized to include price trend analysis of target brands understanding the market for additional countries (ask for the list of countries), clinical trial results data, literature review, refurbished market and product base analysis. Market analysis of target competitors can be analyzed from technology-based analysis to market portfolio strategies. We can add as many competitors that you require data about in the format and data style you are looking for. Our team of analysts can also provide you data in crude raw excel files pivot tables (Fact book) or can assist you in creating presentations from the data sets available in the report.


