
Global Soups Market
Market Size in USD Billion
 USD
17.96 Billion
USD
22.66 Billion
2025
2033
USD
17.96 Billion
USD
22.66 Billion
2025
2033
| 2026 - 2033 | |
| USD 17.96 Billion | |
| USD 22.66 Billion | |
| % | |
|
Soups Market Size
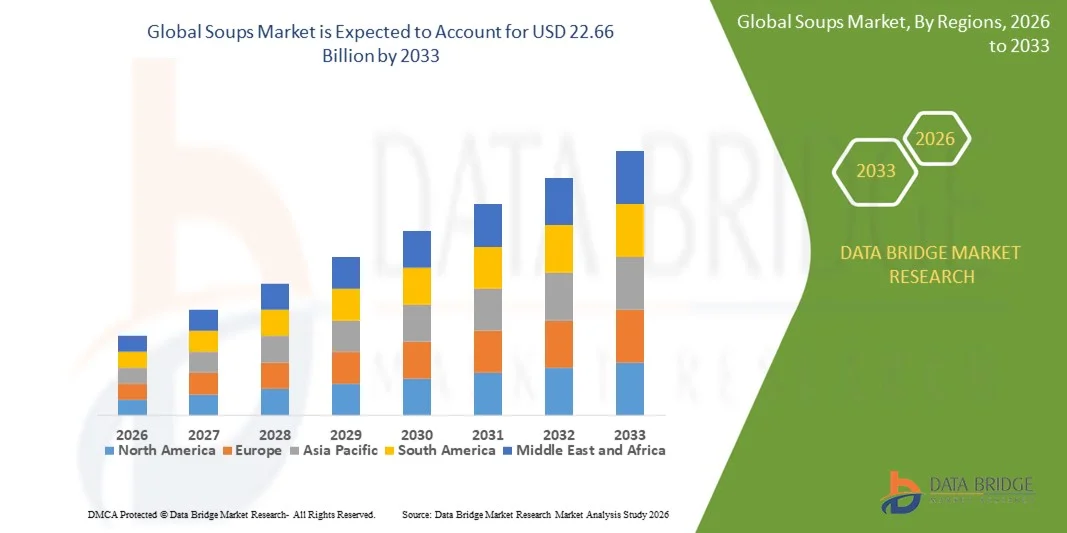
- The global soups market size was valued at USD 17.96 billion in 2025 and is expected to reach USD 22.66 billion by 2033, at a CAGR of 2.95% during the forecast period
- The market growth is largely fueled by the increasing consumer preference for convenient, ready-to-eat, and healthy meal solutions, coupled with rising awareness of nutrition and organic food options
- Furthermore, expanding urbanization, busier lifestyles, and the growth of organized retail and e-commerce channels are encouraging the adoption of packaged and canned soups. These converging factors are accelerating demand across both household and foodservice segments, thereby significantly boosting the industry’s growth
Soups Market Analysis
- Soups are prepared or processed food products available in ready-to-eat, canned, or instant formats, often featuring a variety of flavors and ingredients, including vegetables, meats, legumes, and seasonings. They are consumed across residential, commercial, and on-the-go settings, offering convenience, nutrition, and versatility
- The escalating demand for soups is primarily fueled by changing consumer lifestyles, growing health consciousness, and a rising preference for quick, convenient meal solutions that do not compromise on taste or quality
- Europe dominated the soups market with a share of 36.92% in 2025, due to the increasing preference for ready-to-eat and convenient meal solutions, as well as the growing focus on healthy and organic food options
- Asia-Pacific is expected to be the fastest growing region in the soups market during the forecast period due to rising urbanization, increasing disposable incomes, and growing demand for convenient and ready-to-eat meals in countries such as China, Japan, and India
- Vegetarian segment dominated the market with a market share of 54.09% in 2025, due to rising health consciousness and increasing adoption of plant-based diets. Consumers often prefer vegetarian soups for their perceived nutritional benefits, lower calorie content, and suitability for diverse dietary preferences. The segment also benefits from the growing demand for clean-label and organic ingredients, which are more commonly associated with vegetarian products. In addition, vegetarian soups are widely incorporated into meal plans and wellness routines, boosting consistent consumption
Report Scope and Soups Market Segmentation
|
Attributes |
Soups Key Market Insights |
|
Segments Covered |
|
|
Countries Covered |
North America
Europe
Asia-Pacific
Middle East and Africa
South America
|
|
Key Market Players |
|
|
Market Opportunities |
|
|
Value Added Data Infosets |
In addition to the insights on market scenarios such as market value, growth rate, segmentation, geographical coverage, and major players, the market reports curated by the Data Bridge Market Research also include in-depth expert analysis, pricing analysis, brand share analysis, consumer survey, demography analysis, supply chain analysis, value chain analysis, raw material/consumables overview, vendor selection criteria, PESTLE Analysis, Porter Analysis, and regulatory framework. |
Soups Market Trends
Rising Demand for Ready-to-Eat and Convenient Soups
- A key trend in the soups market is the increasing consumer preference for ready-to-eat and easy-to-prepare soup products, driven by busy lifestyles and the demand for convenient meal solutions. This trend is reshaping product portfolios and encouraging manufacturers to focus on shelf-stable, microwavable, and single-serve packaging formats
- For instance, Campbell Soup Company and Nestlé have expanded their range of ready-to-eat soups, offering options such as condensed soups, microwavable cups, and organic varieties to cater to urban consumers seeking quick meal solutions. These offerings enhance convenience without compromising on flavor or nutritional content
- The rising popularity of plant-based and vegan soups is influencing product development, as consumers increasingly seek alternatives that align with ethical and health-conscious choices. This trend is pushing brands to innovate with legumes, grains, and vegetable-based formulations
- Soups enriched with functional ingredients such as protein, fiber, and vitamins are gaining traction, as consumers aim to incorporate health benefits into their daily meals. This is promoting the launch of fortified soups targeting wellness-focused demographics
- The adoption of global and ethnic flavors in soups is expanding, reflecting consumer curiosity and the desire for diverse culinary experiences. Manufacturers are introducing flavors such as Thai coconut, Mexican tortilla, and Mediterranean lentil to capture this demand
- The market is witnessing growth in premium and gourmet soups, with a focus on natural ingredients, artisanal preparation, and clean-label certifications. This trend is positioning soups as convenient and also a high-quality meal option for discerning consumers
Soups Market Dynamics
Driver
Growing Consumer Preference for Healthy and Organic Meal Options
- The increasing awareness of health and nutrition is driving consumers toward soups that feature organic ingredients, low sodium content, and natural flavors. These preferences are motivating manufacturers to reformulate products to meet clean-label and dietary requirements
- For instance, Amy’s Kitchen has introduced organic and non-GMO soups that appeal to health-conscious consumers seeking convenient yet nutritious meals. Their range includes options such as organic lentil, tomato bisque, and minestrone soups
- The focus on plant-based and protein-enriched soups is accelerating product innovation, as consumers aim to maintain balanced diets while accommodating busy lifestyles. This is stimulating growth in categories that combine taste with health benefits
- Rising interest in functional foods is boosting demand for soups fortified with vitamins, minerals, and antioxidants, catering to immunity and wellness-focused consumers. This trend is encouraging brands to highlight health claims prominently on packaging
- Consumer inclination toward sustainable and eco-friendly packaging also reinforces the demand for organic and healthy soups. This driver continues to influence market strategies as brands align with environmentally conscious and wellness-focused trends
Restraint/Challenge
High Competition and Price Sensitivity in the Packaged Soups Segment
- The packaged soups segment faces challenges due to intense competition among global and regional players, which exerts pressure on pricing and profit margins. Brands must balance quality, innovation, and cost-efficiency to maintain market share
- For instance, Campbell Soup Company, Nestlé, and ConAgra Foods compete aggressively with private-label supermarket brands, leading to significant price sensitivity among consumers. This competition can limit premium pricing opportunities even for value-added soup offerings
- The variety of available soup formats, flavors, and brands increases consumer switching behavior, which complicates brand loyalty and marketing strategies. Companies must continuously innovate to remain relevant in a crowded market
- Supply chain fluctuations, particularly for fresh vegetables, legumes, and specialty ingredients, can impact production costs and product availability. This adds pressure on manufacturers to manage procurement and pricing efficiently
- Consumer expectations for affordable yet high-quality soups continue to constrain profitability, particularly in developing markets where disposable income levels vary. These challenges collectively demand strategic pricing, brand differentiation, and cost optimization initiatives to sustain growth
Soups Market Scope
The market is segmented on the basis of category, product type, packaging, and distribution channel.
- By Category
On the basis of category, the soups market is segmented into vegetarian and non-vegetarian soups. The vegetarian segment dominated the largest market revenue share of 54.09% in 2025, driven by rising health consciousness and increasing adoption of plant-based diets. Consumers often prefer vegetarian soups for their perceived nutritional benefits, lower calorie content, and suitability for diverse dietary preferences. The segment also benefits from the growing demand for clean-label and organic ingredients, which are more commonly associated with vegetarian products. In addition, vegetarian soups are widely incorporated into meal plans and wellness routines, boosting consistent consumption.
The non-vegetarian segment is anticipated to witness the fastest growth rate from 2026 to 2033, fueled by rising demand for protein-rich and flavor-intensive soups. For instance, companies such as Campbell’s have expanded their range of chicken, seafood, and meat-based soups to cater to evolving consumer tastes. Non-vegetarian soups appeal to consumers seeking hearty, nutritious meals and are increasingly popular in ready-to-eat and convenience-focused offerings. In addition, emerging markets are witnessing higher adoption of non-vegetarian soups due to changing lifestyles and urbanization, supporting segment growth.
- By Product Type
On the basis of product type, the soups market is segmented into canned/preserved, chilled, dehydrated, frozen, and UHT soups. The canned/preserved segment dominated the largest market revenue share in 2025, attributed to its long shelf life, easy availability, and convenience for on-the-go consumption. Consumers favor canned soups due to their ready-to-eat nature and consistent flavor profiles, which appeal to busy households and urban professionals. The segment also benefits from established distribution networks and strong brand recognition, which ensures product trust and repeat purchases.
The dehydrated segment is expected to witness the fastest growth rate from 2026 to 2033, driven by rising demand for lightweight, easy-to-store, and instant soup options. For instance, companies such as Knorr have introduced instant soup mixes that allow quick preparation without compromising taste or nutrition. Dehydrated soups are gaining popularity among travelers, students, and health-conscious consumers seeking portion-controlled meals. In addition, the segment aligns with sustainability trends, as dehydrated products reduce packaging and transportation costs, enhancing market adoption.
- By Packaging
On the basis of packaging, the soups market is segmented into canned, pouched, and other packaging formats. The canned packaging segment dominated the largest market revenue share in 2025, driven by durability, long shelf life, and wide consumer familiarity. Consumers perceive canned soups as reliable and convenient for both home consumption and storage, while manufacturers benefit from established filling and distribution technologies. The segment also supports branding opportunities and promotional activities, which help maintain consumer loyalty and repeat purchases.
The pouched packaging segment is expected to witness the fastest growth rate from 2026 to 2033, fueled by innovations in flexible packaging that enhance portability and convenience. For instance, companies such as Heinz have developed resealable pouches for on-the-go consumption, appealing to busy urban consumers and younger demographics. Pouched soups are lightweight, easy to store, and often require minimal preparation, making them highly convenient. In addition, sustainable material use in pouches supports eco-conscious consumer preferences, boosting adoption in multiple markets.
- By Distribution Channel
On the basis of distribution channel, the soups market is segmented into supermarkets/hypermarkets, convenience stores, online channels, and other distribution channels. The supermarkets/hypermarkets segment dominated the largest market revenue share in 2025, attributed to wide product availability, competitive pricing, and high consumer footfall. Consumers prefer purchasing soups from these outlets due to the variety of brands and packaging options, enabling informed purchase decisions. The segment also benefits from promotional campaigns and in-store visibility, which drive higher sales volumes.
The online channels segment is expected to witness the fastest growth rate from 2026 to 2033, driven by increasing e-commerce adoption and convenience-focused shopping trends. For instance, companies such as Amazon Fresh and BigBasket are expanding their soup offerings with home delivery options, catering to tech-savvy consumers. Online platforms provide the advantage of easy product comparison, subscription options, and doorstep delivery, enhancing consumer convenience. In addition, digital marketing and targeted promotions on online platforms are accelerating adoption, particularly among younger and urban demographics.
Soups Market Regional Analysis
- Europe dominated the soups market with the largest revenue share of 36.92% in 2025, driven by the increasing preference for ready-to-eat and convenient meal solutions, as well as the growing focus on healthy and organic food options
- Consumers in the region highly value high-quality ingredients, diverse flavors, and convenient packaging offered by soups, such as ready-to-heat and microwavable options
- This widespread adoption is further supported by high disposable incomes, a growing working population, and the rising trend of on-the-go meals, establishing soups as a preferred choice for both home consumption and food service outlets
France Soups Market Insight
The France soups market captured the largest revenue share in 2025 within Europe, fueled by the increasing demand for gourmet, organic, and low-sodium soup varieties. Consumers are showing a strong preference for premium ready-to-eat soups, particularly those offering nutritional benefits such as high fiber and protein content. The growing trend of home delivery meal kits, coupled with rising health consciousness, further drives the market. In addition, innovations in packaging, such as single-serve and eco-friendly containers, are contributing to increased adoption.
Germany Soups Market Insight
The Germany soups market is anticipated to expand at a considerable CAGR during the forecast period, driven by health-conscious consumer behavior and the demand for organic and low-sodium options. Germany’s well-developed retail infrastructure, along with a focus on sustainability and eco-friendly packaging, encourages the adoption of soups. Innovations in flavors, such as regional and gourmet varieties, are also enhancing consumer interest and sales across residential and commercial consumption.
Asia-Pacific Soups Market Insight
The Asia-Pacific soups market is poised to grow at the fastest CAGR during 2026–2033, driven by rising urbanization, increasing disposable incomes, and growing demand for convenient and ready-to-eat meals in countries such as China, Japan, and India. The expansion of supermarkets, online retail, and quick-service restaurants supports easy availability and variety. Cultural trends promoting healthy diets and traditional flavors are further fueling market growth, with both domestic and international brands capitalizing on evolving consumer preferences.
Japan Soups Market Insight
The Japan soups market is witnessing steady growth due to a strong culture of convenience foods, busy lifestyles, and preference for nutritious meal options. Consumers increasingly favor ready-to-eat soups with authentic flavors, fortified nutrients, and convenient packaging. The integration of soups into meal kits and vending machines further enhances accessibility and adoption across residential and commercial segments.
China Soups Market Insight
The China soups market accounted for the largest market revenue share in Asia-Pacific in 2025, attributed to rapid urbanization, rising middle-class income, and growing demand for convenient, ready-to-eat meals. Traditional and flavored soups, along with health-focused variants such as herbal and vegetable soups, are increasingly popular. Domestic manufacturers and international brands are expanding product lines and distribution networks, catering to both household consumption and foodservice sectors, which drives the market forward.
Soups Market Share
The soups industry is primarily led by well-established companies, including:
- Campbell Soup Company (U.S.)
- Amy’s Kitchen, Inc. (U.S.)
- H.J. Heinz Company Brands LLC (U.S.)
- TSC Foods (U.S.)
- Nestle S.A. (Switzerland)
- B&G Foods, Inc. (U.S.)
- The New Covent Garden Soup Company Limited (U.K.)
- NK Hurst Company, Inc. (U.S.)
- The Kroger Co. (U.S.)
- NISSIN FOODS (Japan)
- Anderson House (U.S.)
- General Mills Inc. (U.S.)
- Health Valley Organic (U.S.)
- Shandong Subo Food Co., Ltd. (China)
- Unilever (U.K.)
- Baxters Food Group (U.K.)
Latest Developments in Global Soups Market
- In April 2025, the creative shop AIN’T launched DOZZ, the first soup in a can produced by FoodVision, available in nine preservative-free varieties such as tomato, broccoli, and gazpacho. This launch targets busy consumers seeking healthy, on-the-go meals, and highlights a shift toward convenient, ready-to-eat solutions that do not compromise nutritional quality. The introduction of preservative-free, premium canned soups is expected to drive innovation in the ready-to-eat segment and encourage other brands to explore similar convenient formats for health-conscious consumers
- In March 2025, Golden Acre Foods introduced two new Elsinore canned seafood soups, including Mediterranean Style Seafood and Fish Chowder, into Waitrose and Ocado. These soups are designed to deliver a premium, restaurant-style experience at home for time-poor consumers. By blending luxury flavors with convenient packaging, this launch strengthens the brand’s presence in the high-end ready-to-eat segment and meets the growing consumer demand for indulgent yet quick meal options
- In March 2025, Hikari Miso launched the “Shichimi Miso Soup” in collaboration with Yawataya Isogoro, available in a 4-serving pack and convenient cup format across Japan. The soup combines smooth Shinshu white miso with premium shichimi seasoning and simple ingredients such as fried tofu, wakame, and green onions, offering authentic Japanese flavors in a ready-to-eat format. This launch enhances the market for convenient, culturally authentic soups, appealing to consumers seeking both traditional taste experiences and quick, easy preparation
- In January 2025, Natural Grocers introduced six new organic soup varieties, including Organic Butternut Squash, Organic Creamy Tomato, Organic Sauerkraut, Organic Sweet Corn, Organic Three Lentil, and Organic Vegan Chili Bean soups. All varieties are certified organic, non-GMO, plant-based, gluten- and dairy-free, and packaged in BPA-free 14-ounce pouches. This move reinforces the growing segment for clean-label, health-focused soups and encourages adoption among vegan, vegetarian, and health-conscious consumers seeking convenient meal options without artificial additives
- In December 2024, Campbell’s expanded its range with “Well Yes!” international soups, featuring globally inspired flavors such as Thai Coconut Chicken and Mexican Black Bean & Vegetable. This launch capitalizes on the rising consumer interest in diverse, internationally inspired flavors, combining convenience with adventurous taste profiles. By strengthening Campbell’s presence in the premium and globally flavored soup market, this initiative drives growth in ready-to-eat soups and positions the brand as a leader in innovative, flavor-forward products
SKU-

- Interactive Data Analysis Dashboard
- Company Analysis Dashboard for high growth potential opportunities
- Research Analyst Access for customization & queries
- Competitor Analysis with Interactive dashboard
- Latest News, Updates & Trend analysis
- Harness the Power of Benchmark Analysis for Comprehensive Competitor Tracking
Global Soups Market, Supply Chain Analysis and Ecosystem Framework
To support market growth and help clients navigate the impact of geopolitical shifts, DBMR has integrated in-depth supply chain analysis into its Global Soups Market research reports. This addition empowers clients to respond effectively to global changes affecting their industries. The supply chain analysis section includes detailed insights such as Global Soups Market consumption and production by country, price trend analysis, the impact of tariffs and geopolitical developments, and import and export trends by country and HSN code. It also highlights major suppliers with data on production capacity and company profiles, as well as key importers and exporters. In addition to research, DBMR offers specialized supply chain consulting services backed by over a decade of experience, providing solutions like supplier discovery, supplier risk assessment, price trend analysis, impact evaluation of inflation and trade route changes, and comprehensive market trend analysis.
Data collection and base year analysis are done using data collection modules with large sample sizes. The stage includes obtaining market information or related data through various sources and strategies. It includes examining and planning all the data acquired from the past in advance. It likewise envelops the examination of information inconsistencies seen across different information sources. The market data is analysed and estimated using market statistical and coherent models. Also, market share analysis and key trend analysis are the major success factors in the market report. To know more, please request an analyst call or drop down your inquiry.
The key research methodology used by DBMR research team is data triangulation which involves data mining, analysis of the impact of data variables on the market and primary (industry expert) validation. Data models include Vendor Positioning Grid, Market Time Line Analysis, Market Overview and Guide, Company Positioning Grid, Patent Analysis, Pricing Analysis, Company Market Share Analysis, Standards of Measurement, Global versus Regional and Vendor Share Analysis. To know more about the research methodology, drop in an inquiry to speak to our industry experts.
Data Bridge Market Research is a leader in advanced formative research. We take pride in servicing our existing and new customers with data and analysis that match and suits their goal. The report can be customized to include price trend analysis of target brands understanding the market for additional countries (ask for the list of countries), clinical trial results data, literature review, refurbished market and product base analysis. Market analysis of target competitors can be analyzed from technology-based analysis to market portfolio strategies. We can add as many competitors that you require data about in the format and data style you are looking for. Our team of analysts can also provide you data in crude raw excel files pivot tables (Fact book) or can assist you in creating presentations from the data sets available in the report.


