
Global Specimen Collection Kit Market
Market Size in USD Billion
 USD
7.56 Billion
USD
15.63 Billion
2022
2030
USD
7.56 Billion
USD
15.63 Billion
2022
2030
| 2023 - 2030 | |
| USD 7.56 Billion | |
| USD 15.63 Billion | |
| % | |
|
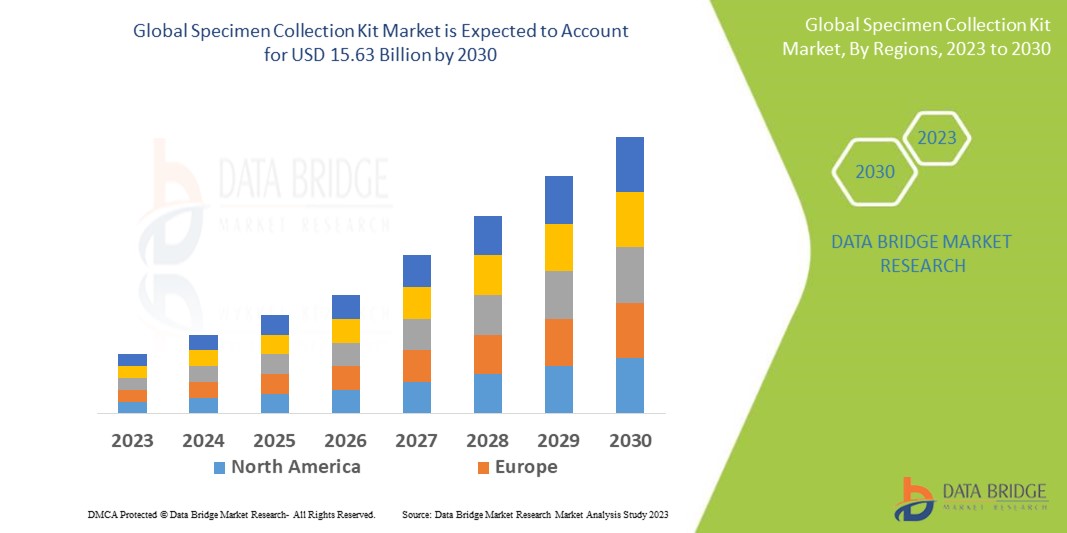
Specimen Collection Kit Market Analysis and Size
The two main factors expected to drive market growth are the rising demand for sample collection kit and the approval by authorities of new and sophisticated detection tests as a result of the global COVID-19 outbreak. Numerous mergers and collaborations have occurred to increase the production of sample test kits, which is one of the most significant and significant factors that will likely accelerate the growth of the sample collection kit market.
Data Bridge Market Research analyses that the specimen collection kit market which was USD 7.56 billion in 2022, is expected to reach USD 15.63 billion by 2030, at a CAGR of 9.5% during the forecast period 2023 to 2030. In addition to the insights on market scenarios such as market value, growth rate, segmentation, geographical coverage, and major players, the market reports curated by the Data Bridge Market Research also include depth expert analysis, patient epidemiology, pipeline analysis, pricing analysis, and regulatory framework.
Specimen Collection Kit Market Scope and Segmentation
|
Report Metric |
Details |
|
Forecast Period |
2023 to 2030 |
|
Base Year |
2022 |
|
Historic Years |
2021 (Customizable to 2015 - 2020) |
|
Quantitative Units |
Revenue in USD Billion, Volumes in Units, Pricing in USD |
|
Segments Covered |
Application (Diagnostics, Research), End-User (Hospitals and Clinics, Diagnostic Centers, Others), Sample Types (Male, Female), Product (Swabs, Viral Transport Media, Blood Collection Kits, Other Consumables), Site of Collection (Hospitals and Clinics, Home Test) |
|
Countries Covered |
U.S., Canada and Mexico in North America, Germany, France, U.K., Netherlands, Switzerland, Belgium, Russia, Italy, Spain, Turkey, Rest of Europe in Europe, China, Japan, India, South Korea, Singapore, Malaysia, Australia, Thailand, Indonesia, Philippines, Rest of Asia-Pacific (APAC) in the Asia-Pacific (APAC), Saudi Arabia, U.A.E, South Africa, Egypt, Israel, Rest of Middle East and Africa (MEA) as a part of Middle East and Africa (MEA), Brazil, Argentina and Rest of South America as part of South America |
|
Market Players Covered |
Thermo Fisher Scientific Inc. (U.S.), Puritan Medical Products (U.S.), BD (U.S.), Laboratory Corporation of America Holdings (U.S.), Lucence Health Inc. (Singapore), Hardy Diagnostics (U.S.), BTNX (Canada), Formlabs (U.S.), Medline Industries, Inc. (U.S.), VIRCELL S.L. (Spain), HiMedia Laboratories (India), Titan Biotech (India), McDermott Will & Emery (U.S.), Miraclean Technology Co.,Ltd (China), Starplex Scientific Inc. (Canada), DiaSorin Molecular LLC (U.S.) |
|
Market Opportunities |
|
Market Definition
Specimen collection refers to obtaining fluids or tissue for laboratory analysis or near-patient testing. Specimen or sample tracks refer to the process by which a patient's sample is labeled and sent for testing before the correct diagnosis result is communicated to them by a physician. A specimen collection kit includes everything needed to secure a sample and send it to a laboratory for diagnostics, environmental sampling, and research. Using a kit eliminates confusion about which swab should be paired with which transport media to ensure sample viability during transport.
Global Specimen Collection Kit Market Dynamics
Drivers
- Increasing number of laboratory tests
Laboratory tests provide vital information about a patient's health. The accuracy of test results is critical in making accurate diagnostic and therapeutic decisions. Accurate test results necessitate proper patient preparation, specimen collection, and specimen handling. The integrity of the specimens determines the accuracy of the test results. Laboratory tests are medical tests that use a variety of laboratory equipment to gather information about a patient's health. These tests necessitate the collection of blood, urine, or other samples from patients in order to diagnose their specific medical condition and determine the best course of treatment. Clinical microbiology, clinical chemistry, haematology, DNA testing, and reproductive biology tests are among the most important areas of clinical laboratory testing.
Furthermore, the most common clinical laboratory tests are a complete blood count (CBC), a comprehensive metabolic panel, a basic metabolic panel, a liver panel, a lipid panel, HbA1c, HGB/HCT, urinalysis, and thyroid-stimulating hormone. As a result of the various laboratory tests available, the global specimen collection kit market is expected to grow.
Opportunities
- Rising usage of lab tests for disease diagnosis and better healthcare facilities
According to the American Clinical Laboratory Association, clinical laboratory tests save time, money, and lives by allowing early disease detection and prevention. Over 7 billion clinical lab tests are performed in the United States each year, providing critical data at a low cost. Increased product launches in this region are also expected to drive market growth. For instance, on August 3rd, 2021, Sedia Biosciences, a company based in the United States, released the Asanté DNA Specimen Collection Kit and its companion product, the Asanté DNA Purification Kit. The Asanté DNA Specimen Collection Kit is a low-cost alternative to current methods for DNA specimen collection, with low DNA retention, minimal interfering substances, and ease of use.
Restraints/Challenges
- Problems associated with specimen collection
Clotting and incorrect volume are two of the most common mistakes made during specimen collection and handling. Extreme temperatures may also cause specimens to be rejected for testing. Clotting compromises a specimen's integrity, rendering it unsuitable for testing. One of the most common problems in specimen collection is the submission of an insufficient volume of specimen for testing. The laboratory issues a QNS (quantity not sufficient) report, and the patient is called for a repeat collection, which is inconvenient for both the patient and the physician.
This specimen collection kit market report provides details of new recent developments, trade regulations, import-export analysis, production analysis, value chain optimization, market share, impact of domestic and localized market players, analyses opportunities in terms of emerging revenue pockets, changes in market regulations, strategic market growth analysis, market size, category market growths, application niches and dominance, product approvals, product launches, geographic expansions, technological innovations in the market. To gain more info on the specimen collection kit market contact Data Bridge Market Research for an Analyst Brief, our team will help you take an informed market decision to achieve market growth.
COVID-19 Impact on the Specimen Collection Kit Market
COVID-19 had positive impact on the specimen collection kit market. At the start of the COVID-19 pandemic, the challenge was to standardize the format of sample data from various tests performed across the country. NIC created the RT-PCR and RATI mobile apps for ICMR and the web portal on Android, iOS, and Windows mobiles to allow phlebotomists (sample collectors) to use the mobile apps web-portal. The RT-PCR App, for instance, is a handheld tool for Medical Staff at Sample Collection Centers across the country. The Sample Collection Facility will send samples from various specimens to ICMR labs for COVID-19 confirmation using the RT-PCR test. The ICMR was notified ahead of time via the app. As a result, the market is expected to expand during COVID-19.
Recent developments
- On September 28th, 2021, Thermo Fisher Scientific launched the Thermo Scientific SpeciMAX Stabilized Saliva Collection Kit to collect saliva safely for research purposes. The SpeciMAX Stabilized Saliva Collection Kit preserves viral nucleic acids in a non-hazardous stabilisation solution that inactivates common respiratory viruses for safer sample collection. A spill-resistant funnel, a screw cap to secure the sample after collection, and a standardized size tube that fits seamlessly into viral RNA extraction automation workflows for high throughput sample processing are all included in the kit.
- On June 1, 2020, EKF Diagnostics received new contracts for producing and supplying a novel, patented sample collection device that allows COVID-19 samples to be rapidly inactivated in the collection tube, avoiding contamination and preserving RNA without the need for refrigeration.
Global Specimen Collection Kit Market Scope
The specimen collection kit market is segmented on the basis of product, site of collection, application, end-user and sample types. The growth amongst these segments will help you analyze meagre growth segments in the industries and provide the users with a valuable market overview and market insights to help them make strategic decisions for identifying core market applications.
Product
- Swabs
- Nasopharyngeal (NP) Swabs
- Oropharyngeal (OP) Swabs
- Nasal Swabs
- Viral Transport Media
- Blood Collection Kits
- Other Consumables
Site of Collection
- Hospitals and Clinics
- Home Test
Application
- Diagnostics
- Research
End-User
- Hospitals and Clinics
- Diagnostic Centers
- Others
Sample Types
- Male
- Urethral swab
- Urine
- Female
- Endocervical swab
- Vaginal swab
- Urine
Specimen Collection Kit Market Regional Analysis/Insights
The specimen collection kit market is analyzed and market size insights and trends are provided by country, product, site of collection, application, end-user and sample types as referenced above.
The countries covered in the specimen collection kit market report are U.S., Canada and Mexico in North America, Germany, France, U.K., Netherlands, Switzerland, Belgium, Russia, Italy, Spain, Turkey, Rest of Europe in Europe, China, Japan, India, South Korea, Singapore, Malaysia, Australia, Thailand, Indonesia, Philippines, Rest of Asia-Pacific (APAC) in the Asia-Pacific (APAC), Saudi Arabia, U.A.E, South Africa, Egypt, Israel, Rest of Middle East and Africa (MEA) as a part of Middle East and Africa (MEA), Brazil, Argentina and Rest of South America as part of South America.
North America dominates the specimen collection kit market due to high uptake of medical sterile swabs and specimen collection kits.
Asia-Pacific is expected to grow at the highest growth rate in the forecast period of 2023 to 2030 owing to the rise in government funding.
The country section of the report also provides individual market impacting factors and changes in regulation in the market domestically that impacts the current and future trends of the market. Data points like down-stream and upstream value chain analysis, technical trends and porter's five forces analysis, case studies are some of the pointers used to forecast the market scenario for individual countries. Also, the presence and availability of global brands and their challenges faced due to large or scarce competition from local and domestic brands, impact of domestic tariffs and trade routes are considered while providing forecast analysis of the country data.
Healthcare Infrastructure Growth Installed base and New Technology Penetration
The specimen collection kit market also provides you with detailed market analysis for every country growth in healthcare expenditure for capital equipment, installed base of different kind of products for specimen collection kit market, impact of technology using life line curves and changes in healthcare regulatory scenarios and their impact on the specimen collection kit market. The data is available for historic period 2011-2021.
Competitive Landscape and Specimen Collection Kit Market Share Analysis
The specimen collection kit market competitive landscape provides details by competitor. Details included are company overview, company financials, revenue generated, market potential, investment in research and development, new market initiatives, global presence, production sites and facilities, production capacities, company strengths and weaknesses, product launch, product width and breadth, application dominance. The above data points provided are only related to the companies' focus related to specimen collection kit market.
Some of the major players operating in the specimen collection kit market are:
- Thermo Fisher Scientific Inc. (U.S.)
- Puritan Medical Products (U.S.)
- BD (U.S.)
- Laboratory Corporation of America Holdings (U.S.)
- Lucence Health Inc. (Singapore)
- Hardy Diagnostics (U.S.)
- BTNX (Canada)
- Formlabs (U.S.)
- Medline Industries, Inc. (U.S.)
- VIRCELL S.L. (Spain)
- HiMedia Laboratories (India)
- Titan Biotech (India)
- McDermott Will & Emery (U.S.)
- Miraclean Technology Co. Ltd (China)
- Starplex Scientific Inc. (Canada)
- DiaSorin Molecular LLC (U.S.)
SKU-

- Interactive Data Analysis Dashboard
- Company Analysis Dashboard for high growth potential opportunities
- Research Analyst Access for customization & queries
- Competitor Analysis with Interactive dashboard
- Latest News, Updates & Trend analysis
- Harness the Power of Benchmark Analysis for Comprehensive Competitor Tracking
Table of Content
1 INTRODUCTION
1.1 OBJECTIVES OF THE STUDY
1.2 MARKET DEFINITION
1.3 OVERVIEW OF GLOBAL SPECIMEN COLLECTION KIT MARKET
1.4 CURRENCY AND PRICING
1.5 LIMITATION
1.6 MARKETS COVERED
2 MARKET SEGMENTATION
2.1 KEY TAKEAWAYS
2.2 ARRIVING AT THE GLOBAL SPECIMEN COLLECTION KIT MARKET SIZE
2.2.1 VENDOR POSITIONING GRID
2.2.2 TECHNOLOGY LIFE LINE CURVE
2.2.3 TRIPOD DATA VALIDATION MODEL
2.2.4 MARKET GUIDE
2.2.5 MULTIVARIATE MODELLING
2.2.6 TOP TO BOTTOM ANALYSIS
2.2.7 CHALLENGE MATRIX
2.2.8 APPLICATION COVERAGE GRID
2.2.9 STANDARDS OF MEASUREMENT
2.2.10 VENDOR SHARE ANALYSIS
2.2.11 EPIDEMIOLOGY
2.2.12 DATA POINTS FROM KEY PRIMARY INTERVIEWS
2.2.13 DATA POINTS FROM KEY SECONDARY DATABASES
2.3 GLOBAL SPECIMEN COLLECTION KIT MARKET : RESEARCH SNAPSHOT
2.4 ASSUMPTIONS
3 MARKET OVERVIEW
3.1 DRIVERS
3.2 RESTRAINTS
3.3 OPPORTUNITIES
3.4 CHALLENGES
4 EXECUTIVE SUMMARY
5 PREMIUM INSIGHTS
6 EPIDEMIOLOGY
7 INDUSTRY INSIGHTS
8 REGULATORY SCENARIO
9 GLOBAL SPECIMEN COLLECTION KIT MARKET , BY PRODUCT TYPE
9.1 OVERVIEW
9.2 BLOOD COLLECTION KITS
9.2.1 BLOOD COLLECTION TUBES
9.2.1.1. SERUM TUBES
9.2.1.1.1. GLASS
9.2.1.1.1.1 MARKET VALUE (USD MILLION)
9.2.1.1.1.2 MARKET VOLUME(UNITS)
9.2.1.1.1.3 AVEARGE SELLING PRICE(ASP)
9.2.1.1.2. PLASTIC
9.2.1.1.2.1 MARKET VALUE (USD MILLION)
9.2.1.1.2.2 MARKET VOLUME(UNITS)
9.2.1.1.2.3 AVEARGE SELLING PRICE(ASP)
9.2.1.1.3. OTHERS
9.2.1.2. PLASMA/WHOLE BLOOD TUBES
9.2.1.2.1. EDTA TUBES
9.2.1.2.1.1 GLASS
9.2.1.2.1.1.1. MARKET VALUE (USD MILLION)
9.2.1.2.1.1.2. MARKET VOLUME(UNITS)
9.2.1.2.1.1.3. AVEARGE SELLING PRICE(ASP)
9.2.1.2.1.2 PLASTIC
9.2.1.2.1.2.1. MARKET VALUE (USD MILLION)
9.2.1.2.1.2.2. MARKET VOLUME(UNITS)
9.2.1.2.1.2.3. AVEARGE SELLING PRICE(ASP)
9.2.1.2.2. LITHIUM HEPARIN TUBES
9.2.1.2.2.1 GLASS
9.2.1.2.2.1.1. MARKET VALUE (USD MILLION)
9.2.1.2.2.1.2. MARKET VOLUME(UNITS)
9.2.1.2.2.1.3. AVEARGE SELLING PRICE(ASP)
9.2.1.2.2.2 PLASTIC
9.2.1.2.2.2.1. MARKET VALUE (USD MILLION)
9.2.1.2.2.2.2. MARKET VOLUME(UNITS)
9.2.1.2.2.2.3. AVEARGE SELLING PRICE(ASP)
9.2.1.2.3. SODIUM HEPARIN TUBES
9.2.1.2.3.1 GLASS
9.2.1.2.3.1.1. MARKET VALUE (USD MILLION)
9.2.1.2.3.1.2. MARKET VOLUME(UNITS)
9.2.1.2.3.1.3. AVEARGE SELLING PRICE(ASP)
9.2.1.2.3.2 PLASTIC
9.2.1.2.3.2.1. MARKET VALUE (USD MILLION)
9.2.1.2.3.2.2. MARKET VOLUME(UNITS)
9.2.1.2.3.2.3. AVEARGE SELLING PRICE(ASP)
9.2.1.2.4. OTHERS
9.2.1.3. GLUCOSE TUBES
9.2.1.3.1. SODIUM FLUORIDE
9.2.1.3.1.1 PLASTIC
9.2.1.3.1.1.1. MARKET VALUE (USD MILLION)
9.2.1.3.1.1.2. MARKET VOLUME(UNITS)
9.2.1.3.1.1.3. AVEARGE SELLING PRICE(ASP)
9.2.1.3.1.2 GLASS
9.2.1.3.1.2.1. MARKET VALUE (USD MILLION)
9.2.1.3.1.2.2. MARKET VOLUME(UNITS)
9.2.1.3.1.2.3. AVEARGE SELLING PRICE(ASP)
9.2.1.3.2. POTASSIUM FLUORIDE
9.2.1.3.2.1 PLASTIC
9.2.1.3.2.1.1. MARKET VALUE (USD MILLION)
9.2.1.3.2.1.2. MARKET VOLUME(UNITS)
9.2.1.3.2.1.3. AVEARGE SELLING PRICE(ASP)
9.2.1.3.2.2 GLASS
9.2.1.3.2.2.1. MARKET VALUE (USD MILLION)
9.2.1.3.2.2.2. MARKET VOLUME(UNITS)
9.2.1.3.2.2.3. AVEARGE SELLING PRICE(ASP)
9.2.1.3.3. FLUORIDE OXALATE
9.2.1.3.3.1 PLASTIC
9.2.1.3.3.1.1. MARKET VALUE (USD MILLION)
9.2.1.3.3.1.2. MARKET VOLUME(UNITS)
9.2.1.3.3.1.3. AVEARGE SELLING PRICE(ASP)
9.2.1.3.3.2 GLASS
9.2.1.3.3.2.1. MARKET VALUE (USD MILLION)
9.2.1.3.3.2.2. MARKET VOLUME(UNITS)
9.2.1.3.3.2.3. AVEARGE SELLING PRICE(ASP)
9.2.1.3.4. OTHERS
9.2.1.4. ERYTHROCYTE SEDIMENTATION RATE (ESR) TUBES
9.2.1.4.1. PLASTIC
9.2.1.4.1.1 MARKET VALUE (USD MILLION)
9.2.1.4.1.2 MARKET VOLUME(UNITS)
9.2.1.4.1.3 AVEARGE SELLING PRICE(ASP)
9.2.1.4.2. GLASS
9.2.1.4.2.1 MARKET VALUE (USD MILLION)
9.2.1.4.2.2 MARKET VOLUME(UNITS)
9.2.1.4.2.3 AVEARGE SELLING PRICE(ASP)
9.2.1.5. SERUM-SEPARATING TUBES
9.2.1.5.1. GLASS
9.2.1.5.1.1 MARKET VALUE (USD MILLION)
9.2.1.5.1.2 MARKET VOLUME(UNITS)
9.2.1.5.1.3 AVEARGE SELLING PRICE(ASP)
9.2.1.5.2. PLASTIC
9.2.1.5.2.1 MARKET VALUE (USD MILLION)
9.2.1.5.2.2 MARKET VOLUME(UNITS)
9.2.1.5.2.3 AVEARGE SELLING PRICE(ASP)
9.2.1.6. RAPID SERUM TUBES
9.2.1.6.1. MARKET VALUE (USD MILLION)
9.2.1.6.2. MARKET VOLUME(UNITS)
9.2.1.6.3. AVEARGE SELLING PRICE(ASP)
9.2.1.7. EDTA TUBES
9.2.1.7.1. MARKET VALUE (USD MILLION)
9.2.1.7.2. MARKET VOLUME(UNITS)
9.2.1.7.3. AVEARGE SELLING PRICE(ASP)
9.2.1.8. OTHERS
9.2.2 BLOOD BAGS
9.2.2.1. SINGLE BLOOD BAG
9.2.2.1.1. 0 ML – 100 ML
9.2.2.1.1.1 MARKET VALUE (USD MILLION)
9.2.2.1.1.2 MARKET VOLUME(UNITS)
9.2.2.1.1.3 AVEARGE SELLING PRICE(ASP)
9.2.2.1.2. 100 ML – 250 ML
9.2.2.1.2.1 MARKET VALUE (USD MILLION)
9.2.2.1.2.2 MARKET VOLUME(UNITS)
9.2.2.1.2.3 AVEARGE SELLING PRICE(ASP)
9.2.2.1.3. 250 ML -450 ML
9.2.2.1.3.1 MARKET VALUE (USD MILLION)
9.2.2.1.3.2 MARKET VOLUME(UNITS)
9.2.2.1.3.3 AVEARGE SELLING PRICE(ASP)
9.2.2.1.4. 450 ML – 700 ML
9.2.2.1.4.1 MARKET VALUE (USD MILLION)
9.2.2.1.4.2 MARKET VOLUME(UNITS)
9.2.2.1.4.3 AVEARGE SELLING PRICE(ASP)
9.2.2.1.5. 700 ML – 1000 ML
9.2.2.1.5.1 MARKET VALUE (USD MILLION)
9.2.2.1.5.2 MARKET VOLUME(UNITS)
9.2.2.1.5.3 AVEARGE SELLING PRICE(ASP)
9.2.2.1.6. OTHERS
9.2.2.2. DOUBLE BLOOD BAG
9.2.2.2.1. 0 ML – 100 ML
9.2.2.2.1.1 MARKET VALUE (USD MILLION)
9.2.2.2.1.2 MARKET VOLUME(UNITS)
9.2.2.2.1.3 AVEARGE SELLING PRICE(ASP)
9.2.2.2.2. 100 ML – 250 ML
9.2.2.2.2.1 MARKET VALUE (USD MILLION)
9.2.2.2.2.2 MARKET VOLUME(UNITS)
9.2.2.2.2.3 AVEARGE SELLING PRICE(ASP)
9.2.2.2.3. 250 ML -450 ML
9.2.2.2.3.1 MARKET VALUE (USD MILLION)
9.2.2.2.3.2 MARKET VOLUME(UNITS)
9.2.2.2.3.3 AVEARGE SELLING PRICE(ASP)
9.2.2.2.4. 450 ML – 700 ML
9.2.2.2.4.1 MARKET VALUE (USD MILLION)
9.2.2.2.4.2 MARKET VOLUME(UNITS)
9.2.2.2.4.3 AVEARGE SELLING PRICE(ASP)
9.2.2.2.5. 700 ML – 1000 ML
9.2.2.2.5.1 MARKET VALUE (USD MILLION)
9.2.2.2.5.2 MARKET VOLUME(UNITS)
9.2.2.2.5.3 AVEARGE SELLING PRICE(ASP)
9.2.2.2.6. OTHERS
9.2.2.3. TRIPLE BLOOD BAG
9.2.2.3.1. 0 ML – 100 ML
9.2.2.3.1.1 MARKET VALUE (USD MILLION)
9.2.2.3.1.2 MARKET VOLUME(UNITS)
9.2.2.3.1.3 AVEARGE SELLING PRICE(ASP)
9.2.2.3.2. 100 ML – 250 ML
9.2.2.3.2.1 MARKET VALUE (USD MILLION)
9.2.2.3.2.2 MARKET VOLUME(UNITS)
9.2.2.3.2.3 AVEARGE SELLING PRICE(ASP)
9.2.2.3.3. 250 ML -450 ML
9.2.2.3.3.1 MARKET VALUE (USD MILLION)
9.2.2.3.3.2 MARKET VOLUME(UNITS)
9.2.2.3.3.3 AVEARGE SELLING PRICE(ASP)
9.2.2.3.4. 450 ML – 700 ML
9.2.2.3.4.1 MARKET VALUE (USD MILLION)
9.2.2.3.4.2 MARKET VOLUME(UNITS)
9.2.2.3.4.3 AVEARGE SELLING PRICE(ASP)
9.2.2.3.5. 700 ML – 1000 ML
9.2.2.3.5.1 MARKET VALUE (USD MILLION)
9.2.2.3.5.2 MARKET VOLUME(UNITS)
9.2.2.3.5.3 AVEARGE SELLING PRICE(ASP)
9.2.2.4. OTHERS
9.2.3 CAPILLARY
9.2.3.1. REMOTE CAPILLARY BLOOD COLLECTION DEVICE
9.2.3.1.1. COLLECTION KITS
9.2.3.1.1.1 10 µL
9.2.3.1.1.1.1. MARKET VALUE (USD MILLION)
9.2.3.1.1.1.2. MARKET VOLUME(UNITS)
9.2.3.1.1.1.3. AVEARGE SELLING PRICE(ASP)
9.2.3.1.1.2 20 µL
9.2.3.1.1.2.1. MARKET VALUE (USD MILLION)
9.2.3.1.1.2.2. MARKET VOLUME(UNITS)
9.2.3.1.1.2.3. AVEARGE SELLING PRICE(ASP)
9.2.3.1.1.3 30 µL
9.2.3.1.1.3.1. MARKET VALUE (USD MILLION)
9.2.3.1.1.3.2. MARKET VOLUME(UNITS)
9.2.3.1.1.3.3. AVEARGE SELLING PRICE(ASP)
9.2.3.1.2. CARTRIDGE
9.2.3.1.2.1 MARKET VALUE (USD MILLION)
9.2.3.1.2.2 MARKET VOLUME(UNITS)
9.2.3.1.2.3 AVEARGE SELLING PRICE(ASP)
9.2.3.1.3. CLAMSHELL
9.2.3.1.3.1 MARKET VALUE (USD MILLION)
9.2.3.1.3.2 MARKET VOLUME(UNITS)
9.2.3.1.3.3 AVEARGE SELLING PRICE(ASP)
9.2.3.1.4. AUTORACK
9.2.3.1.4.1 MARKET VALUE (USD MILLION)
9.2.3.1.4.2 MARKET VOLUME(UNITS)
9.2.3.1.4.3 AVEARGE SELLING PRICE(ASP)
9.2.3.2. RAPID TEST CASSETTE
9.2.3.2.1. MARKET VALUE (USD MILLION)
9.2.3.2.2. MARKET VOLUME(UNITS)
9.2.3.2.3. AVEARGE SELLING PRICE(ASP)
9.2.3.3. WEARABLE CAPILLARY BLOOD COLLECTION DEVICE
9.2.3.3.1. MARKET VALUE (USD MILLION)
9.2.3.3.2. MARKET VOLUME(UNITS)
9.2.3.3.3. AVEARGE SELLING PRICE(ASP)
9.2.3.4. AUTO-INJECTION BASED DEVICES
9.2.3.4.1. PEDIATRIC
9.2.3.4.1.1 MARKET VALUE (USD MILLION)
9.2.3.4.1.2 MARKET VOLUME(UNITS)
9.2.3.4.1.3 AVEARGE SELLING PRICE(ASP)
9.2.3.4.2. ADULT BASED
9.2.3.4.2.1 MARKET VALUE (USD MILLION)
9.2.3.4.2.2 MARKET VOLUME(UNITS)
9.2.3.4.2.3 AVEARGE SELLING PRICE(ASP)
9.2.3.5. CAPILLARY BLOOD COLLECTION DEVICES
9.2.3.5.1. LANCETS
9.2.3.5.1.1 SAFETY LANCETS
9.2.3.5.1.1.1. MARKET VALUE (USD MILLION)
9.2.3.5.1.1.2. MARKET VOLUME(UNITS)
9.2.3.5.1.1.3. AVEARGE SELLING PRICE(ASP)
9.2.3.5.1.2 LASER LANCET
9.2.3.5.1.2.1. MARKET VALUE (USD MILLION)
9.2.3.5.1.2.2. MARKET VOLUME(UNITS)
9.2.3.5.1.2.3. AVEARGE SELLING PRICE(ASP)
9.2.3.5.1.3 HEEL PUNCTURE LANCETS
9.2.3.5.1.3.1. MARKET VALUE (USD MILLION)
9.2.3.5.1.3.2. MARKET VOLUME(UNITS)
9.2.3.5.1.3.3. AVEARGE SELLING PRICE(ASP)
9.2.3.5.1.4 CONTACT-ACTIVATED LANCET
9.2.3.5.1.4.1. MARKET VALUE (USD MILLION)
9.2.3.5.1.4.2. MARKET VOLUME(UNITS)
9.2.3.5.1.4.3. AVEARGE SELLING PRICE(ASP)
9.2.3.5.1.5 HOMECARE LANCETS
9.2.3.5.1.5.1. MARKET VALUE (USD MILLION)
9.2.3.5.1.5.2. MARKET VOLUME(UNITS)
9.2.3.5.1.5.3. AVEARGE SELLING PRICE(ASP)
9.2.3.5.1.6 OTHERS
9.2.3.5.2. MICRO-HEMATOCRIT TUBES
9.2.3.5.2.1 HEPARINIZED
9.2.3.5.2.1.1. MARKET VALUE (USD MILLION)
9.2.3.5.2.1.2. MARKET VOLUME(UNITS)
9.2.3.5.2.1.3. AVEARGE SELLING PRICE(ASP)
9.2.3.5.2.2 NON- HEPARINIZED
9.2.3.5.2.2.1. MARKET VALUE (USD MILLION)
9.2.3.5.2.2.2. MARKET VOLUME(UNITS)
9.2.3.5.2.2.3. AVEARGE SELLING PRICE(ASP)
9.2.3.5.3. WARMING DEVICES
9.2.3.5.3.1 MARKET VALUE (USD MILLION)
9.2.3.5.3.2 MARKET VOLUME(UNITS)
9.2.3.5.3.3 AVEARGE SELLING PRICE(ASP)
9.2.3.6. OTHERS
9.2.4 BLOOD COLLECTION DEVICES
9.2.4.1. MANUAL BLOOD COLLECTION
9.2.4.2. AUTOMATED BLOOD COLLECTION
9.2.5 VIALS
9.2.5.1. MARKET VALUE (USD MILLION)
9.2.5.2. MARKET VOLUME(UNITS)
9.2.5.3. AVEARGE SELLING PRICE(ASP)
9.3 SWABS COLLECTION KITS
9.3.1 BY TYPES
9.3.1.1. NARES
9.3.1.2. OROPHARYNGEAL
9.3.1.3. NASOPHARYNGEAL
9.3.2 BY CONFIGURATION
9.3.2.1. REGULAR SWAB
9.3.2.2. FLOCKED SWAB
9.3.2.3. OTHERS
9.3.3 BY TIP MATERIALS
9.3.3.1. POLYESTER
9.3.3.2. NYLON
9.3.3.3. CALCIUM ALGINATE
9.3.3.4. COTTON
9.3.3.5. RAYON
9.3.3.6. FOAM
9.3.3.7. OTHERS
9.3.4 BY SHAFT
9.3.4.1. PLASTIC SHAFTS
9.3.4.2. WOODEN SHAFTS
9.3.4.3. RESINS
9.3.4.4. ALUMINUM
9.3.4.5. OTHERS
9.4 URINE COLLECTION KITS
9.4.1 BY PRODUCT
9.4.1.1. URINARY SAMPLE SYSTEM
9.4.1.1.1. CONTAINERS
9.4.1.1.1.1 MARKET VALUE (USD MILLION)
9.4.1.1.1.2 MARKET VOLUME(UNITS)
9.4.1.1.1.3 AVEARGE SELLING PRICE(ASP)
9.4.1.1.2. CUPS
9.4.1.1.2.1 MARKET VALUE (USD MILLION)
9.4.1.1.2.2 MARKET VOLUME(UNITS)
9.4.1.1.2.3 AVEARGE SELLING PRICE(ASP)
9.4.1.1.3. URINALYSIS TUBES
9.4.1.1.3.1 MARKET VALUE (USD MILLION)
9.4.1.1.3.2 MARKET VOLUME(UNITS)
9.4.1.1.3.3 AVEARGE SELLING PRICE(ASP)
9.4.1.2. URINARY CATHETER
9.4.1.2.1. INDWELLING CATHETER
9.4.1.2.1.1 FOLEY CATHETER
9.4.1.2.1.1.1. MARKET VALUE (USD MILLION)
9.4.1.2.1.1.2. MARKET VOLUME(UNITS)
9.4.1.2.1.1.3. AVEARGE SELLING PRICE(ASP)
9.4.1.2.1.2 SUPRAPUBIC CATHETER
9.4.1.2.1.2.1. MARKET VALUE (USD MILLION)
9.4.1.2.1.2.2. MARKET VOLUME(UNITS)
9.4.1.2.1.2.3. AVEARGE SELLING PRICE(ASP)
9.4.1.2.2. INTERMITTENT CATHETER
9.4.1.2.2.1 MARKET VALUE (USD MILLION)
9.4.1.2.2.2 MARKET VOLUME(UNITS)
9.4.1.2.2.3 AVEARGE SELLING PRICE(ASP)
9.4.1.2.3. EXTERNAL CATHETER
9.4.1.2.3.1 MARKET VALUE (USD MILLION)
9.4.1.2.3.2 MARKET VOLUME(UNITS)
9.4.1.2.3.3 AVEARGE SELLING PRICE(ASP)
9.4.1.3. URINE BAGS
9.4.1.3.1. URINARY LEG BAGS
9.4.1.3.1.1 MARKET VALUE (USD MILLION)
9.4.1.3.1.2 MARKET VOLUME(UNITS)
9.4.1.3.1.3 AVEARGE SELLING PRICE(ASP)
9.4.1.3.2. URINARY DRAINAGE BAGS
9.4.1.3.2.1 MARKET VALUE (USD MILLION)
9.4.1.3.2.2 MARKET VOLUME(UNITS)
9.4.1.3.2.3 AVEARGE SELLING PRICE(ASP)
9.4.1.3.3. URINARY BELLY BAGS
9.4.1.3.3.1 MARKET VALUE (USD MILLION)
9.4.1.3.3.2 MARKET VOLUME(UNITS)
9.4.1.3.3.3 AVEARGE SELLING PRICE(ASP)
9.4.1.4. ACCESSORIES
9.4.1.4.1. MARKET VALUE (USD MILLION)
9.4.1.4.2. MARKET VOLUME(UNITS)
9.4.1.4.3. AVEARGE SELLING PRICE(ASP)
9.4.2 BY MATERIAL
9.4.2.1. SILICON
9.4.2.1.1. MARKET VALUE (USD MILLION)
9.4.2.1.2. MARKET VOLUME(UNITS)
9.4.2.1.3. AVEARGE SELLING PRICE(ASP)
9.4.2.2. LATEX
9.4.2.2.1. MARKET VALUE (USD MILLION)
9.4.2.2.2. MARKET VOLUME(UNITS)
9.4.2.2.3. AVEARGE SELLING PRICE(ASP)
9.4.2.3. RUBBER
9.4.2.3.1. MARKET VALUE (USD MILLION)
9.4.2.3.2. MARKET VOLUME(UNITS)
9.4.2.3.3. AVEARGE SELLING PRICE(ASP)
9.4.2.4. OTHERS
9.5 FLUID COLLECTION KITS
9.5.1 CEREBROSPINAL FLUID (CSF) TUBES
9.5.1.1. MARKET VALUE (USD MILLION)
9.5.1.2. MARKET VOLUME(UNITS)
9.5.1.3. AVEARGE SELLING PRICE(ASP)
9.5.2 AMNIOTIC FLUID TUBES
9.5.2.1. MARKET VALUE (USD MILLION)
9.5.2.2. MARKET VOLUME(UNITS)
9.5.2.3. AVEARGE SELLING PRICE(ASP)
9.5.3 OTHERS
9.6 SEMEN COLLECTION KITS
9.6.1 NON-SPERMICIDAL POLYURETHANE CONDOM
9.6.1.1. MARKET VALUE (USD MILLION)
9.6.1.2. MARKET VOLUME(UNITS)
9.6.1.3. AVEARGE SELLING PRICE(ASP)
9.6.2 VIALS
9.6.2.1. MARKET VALUE (USD MILLION)
9.6.2.2. MARKET VOLUME(UNITS)
9.6.2.3. AVEARGE SELLING PRICE(ASP)
9.6.3 OTHERS
9.7 STOOL COLLECTION KITS
9.8 VIRAL TRANSPORT MEDIA
9.9 OTHERS
10 GLOBAL SPECIMEN COLLECTION MARKET, BY MODALITY
10.1 OVERVIEW
10.2 MANUAL
10.3 AUTOMATED
11 GLOBAL SPECIMEN COLLECTION KIT MARKET , BY APPLICATION
11.1 OVERVIEW
11.2 DIAGNOSTICS
11.2.1 INFECTIOUS DISEASES
11.2.2 NON-INFECTIOUS DISEASES
11.2.3 OTHERS
11.3 RESEARCH
11.4 OTHER
12 GLOBAL SPECIMEN COLLECTION KIT MARKET, BY AGE
12.1 OVERVIEW
12.2 PEDIATRIC
12.3 ADULTS
12.4 GERIATRICS
13 GLOBAL SPECIMEN COLLECTION KIT MARKET, BY GENDER
13.1 OVERVIEW
13.2 MALE
13.3 FEMALE
14 GLOBAL SPECIMEN COLLECTION KIT MARKET, BY SITE OF COLLECTION
14.1 OVERVIEW
14.2 HOME BASED COLLECTION
14.3 LABORATORIES BASED COLLECTION
15 GLOBAL SPECIMEN COLLECTION KIT MARKET, BY END USER
15.1 OVERVIEW
15.2 HOSPITALS
15.2.1 GOVERNMENT
15.2.1.1. MILITARY HOSPITAL
15.2.1.2. PUBLIC HOSPITAL
15.2.1.2.1. 100 BED HOSPITAL
15.2.1.2.2. 100-200 BED HOSPITAL
15.2.1.2.3. ABOVE BED HOSPITAL
15.2.2 PRIVATE
15.2.2.1. 100 BED HOSPITAL
15.2.2.2. 100-200 BED HOSPITAL
15.2.2.3. ABOVE BED HOSPITAL
15.3 CLINICS
15.4 DIAGNOSTIC LABORATORIES
15.4.1 PATHOLOGY
15.4.1.1. GOVERNMENT
15.4.1.2. PRIVATE
15.4.2 LAB CHAINS
15.4.2.1. GOVERNMENT
15.4.2.2. PRIVATE
15.4.3 REFERRAL LABS
15.4.3.1. GOVERNMENT
15.4.3.2. PRIVATE
15.4.4 OTHERS
15.5 BLOOD BANKS
15.6 RESEARCH INSTITUTIONS & ACADEMIC
15.7 HOME HEALTHCARE
15.8 OTHERS
16 GLOBAL SPECIMEN COLLECTION KIT MARKET , BY DISTRIBUTION CHANNEL
16.1 OVERVIEW
16.2 DIRECT TENDER
16.3 RETAIL SALES
16.4 OTHERS
17 GLOBAL SPECIMEN COLLECTION KIT MARKET , COMPANY LANDSCAPE
17.1 COMPANY SHARE ANALYSIS: GLOBAL
17.2 COMPANY SHARE ANALYSIS: NORTH AMERICA
17.3 COMPANY SHARE ANALYSIS: EUROPE
17.4 COMPANY SHARE ANALYSIS: ASIA-PACIFIC
17.5 MERGERS & ACQUISITIONS
17.6 NEW PRODUCT DEVELOPMENT & APPROVALS
17.7 EXPANSIONS
17.8 REGULATORY CHANGES
17.9 PARTNERSHIP AND OTHER STRATEGIC DEVELOPMENTS
18 GLOBAL SPECIMEN COLLECTION KIT MARKET , BY GEOGRAPHY
GLOBAL SPECIMEN COLLECTION KIT MARKET (ALL SEGMENTATION PROVIDED ABOVE IS REPRESENTED IN THIS CHAPTER BY COUNTRY)
18.1 NORTH AMERICA
18.1.1 U.S.
18.1.2 CANADA
18.1.3 MEXICO
18.2 EUROPE
18.2.1 GERMANY
18.2.2 FRANCE
18.2.3 U.K.
18.2.4 HUNGARY
18.2.5 LITHUANIA
18.2.6 AUSTRIA
18.2.7 IRELAND
18.2.8 NORWAY
18.2.9 POLAND
18.2.10 ITALY
18.2.11 SPAIN
18.2.12 RUSSIA
18.2.13 TURKEY
18.2.14 NETHERLANDS
18.2.15 SWITZERLAND
18.2.16 REST OF EUROPE
18.3 ASIA-PACIFIC
18.3.1 JAPAN
18.3.2 CHINA
18.3.3 SOUTH KOREA
18.3.4 INDIA
18.3.5 SINGAPORE
18.3.6 THAILAND
18.3.7 INDONESIA
18.3.8 MALAYSIA
18.3.9 PHILIPPINES
18.3.10 AUSTRALIA
18.3.11 NEW ZEALAND
18.3.12 VIETNAM
18.3.13 TAIWAN
18.3.14 REST OF ASIA-PACIFIC REST OF ASIA-PACIFIC
18.4 SOUTH AMERICA
18.4.1 BRAZIL
18.4.2 ARGENTINA
18.4.3 REST OF SOUTH AMERICA
18.5 MIDDLE EAST AND AFRICA
18.5.1 SOUTH AFRICA
18.5.2 EGYPT
18.5.3 BAHRAIN
18.5.4 UNITED ARAB EMIRATES
18.5.5 KUWAIT
18.5.6 OMAN
18.5.7 QATAR
18.5.8 SAUDI ARABIA
18.5.9 REST OF MIDDLE EAST AND AFRICA
18.6 KEY PRIMARY INSIGHTS: BY MAJOR COUNTRIES
19 GLOBAL SPECIMEN COLLECTION KIT MARKET , SWOT AND DBMR ANALYSIS
20 GLOBAL SPECIMEN COLLECTION KIT MARKET , COMPANY PROFILE
20.1 ABBOTT
20.1.1 COMPANY OVERVIEW
20.1.2 REVENUE ANALYSIS
20.1.3 GEOGRAPHIC PRESENCE
20.1.4 PRODUCT PORTFOLIO
20.1.5 RECENT DEVELOPMENTS
20.2 BD
20.2.1 COMPANY OVERVIEW
20.2.2 REVENUE ANALYSIS
20.2.3 GEOGRAPHIC PRESENCE
20.2.4 PRODUCT PORTFOLIO
20.2.5 RECENT DEVELOPMENTS
20.3 THERMO FISHER SCIENTIFIC INC.
20.3.1 COMPANY OVERVIEW
20.3.2 REVENUE ANALYSIS
20.3.3 GEOGRAPHIC PRESENCE
20.3.4 PRODUCT PORTFOLIO
20.3.5 RECENT DEVELOPMENTS
20.4 F. HOFFMANN-LA ROCHE LTD
20.4.1 COMPANY OVERVIEW
20.4.2 REVENUE ANALYSIS
20.4.3 GEOGRAPHIC PRESENCE
20.4.4 PRODUCT PORTFOLIO
20.4.5 RECENT DEVELOPMENTS
20.5 B. BRAUN SE
20.5.1 COMPANY OVERVIEW
20.5.2 REVENUE ANALYSIS
20.5.3 GEOGRAPHIC PRESENCE
20.5.4 PRODUCT PORTFOLIO
20.5.5 RECENT DEVELOPMENTS
20.6 QUIDEL CORPORATION
20.6.1 COMPANY OVERVIEW
20.6.2 REVENUE ANALYSIS
20.6.3 GEOGRAPHIC PRESENCE
20.6.4 PRODUCT PORTFOLIO
20.6.5 RECENT DEVELOPMENTS
20.7 SMITHS MEDICAL
20.7.1 COMPANY OVERVIEW
20.7.2 REVENUE ANALYSIS
20.7.3 GEOGRAPHIC PRESENCE
20.7.4 PRODUCT PORTFOLIO
20.7.5 RECENT DEVELOPMENTS
20.8 BIOMÉRIEUX SA
20.8.1 COMPANY OVERVIEW
20.8.2 REVENUE ANALYSIS
20.8.3 GEOGRAPHIC PRESENCE
20.8.4 PRODUCT PORTFOLIO
20.8.5 RECENT DEVELOPMENTS
20.9 CARDINAL HEALTH.
20.9.1 COMPANY OVERVIEW
20.9.2 REVENUE ANALYSIS
20.9.3 GEOGRAPHIC PRESENCE
20.9.4 PRODUCT PORTFOLIO
20.9.5 RECENT DEVELOPMENTS
20.1 BIO-RAD LABORATORIES, INC.
20.10.1 COMPANY OVERVIEW
20.10.2 REVENUE ANALYSIS
20.10.3 GEOGRAPHIC PRESENCE
20.10.4 PRODUCT PORTFOLIO
20.10.5 RECENT DEVELOPMENTS
20.11 TRINITY BIOTECH
20.11.1 COMPANY OVERVIEW
20.11.2 REVENUE ANALYSIS
20.11.3 GEOGRAPHIC PRESENCE
20.11.4 PRODUCT PORTFOLIO
20.11.5 RECENT DEVELOPMENTS
20.12 GERRESHEIMER AG
20.12.1 COMPANY OVERVIEW
20.12.2 REVENUE ANALYSIS
20.12.3 GEOGRAPHIC PRESENCE
20.12.4 PRODUCT PORTFOLIO
20.12.5 RECENT DEVELOPMENTS
20.13 QIAGEN
20.13.1 COMPANY OVERVIEW
20.13.2 REVENUE ANALYSIS
20.13.3 GEOGRAPHIC PRESENCE
20.13.4 PRODUCT PORTFOLIO
20.13.5 RECENT DEVELOPMENTS
20.14 NORGEN BIOTEK CORP.
20.14.1 COMPANY OVERVIEW
20.14.2 REVENUE ANALYSIS
20.14.3 GEOGRAPHIC PRESENCE
20.14.4 PRODUCT PORTFOLIO
20.14.5 RECENT DEVELOPMENTS
20.15 MEDTRONIC
20.15.1 COMPANY OVERVIEW
20.15.2 REVENUE ANALYSIS
20.15.3 GEOGRAPHIC PRESENCE
20.15.4 PRODUCT PORTFOLIO
20.15.5 RECENT DEVELOPMENTS
20.16 GRIFOLS, S.A
20.16.1 COMPANY OVERVIEW
20.16.2 REVENUE ANALYSIS
20.16.3 GEOGRAPHIC PRESENCE
20.16.4 PRODUCT PORTFOLIO
20.16.5 RECENT DEVELOPMENTS
20.17 GOLDWIN MEDICARE
20.17.1 COMPANY OVERVIEW
20.17.2 REVENUE ANALYSIS
20.17.3 GEOGRAPHIC PRESENCE
20.17.4 PRODUCT PORTFOLIO
20.17.5 RECENT DEVELOPMENTS
20.18 EVERLYWELL, INC
20.18.1 COMPANY OVERVIEW
20.18.2 REVENUE ANALYSIS
20.18.3 GEOGRAPHIC PRESENCE
20.18.4 PRODUCT PORTFOLIO
20.18.5 RECENT DEVELOPMENTS
20.19 COPAN DIAGNOSTICS INC
20.19.1 COMPANY OVERVIEW
20.19.2 REVENUE ANALYSIS
20.19.3 GEOGRAPHIC PRESENCE
20.19.4 PRODUCT PORTFOLIO
20.19.5 RECENT DEVELOPMENTS
20.2 QUEST DIAGNOSTICS
20.20.1 COMPANY OVERVIEW
20.20.2 REVENUE ANALYSIS
20.20.3 GEOGRAPHIC PRESENCE
20.20.4 PRODUCT PORTFOLIO
20.20.5 RECENT DEVELOPMENTS
20.21 HOLOGIC, INC.
20.21.1 COMPANY OVERVIEW
20.21.2 REVENUE ANALYSIS
20.21.3 GEOGRAPHIC PRESENCE
20.21.4 PRODUCT PORTFOLIO
20.21.5 RECENT DEVELOPMENTS
20.22 GENEDX, LLC
20.22.1 COMPANY OVERVIEW
20.22.2 REVENUE ANALYSIS
20.22.3 GEOGRAPHIC PRESENCE
20.22.4 PRODUCT PORTFOLIO
20.22.5 RECENT DEVELOPMENTS
20.23 TITAN BIOTECH LIMITED
20.23.1 COMPANY OVERVIEW
20.23.2 REVENUE ANALYSIS
20.23.3 GEOGRAPHIC PRESENCE
20.23.4 PRODUCT PORTFOLIO
20.23.5 RECENT DEVELOPMENTS
20.24 PURITAN MEDICAL PRODUCTS
20.24.1 COMPANY OVERVIEW
20.24.2 REVENUE ANALYSIS
20.24.3 GEOGRAPHIC PRESENCE
20.24.4 PRODUCT PORTFOLIO
20.24.5 RECENT DEVELOPMENTS
20.25 PATH-TEC, LLC
20.25.1 COMPANY OVERVIEW
20.25.2 REVENUE ANALYSIS
20.25.3 GEOGRAPHIC PRESENCE
20.25.4 PRODUCT PORTFOLIO
20.25.5 RECENT DEVELOPMENTS
20.26 LUCENCE HEALTH INC.
20.26.1 COMPANY OVERVIEW
20.26.2 REVENUE ANALYSIS
20.26.3 GEOGRAPHIC PRESENCE
20.26.4 PRODUCT PORTFOLIO
20.26.5 RECENT DEVELOPMENTS
20.27 HARDY DIAGNOSTICS
20.27.1 COMPANY OVERVIEW
20.27.2 REVENUE ANALYSIS
20.27.3 GEOGRAPHIC PRESENCE
20.27.4 PRODUCT PORTFOLIO
20.27.5 RECENT DEVELOPMENTS
20.28 HIMEDIA LABORATORIES
20.28.1 COMPANY OVERVIEW
20.28.2 REVENUE ANALYSIS
20.28.3 GEOGRAPHIC PRESENCE
20.28.4 PRODUCT PORTFOLIO
20.28.5 RECENT DEVELOPMENTS
20.29 MEDLINE INDUSTRIES, LP
20.29.1 COMPANY OVERVIEW
20.29.2 REVENUE ANALYSIS
20.29.3 GEOGRAPHIC PRESENCE
20.29.4 PRODUCT PORTFOLIO
20.29.5 RECENT DEVELOPMENTS
20.3 BTNX INC.
20.30.1 COMPANY OVERVIEW
20.30.2 REVENUE ANALYSIS
20.30.3 GEOGRAPHIC PRESENCE
20.30.4 PRODUCT PORTFOLIO
20.30.5 RECENT DEVELOPMENTS
20.31 DIASORIN MOLECULAR LLC.
20.31.1 COMPANY OVERVIEW
20.31.2 REVENUE ANALYSIS
20.31.3 GEOGRAPHIC PRESENCE
20.31.4 PRODUCT PORTFOLIO
20.31.5 RECENT DEVELOPMENTS
20.32 MEDICAL WIRE & EQUIPMENT
20.32.1 COMPANY OVERVIEW
20.32.2 REVENUE ANALYSIS
20.32.3 GEOGRAPHIC PRESENCE
20.32.4 PRODUCT PORTFOLIO
20.32.5 RECENT DEVELOPMENTS
20.33 MIRACLEAN TECHNOLOGY CO.,LTD.
20.33.1 COMPANY OVERVIEW
20.33.2 REVENUE ANALYSIS
20.33.3 GEOGRAPHIC PRESENCE
20.33.4 PRODUCT PORTFOLIO
20.33.5 RECENT DEVELOPMENTS
NOTE: THE COMPANIES PROFILED IS NOT EXHAUSTIVE LIST AND IS AS PER OUR PREVIOUS CLIENT REQUIREMENT. WE PROFILE MORE THAN 100 COMPANIES IN OUR STUDY AND HENCE THE LIST OF COMPANIES CAN BE MODIFIED OR REPLACED ON REQUEST
21 RELATED REPORTS
22 CONCLUSION
23 QUESTIONNAIRE
24 ABOUT DATA BRIDGE MARKET RESEARCH
Data collection and base year analysis are done using data collection modules with large sample sizes. The stage includes obtaining market information or related data through various sources and strategies. It includes examining and planning all the data acquired from the past in advance. It likewise envelops the examination of information inconsistencies seen across different information sources. The market data is analysed and estimated using market statistical and coherent models. Also, market share analysis and key trend analysis are the major success factors in the market report. To know more, please request an analyst call or drop down your inquiry.
The key research methodology used by DBMR research team is data triangulation which involves data mining, analysis of the impact of data variables on the market and primary (industry expert) validation. Data models include Vendor Positioning Grid, Market Time Line Analysis, Market Overview and Guide, Company Positioning Grid, Patent Analysis, Pricing Analysis, Company Market Share Analysis, Standards of Measurement, Global versus Regional and Vendor Share Analysis. To know more about the research methodology, drop in an inquiry to speak to our industry experts.
Data Bridge Market Research is a leader in advanced formative research. We take pride in servicing our existing and new customers with data and analysis that match and suits their goal. The report can be customized to include price trend analysis of target brands understanding the market for additional countries (ask for the list of countries), clinical trial results data, literature review, refurbished market and product base analysis. Market analysis of target competitors can be analyzed from technology-based analysis to market portfolio strategies. We can add as many competitors that you require data about in the format and data style you are looking for. Our team of analysts can also provide you data in crude raw excel files pivot tables (Fact book) or can assist you in creating presentations from the data sets available in the report.


