
Global Table Top Sweeteners Market
Market Size in USD Billion
 USD
3.30 Billion
USD
6.76 Billion
2025
2033
USD
3.30 Billion
USD
6.76 Billion
2025
2033
| 2026 - 2033 | |
| USD 3.30 Billion | |
| USD 6.76 Billion | |
| % | |
|
Table Top Sweeteners Market Overview
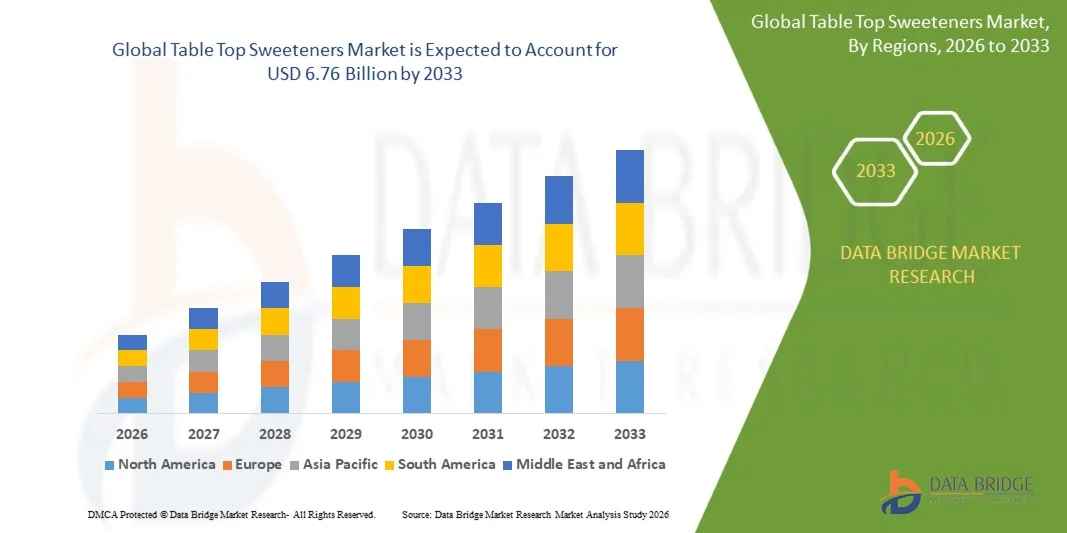
As per Data Bridge Market Research analysis the Table Top Sweeteners Market was valued at USD 3.30 billion in 2025 and is projected to reach USD 6.76 billion by 2033, growing at a CAGR of 9.40% from 2026 to 2033. The market is experiencing significant growth driven by rising consumer awareness regarding sugar reduction, increasing prevalence of diabetes and obesity, and growing demand for low-calorie and zero-calorie alternatives across households, foodservice, and beverage applications.
The increasing shift toward healthier lifestyles, combined with growing demand for functional food products and clean-label sweetening solutions, is encouraging consumers and manufacturers to adopt table top sweeteners made from artificial and natural sources such as stevia, sucralose, aspartame, and monk fruit. Expanding applications in beverages, bakery products, dairy alternatives, and processed foods, along with regulatory initiatives promoting reduced sugar consumption, are further supporting market growth worldwide.
Market Size & Forecast
- Global Market Value (2025): USD 3.30 Billion
- Expected Market Value (2033): USD 6.76 Billion
- Forecast CAGR (2026–2033): 9.40%
- Leading Region in 2025: North America
- Fastest Growing Region: Asia-Pacific
Key Market Trends & Insights
- North America dominated the table top sweeteners market with the largest revenue share in 2025, supported by increasing consumer awareness regarding sugar reduction, high prevalence of diabetes and obesity, and strong demand for low-calorie food alternatives.
- Asia-Pacific table top sweeteners market is expected to witness the fastest growth rate from 2026 to 2033, supported by rising urbanization, increasing disposable incomes, growing diabetes prevalence, and expanding demand for healthier food alternatives.
- The aspartame segment held the largest market revenue share in 2025, driven by its widespread usage in tabletop sweeteners, beverages, confectionery products, and low-calorie food applications. Aspartame remains a preferred sweetener due to its high sweetness intensity, cost-effectiveness, and approval across major global markets for various food and beverage formulations.
- The steviol glycosides & Luo Han Guo (monk fruit) extracts segment is projected to register the fastest growth at a CAGR from 2026 to 2033, driven by increasing consumer preference for natural, plant-based, and clean-label sweetening solutions. Growing demand for sugar reduction, rising health awareness, and increasing adoption of natural sweeteners in beverages, dairy products, and functional foods are accelerating segment expansion.
- The artificial segment accounted for the largest market revenue share in 2025, supported by the extensive availability, affordability, and established usage of sweeteners such as aspartame, sucralose, saccharin, and acesulfame potassium. Artificial sweeteners continue to dominate household and commercial applications due to their high sweetness intensity, longer shelf stability, and widespread adoption in reduced-calorie food and beverage products.
- The natural segment is expected to witness the fastest growth at a CAGR from 2026 to 2033, driven by increasing consumer preference for clean-label ingredients, rising demand for plant-based alternatives, and growing awareness regarding healthier sugar replacement options. Expansion of stevia-based and monk fruit-based products by food ingredient manufacturers is further supporting segment growth.
Report Scope and Table Top Sweeteners Market Segmentation
|
Attributes |
Table Top Sweeteners Key Market Insights |
|
Segments Covered |
|
|
Countries Covered |
North America
Europe
Asia-Pacific
Middle East and Africa
South America
|
|
Key Market Players |
|
|
Market Opportunities |
|
|
Value Added Data Infosets |
In addition to the insights on market scenarios such as market value, growth rate, segmentation, geographical coverage, and major players, the market reports curated by the Data Bridge Market Research also include in-depth expert analysis, pricing analysis, brand share analysis, consumer survey, demography analysis, supply chain analysis, value chain analysis, raw material/consumables overview, vendor selection criteria, PESTLE Analysis, Porter Analysis, and regulatory framework. |
Table Top Sweeteners Market Trends
Trend: Rising Adoption Of Natural And Low-Calorie Sweetening Solutions
Growing consumer awareness regarding sugar reduction, weight management, and healthier dietary choices is accelerating the adoption of table top sweeteners across households, foodservice, and food and beverage applications. Consumers are increasingly shifting toward low-calorie and zero-calorie alternatives as manufacturers focus on developing products that provide sweetness with reduced sugar content. Natural sweeteners such as stevia and other plant-based alternatives are gaining popularity due to increasing demand for clean-label and healthier ingredient solutions.
The growing demand for reduced-sugar beverages, functional foods, and diabetic-friendly products is creating sustained opportunities for table top sweetener manufacturers. For instance, in July 2024, Tate & Lyle launched OPTIMIZER STEVIA 8.10, a new stevia-based sweetener solution designed to help food and beverage manufacturers achieve sugar reduction while maintaining taste quality. The launch supports increasing industry adoption of natural sweeteners and strengthens the role of stevia-based table top sweeteners in healthier food formulations.
The increasing shift toward natural, low-calorie, and sugar-reduction solutions is expected to strengthen long-term demand for table top sweeteners as manufacturers continue developing healthier alternatives for consumers.
Table Top Sweeteners Market Dynamics
Key Market Driver: Increasing Demand For Sugar Reduction And Health-Focused Food Products
The global food and beverage industry is experiencing rising demand for sugar alternatives due to increasing consumer focus on healthier lifestyles and growing concerns related to excessive sugar consumption. Table top sweeteners provide convenient sugar replacement options for beverages, bakery products, dairy products, and household applications while helping consumers reduce calorie intake.
Food ingredient companies are continuously investing in innovative sweetening technologies to support sugar reduction initiatives. For instance, in April 2024, Ingredion launched PURECIRCLE Clean Taste Solubility Solution (CTSS), a stevia-based sweetener innovation designed to improve taste performance and solubility in reduced-sugar food and beverage applications. The development supports manufacturers in creating clean-label products while addressing consumer demand for natural sweetening solutions.
As demand for healthier food products and reduced-sugar formulations continues to increase, table top sweetener manufacturers are expected to benefit from expanding applications across beverages, processed foods, and household consumption.
Key Restraint/Challenge: Regulatory Uncertainty And Consumer Concerns Regarding Artificial Sweeteners
Table top sweetener manufacturers face challenges due to changing consumer perceptions, regulatory discussions, and increasing preference for natural alternatives over synthetic sweeteners. Although many artificial sweeteners remain approved for use globally, concerns regarding product safety, labeling transparency, and consumer acceptance continue to influence purchasing decisions.
For instance, in July 2023, the International Agency for Research on Cancer (IARC) and the Joint FAO/WHO Expert Committee on Food Additives (JECFA) released assessments regarding aspartame, with IARC classifying it as “possibly carcinogenic to humans” while JECFA reaffirmed that the existing acceptable daily intake level remains appropriate. The announcement increased public discussion around artificial sweeteners and encouraged greater industry focus on natural alternatives and transparent product communication.
Despite regulatory approvals for many sweeteners, manufacturers are increasingly investing in natural sweetener development and improved consumer education to overcome perception challenges and maintain market growth.
Key Market Opportunity: Expansion Of Plant-Based Sweeteners And Clean-Label Sugar Alternatives
The increasing preference for plant-based, natural, and clean-label ingredients is creating significant opportunities for table top sweetener manufacturers. Food and beverage companies are expanding their portfolios with stevia, monk fruit, and other natural sweetening solutions to meet growing consumer demand for healthier alternatives to traditional sugar.
For instance, in October 2024, Tate & Lyle partnered with Manus to introduce a large-scale commercially available stevia Reb M ingredient sourced and manufactured through an Americas-based supply chain. The partnership aims to expand access to high-quality natural sweeteners and support food and beverage manufacturers in developing reduced-sugar products with improved taste performance.
As food manufacturers continue accelerating sugar reduction strategies and consumers increasingly prefer natural ingredients, expansion of plant-based sweeteners and clean-label formulations is expected to create substantial long-term growth opportunities for the Table Top Sweeteners Market.
Table Top Sweeteners Market Scope
The market is segmented on the basis of type, product, and application.
- By Type
On the basis of type, the table top sweeteners market is segmented into saccharin, aspartame, acesulfame potassium (ACE-K), sucralose, neotame, advantame, and steviol glycosides & Luo Han Guo (monk fruit) extracts. The aspartame segment held the largest market revenue share in 2025, driven by its widespread usage in tabletop sweeteners, beverages, confectionery products, and low-calorie food applications. Aspartame remains a preferred sweetener due to its high sweetness intensity, cost-effectiveness, and approval across major global markets for various food and beverage formulations.
The steviol glycosides & Luo Han Guo (monk fruit) extracts segment is projected to register the fastest growth at a CAGR from 2026 to 2033, driven by increasing consumer preference for natural, plant-based, and clean-label sweetening solutions. Growing demand for sugar reduction, rising health awareness, and increasing adoption of natural sweeteners in beverages, dairy products, and functional foods are accelerating segment expansion.
- By Product
On the basis of product, the table top sweeteners market is segmented into natural and artificial. The artificial segment accounted for the largest market revenue share in 2025, supported by the extensive availability, affordability, and established usage of sweeteners such as aspartame, sucralose, saccharin, and acesulfame potassium. Artificial sweeteners continue to dominate household and commercial applications due to their high sweetness intensity, longer shelf stability, and widespread adoption in reduced-calorie food and beverage products.
The natural segment is expected to witness the fastest growth at a CAGR from 2026 to 2033, driven by increasing consumer preference for clean-label ingredients, rising demand for plant-based alternatives, and growing awareness regarding healthier sugar replacement options. Expansion of stevia-based and monk fruit-based products by food ingredient manufacturers is further supporting segment growth.
- By Application
On the basis of application, the table top sweeteners market is segmented into online retail and offline retail. The offline retail segment held the largest market revenue share in 2025, driven by strong consumer preference for purchasing sweetener products through supermarkets, hypermarkets, convenience stores, and pharmacies. Easy product accessibility, immediate availability, and established retail distribution networks continue to support the dominance of offline channels.
The online retail segment is projected to register the fastest growth at a CAGR from 2026 to 2033, driven by increasing e-commerce penetration, growing digital purchasing habits, and rising availability of specialized health-focused sweetener products through online platforms. Consumers are increasingly using online channels to access a wider range of natural, organic, and low-calorie sweetener options, supporting rapid segment expansion.
Table Top Sweeteners Market Regional Analysis
North America Table Top Sweeteners Market Insight
North America dominated the table top sweeteners market with the largest revenue share in 2025, supported by increasing consumer awareness regarding sugar reduction, high prevalence of diabetes and obesity, and strong demand for low-calorie food alternatives. Consumers in the region are increasingly adopting artificial and natural sweeteners for household beverages, coffee, bakery products, and health-focused diets. The presence of leading food ingredient manufacturers, advanced retail infrastructure, and rising preference for clean-label sweetening solutions further strengthens market growth across residential and commercial applications.
U.S. Table Top Sweeteners Market Insight
The U.S. table top sweeteners market captured the largest revenue share in 2025 within North America, driven by growing demand for reduced-sugar products, expanding diabetic-friendly food consumption, and increasing adoption of natural sweeteners such as stevia and monk fruit. Consumers are increasingly seeking convenient sugar alternatives for beverages and home cooking, while food and beverage manufacturers continue reformulating products to meet changing health preferences. The strong presence of major sweetener producers and well-established online and offline retail channels further supports market expansion.
Europe Table Top Sweeteners Market Insight
The Europe table top sweeteners market is expected to witness the fastest growth rate from 2026 to 2033, primarily driven by rising health consciousness, government initiatives promoting sugar reduction, and increasing demand for natural and clean-label ingredients. European consumers are increasingly shifting toward low-calorie and plant-based sweetening solutions due to growing concerns regarding obesity and lifestyle-related diseases. The expansion of functional foods, reduced-sugar beverages, and healthier bakery products is further accelerating adoption across residential and foodservice applications.
U.K. Table Top Sweeteners Market Insight
The U.K. table top sweeteners market is expected to witness significant growth from 2026 to 2033, driven by increasing consumer focus on healthier diets, rising demand for sugar-free products, and growing awareness of diabetes management. The country’s strong retail and e-commerce infrastructure is supporting wider availability of artificial and natural sweetener products. In addition, increasing adoption of stevia-based and low-calorie alternatives by food and beverage manufacturers is expected to stimulate market growth.
Germany Table Top Sweeteners Market Insight
The Germany table top sweeteners market is expected to witness steady growth from 2026 to 2033, fueled by increasing demand for healthier food options, strong food processing capabilities, and growing preference for clean-label ingredients. German consumers are increasingly adopting natural sweeteners due to rising awareness of nutrition and sugar consumption impacts. The country’s advanced food manufacturing sector and focus on product innovation are encouraging the development of reduced-sugar beverages, dairy products, and functional foods using alternative sweeteners.
Asia-Pacific Table Top Sweeteners Market Insight
The Asia-Pacific table top sweeteners market is expected to witness the fastest growth rate from 2026 to 2033, supported by rising urbanization, increasing disposable incomes, growing diabetes prevalence, and expanding demand for healthier food alternatives. Countries such as China, India, Japan, and South Korea are experiencing increasing adoption of low-calorie sweeteners due to changing dietary preferences and growing awareness of sugar reduction. The expansion of food and beverage manufacturing, increasing e-commerce penetration, and rising availability of affordable sweetener products are further driving regional market growth.
Japan Table Top Sweeteners Market Insight
The Japan table top sweeteners market is expected to witness strong growth from 2026 to 2033 due to increasing demand for low-calorie food products, aging population concerns, and rising preference for healthier dietary solutions. Japanese consumers show strong interest in functional foods and beverages, encouraging adoption of natural sweeteners such as stevia and monk fruit extracts. The integration of alternative sweeteners into beverages, confectionery, and health-focused products is supporting market expansion across residential and commercial applications.
China Table Top Sweeteners Market Insight
The China table top sweeteners market accounted for the largest market revenue share in Asia-Pacific in 2025, attributed to rapid urbanization, increasing health awareness, and growing demand for reduced-sugar food and beverage products. The country’s expanding middle-class population, rising prevalence of lifestyle-related diseases, and strong food processing industry are driving adoption of artificial and natural sweeteners. In addition, increasing domestic production of stevia-based sweeteners and the expansion of online retail platforms are improving accessibility and supporting long-term market growth.
Table Top Sweeteners Market Share
The Table Top Sweeteners industry is primarily led by well-established companies, including:
- DuPont de Nemours, Inc. (U.S.)
- Archer Daniels Midland Company (ADM) (U.S.)
- Tate & Lyle PLC (U.K.)
- Ingredion Incorporated (U.S.)
- Cargill, Incorporated (U.S.)
- Roquette Frères (France)
- PureCircle by Ingredion (U.S.)
- MacAndrews & Forbes Incorporated (U.S.)
- JK Sucralose Inc. (China)
- Ajinomoto Co., Inc. (Japan)
- The Hain Celestial Group, Inc. (U.S.)
- GLG Life Tech Corporation (Canada)
- S&W Seed Company (U.S.)
- Steviva Ingredients (U.S.)
- Pyure Brands LLC (U.S.)
Latest Developments in Table Top Sweeteners Market
- In July 2024, Tate & Lyle PLC launched OPTIMIZER STEVIA 8.10, a new stevia-based sweetener solution designed to help food and beverage manufacturers achieve sugar reduction while maintaining taste quality. The innovation improves the performance and cost efficiency of stevia formulations, supporting increasing demand for natural and low-calorie table top sweeteners. This development strengthens Tate & Lyle’s position in the growing clean-label sweetener market.
- In October 2024, Tate & Lyle PLC expanded its partnership with Manus to strengthen the supply and availability of Reb M stevia sweeteners through an Americas-based supply chain. The collaboration aims to improve access to high-quality natural sweeteners and support manufacturers developing reduced-sugar products. This initiative is expected to enhance supply reliability and create new growth opportunities for natural table top sweetener applications.
- In July 2023, The World Health Organization (WHO) and Joint FAO/WHO Expert Committee on Food Additives (JECFA) released updated assessments regarding aspartame safety. While JECFA confirmed the existing acceptable daily intake level, the review increased industry focus on transparent labeling, consumer awareness, and development of alternative sweetening solutions. This regulatory discussion is influencing innovation strategies across the table top sweeteners market.
SKU-

- Interactive Data Analysis Dashboard
- Company Analysis Dashboard for high growth potential opportunities
- Research Analyst Access for customization & queries
- Competitor Analysis with Interactive dashboard
- Latest News, Updates & Trend analysis
- Harness the Power of Benchmark Analysis for Comprehensive Competitor Tracking
Global Table Top Sweeteners Market, Supply Chain Analysis and Ecosystem Framework
To support market growth and help clients navigate the impact of geopolitical shifts, DBMR has integrated in-depth supply chain analysis into its Global Table Top Sweeteners Market research reports. This addition empowers clients to respond effectively to global changes affecting their industries. The supply chain analysis section includes detailed insights such as Global Table Top Sweeteners Market consumption and production by country, price trend analysis, the impact of tariffs and geopolitical developments, and import and export trends by country and HSN code. It also highlights major suppliers with data on production capacity and company profiles, as well as key importers and exporters. In addition to research, DBMR offers specialized supply chain consulting services backed by over a decade of experience, providing solutions like supplier discovery, supplier risk assessment, price trend analysis, impact evaluation of inflation and trade route changes, and comprehensive market trend analysis.
Data collection and base year analysis are done using data collection modules with large sample sizes. The stage includes obtaining market information or related data through various sources and strategies. It includes examining and planning all the data acquired from the past in advance. It likewise envelops the examination of information inconsistencies seen across different information sources. The market data is analysed and estimated using market statistical and coherent models. Also, market share analysis and key trend analysis are the major success factors in the market report. To know more, please request an analyst call or drop down your inquiry.
The key research methodology used by DBMR research team is data triangulation which involves data mining, analysis of the impact of data variables on the market and primary (industry expert) validation. Data models include Vendor Positioning Grid, Market Time Line Analysis, Market Overview and Guide, Company Positioning Grid, Patent Analysis, Pricing Analysis, Company Market Share Analysis, Standards of Measurement, Global versus Regional and Vendor Share Analysis. To know more about the research methodology, drop in an inquiry to speak to our industry experts.
Data Bridge Market Research is a leader in advanced formative research. We take pride in servicing our existing and new customers with data and analysis that match and suits their goal. The report can be customized to include price trend analysis of target brands understanding the market for additional countries (ask for the list of countries), clinical trial results data, literature review, refurbished market and product base analysis. Market analysis of target competitors can be analyzed from technology-based analysis to market portfolio strategies. We can add as many competitors that you require data about in the format and data style you are looking for. Our team of analysts can also provide you data in crude raw excel files pivot tables (Fact book) or can assist you in creating presentations from the data sets available in the report.


