
Global Trash Can Liner Market
Market Size in USD Billion
 USD
7.50 Billion
USD
10.35 Billion
2025
2033
USD
7.50 Billion
USD
10.35 Billion
2025
2033
| 2026 - 2033 | |
| USD 7.50 Billion | |
| USD 10.35 Billion | |
| % | |
|
Trash Can Liner Market Overview
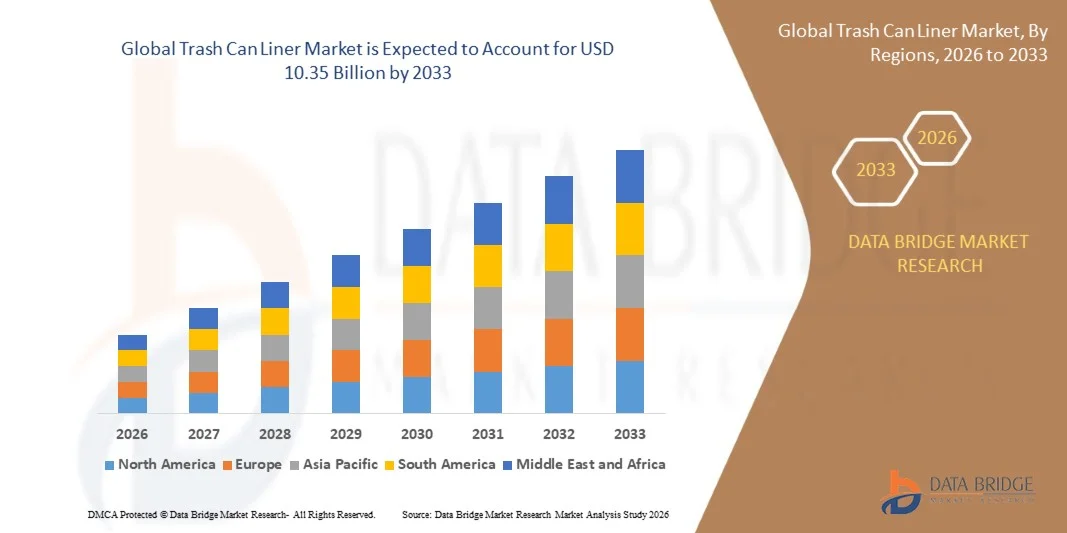
The Trash Can Liner Market was valued at USD 7.50 billion in 2025 and is projected to reach USD 10.35 billion by 2033, growing at a CAGR of 4.12% from 2026 to 2033. The market is witnessing steady expansion driven by increasing demand for efficient waste management solutions across residential, commercial, and industrial sectors, along with rising awareness regarding hygiene, sanitation, and environmental sustainability.
The growth of urbanization, coupled with the expansion of hospitality, healthcare, and retail industries, is further accelerating the adoption of durable and cost-effective trash can liners. In addition, advancements in biodegradable and eco-friendly plastic materials are encouraging manufacturers to develop sustainable liner products that comply with tightening environmental regulations and reduce plastic waste impact globally.
Key Market Trends & Insights
- North America dominated the trash can liner market with the largest revenue share of approximately 37.4% in 2025, supported by strong municipal waste infrastructure, high hygiene awareness, and widespread adoption of standardized waste management systems across residential and commercial sectors.
- Asia-Pacific is expected to be the fastest-growing region, recording a CAGR of approximately 5.0% to 5.4% from 2026 to 2033. Growth is driven by rapid urbanization, increasing municipal waste generation, expansion of smart city initiatives, and rising adoption of organized waste collection systems in countries such as China, India, and Japan.
- The High Density Polyethylene segment held the largest market revenue share of approximately 42.6% in 2025 driven by its superior tensile strength, puncture resistance, and cost efficiency in large-scale waste management applications across commercial and industrial sectors. HDPE liners are widely preferred in hospitals, municipal waste systems, and food service industries due to their durability and ability to handle heavy and sharp waste loads.
- The Low Density Polyethylene segment is projected to register the fastest growth at a CAGR of 5.1% from 2026 to 2033, driven by increasing demand for flexible, lightweight, and leak-resistant liners in residential and light commercial applications. Rising adoption in household waste management and office sanitation systems is further supporting segment expansion due to its ease of use and affordability.
- The Medium Size segment held the largest market revenue share of approximately 46.3% in 2025 driven by its widespread use in residential kitchens, office spaces, and healthcare facilities where moderate waste volumes are generated on a daily basis. Medium liners offer an optimal balance between capacity, material usage, and cost efficiency, making them the most commonly adopted category globally.
- The Large Size segment is projected to register the fastest growth at a CAGR of 4.8% from 2026 to 2033, driven by increasing demand from industrial facilities, commercial complexes, and municipal waste collection systems. Expansion of logistics hubs, manufacturing units, and institutional cleaning services is further accelerating adoption of high-capacity liners for bulk waste handling.
- The Retail and Consumer segment held the largest market revenue share of approximately 38.9% in 2025 driven by high household consumption, rising urbanization, and increasing awareness regarding hygiene and sanitation practices. Growing demand for convenient packaged waste disposal solutions in supermarkets and e-commerce platforms is further strengthening this segment.
- The Institutional segment is projected to register the fastest growth at a CAGR of 5.3% from 2026 to 2033, driven by rising usage in hospitals, educational institutions, airports, and government facilities. Increasing emphasis on hygiene standards, biomedical waste segregation, and regulatory compliance in public infrastructure is accelerating adoption of standardized and high-strength trash can liners across institutional settings.
Market Size & Forecast
- Global Market Value (2025): USD 7.50 Billion
- Expected Market Value (2033): USD 10.35 Billion
- Forecast CAGR (2026–2033): 4.12%
- Leading Region in 2025: North America
- Fastest Growing Region: Asia-Pacific
Report Scope and Trash Can Liner Market Segmentation
|
Attributes |
Trash Can Liner Key Market Insights |
|
Segments Covered |
|
|
Countries Covered |
North America
Europe
Asia-Pacific
Middle East and Africa
South America
|
|
Key Market Players |
• 3M (U.S.) |
|
Market Opportunities |
|
|
Value Added Data Infosets |
In addition to the insights on market scenarios such as market value, growth rate, segmentation, geographical coverage, and major players, the market reports curated by the Data Bridge Market Research also include import export analysis, production capacity overview, production consumption analysis, price trend analysis, climate change scenario, supply chain analysis, value chain analysis, raw material/consumables overview, vendor selection criteria, PESTLE Analysis, Porter Analysis, and regulatory framework. |
Trash Can Liner Market Trends
Trend: Growth In Sustainable Waste Management And Eco-Friendly Trash Can Liner Adoption
Increasing global emphasis on environmental sustainability, circular economy practices, and plastic waste reduction is accelerating the adoption of biodegradable, compostable, and recycled-content trash can liners across residential, commercial, and industrial applications. Conventional plastic liners derived from virgin polyethylene are increasingly facing regulatory scrutiny due to landfill accumulation and long degradation cycles, pushing manufacturers toward bio-based alternatives and recyclable polymer blends.
In modern municipal waste management systems, governments are mandating the use of eco-friendly liners in public sanitation and institutional facilities, such as hospitals, airports, and educational campuses, to reduce environmental impact and improve segregation efficiency at source. In addition, retail and hospitality sectors are shifting toward certified compostable liners, such as those compliant with ASTM D6400 and EN 13432 standards, to align with ESG commitments and corporate sustainability goals.
The rapid expansion of organized waste collection systems and smart city initiatives is also increasing demand for high-strength, leak-resistant liners capable of handling mixed waste streams in densely populated urban centers. In addition, large-scale sustainability programs in regions such as the European Union and parts of North America are promoting extended producer responsibility (EPR) frameworks, encouraging packaging and liner manufacturers to adopt recycled resin content exceeding 30–50% in product formulations. Pilot municipal waste diversion programs implemented in 2025 in countries such as Germany and Japan have demonstrated landfill waste reduction improvements of nearly 12–18% through structured use of biodegradable liner systems.
Trash Can Liner Market Dynamics
Key Market Driver: Rising Demand For Hygienic And Efficient Waste Collection Systems
Urbanization and population density growth are significantly increasing daily waste generation across residential complexes, commercial offices, and healthcare facilities, creating strong demand for reliable and hygienic waste containment solutions. Trash can liners play a critical role in preventing contamination, odor leakage, and cross-infection risks, particularly in medical and food service environments.
Healthcare facilities, hospitality chains, and food processing industries are increasingly deploying high-density polyethylene (HDPE) and linear low-density polyethylene (LLDPE) liners to ensure durability and leakage resistance during waste handling and transportation. For instance, large hospital networks in India and Southeast Asia are adopting color-coded liner systems to improve biomedical waste segregation efficiency and comply with WHO sanitation guidelines.
Similarly, municipal waste collection programs in densely populated urban regions are expanding structured waste bag distribution systems to improve collection efficiency and reduce manual handling risks. Large-scale sanitation initiatives in countries such as India under urban cleanliness programs have significantly increased institutional procurement of standardized trash liners, supporting market growth.
Key Restraint/Challenge: Environmental Concerns And Volatility In Raw Material Prices
The trash can liner market faces significant pressure due to environmental concerns associated with single-use plastic waste and increasing regulatory restrictions on polyethylene-based products. Governments across multiple regions are imposing bans or taxes on non-recyclable plastic products, creating compliance challenges for manufacturers reliant on conventional resin materials.
In addition, fluctuations in crude oil prices directly impact the cost of polyethylene and polypropylene resins used in liner production, leading to pricing instability and margin pressure for manufacturers. Small and medium-scale producers are particularly affected due to limited ability to absorb raw material cost volatility or invest in sustainable material transition.
Industry benchmarking indicates that traditional plastic liners derived from virgin polymers still account for a significant portion of global consumption, while biodegradable alternatives remain costlier by approximately 20–40%, limiting widespread adoption in price-sensitive markets such as developing economies.
Key Market Opportunity: Expansion Of Biodegradable And Smart Waste Management Solutions
The increasing integration of smart waste management systems and sustainability-driven procurement policies is creating strong opportunities for innovative trash can liner solutions. Growing adoption of biodegradable resins such as polylactic acid (PLA), starch-based polymers, and oxo-biodegradable blends is enabling manufacturers to cater to environmentally conscious consumers and institutional buyers.
Municipal authorities and private waste management companies are increasingly adopting sensor-enabled smart bins combined with standardized liner systems to improve collection efficiency and optimize waste routing operations. For instance, pilot smart city projects in countries such as South Korea and the United Arab Emirates have demonstrated waste collection efficiency improvements of nearly 15–20% through optimized liner-based waste segregation systems.
In addition, rising demand from e-commerce fulfillment centers, logistics hubs, and large-scale retail warehouses is creating opportunities for high-capacity, tear-resistant liners designed for bulk packaging waste handling. Advancements in material science, including multilayer film technology and recycled polymer enhancement, are further supporting performance improvements while maintaining sustainability targets across global markets.
Trash Can Liner Market Scope
The market is segmented on the basis of material type, size, and end-user application.
• By Material Type
On the basis of material type, the trash can liner market is segmented into Polyethylene, Low Density Polyethylene, High Density Polyethylene, Polypropylene, and Others. The High Density Polyethylene segment held the largest market revenue share of approximately 42.6% in 2025 driven by its superior tensile strength, puncture resistance, and cost efficiency in large-scale waste management applications across commercial and industrial sectors. HDPE liners are widely preferred in hospitals, municipal waste systems, and food service industries due to their durability and ability to handle heavy and sharp waste loads.
The Low Density Polyethylene segment is projected to register the fastest growth at a CAGR of 5.1% from 2026 to 2033, driven by increasing demand for flexible, lightweight, and leak-resistant liners in residential and light commercial applications. Rising adoption in household waste management and office sanitation systems is further supporting segment expansion due to its ease of use and affordability.
• By Size
On the basis of size, the trash can liner market is segmented into Small Size (Up to 5 Litres), Medium Size (Between 5 and 20 Litres), and Large Size (More than 20 Litres). The Medium Size segment held the largest market revenue share of approximately 46.3% in 2025 driven by its widespread use in residential kitchens, office spaces, and healthcare facilities where moderate waste volumes are generated on a daily basis. Medium liners offer an optimal balance between capacity, material usage, and cost efficiency, making them the most commonly adopted category globally.
The Large Size segment is projected to register the fastest growth at a CAGR of 4.8% from 2026 to 2033, driven by increasing demand from industrial facilities, commercial complexes, and municipal waste collection systems. Expansion of logistics hubs, manufacturing units, and institutional cleaning services is further accelerating adoption of high-capacity liners for bulk waste handling.
• By End-User
On the basis of end-user application, the trash can liner market is segmented into Retail and Consumer, Institutional, Industrial, and Others. The Retail and Consumer segment held the largest market revenue share of approximately 38.9% in 2025 driven by high household consumption, rising urbanization, and increasing awareness regarding hygiene and sanitation practices. Growing demand for convenient packaged waste disposal solutions in supermarkets and e-commerce platforms is further strengthening this segment.
The Institutional segment is projected to register the fastest growth at a CAGR of 5.3% from 2026 to 2033, driven by rising usage in hospitals, educational institutions, airports, and government facilities. Increasing emphasis on hygiene standards, biomedical waste segregation, and regulatory compliance in public infrastructure is accelerating adoption of standardized and high-strength trash can liners across institutional settings.
Trash Can Liner Market Regional Analysis
North America Trash Can Liner Market Insight
North America dominated the trash can liner market with the largest revenue share of approximately 37.4% in 2025, supported by strong waste management infrastructure, high hygiene awareness, and widespread adoption of standardized sanitation practices across residential, commercial, and institutional sectors. The region benefits from well-established municipal waste collection systems and high consumption of packaged hygiene products, driving consistent demand for durable, leak-resistant trash can liners. In addition, strict environmental regulations and increasing use of recycled-content plastic materials are further shaping product innovation and sustainable packaging adoption across the region.
U.S. Trash Can Liner Market Insight
The U.S. trash can liner market captured the largest revenue share within North America in 2025, driven by high per capita waste generation and strong demand from residential households, healthcare facilities, hospitality chains, and large-scale retail infrastructure. Consumers and institutions increasingly prioritize high-strength HDPE and LLDPE liners for odor control, contamination prevention, and efficient waste segregation. The growing adoption of organized waste management programs, such as city-level recycling mandates and landfill diversion targets, is further accelerating market expansion. In addition, widespread availability of branded consumer packaging through supermarkets and e-commerce platforms is supporting steady volume growth.
Europe Trash Can Liner Market Insight
The Europe trash can liner market is expected to witness the fastest growth rate from 2026 to 2033, primarily driven by stringent environmental regulations, circular economy initiatives, and increasing demand for biodegradable and compostable waste disposal solutions. The region’s strong focus on reducing single-use plastics is encouraging adoption of eco-friendly liners made from starch-based polymers and recycled resins. In addition, rising urbanization and expansion of institutional waste management systems across commercial buildings, hospitals, and public facilities are supporting steady market penetration. Regulatory frameworks such as extended producer responsibility (EPR) are further promoting sustainable product innovation.
U.K. Trash Can Liner Market Insight
The U.K. trash can liner market is expected to witness steady growth from 2026 to 2033, driven by increasing focus on household recycling practices and strong demand for hygienic waste disposal solutions across residential and commercial applications. Rising awareness regarding plastic waste reduction and government-backed sustainability programs are encouraging the use of biodegradable and recycled-content liners. In addition, growth in the hospitality and food service industries is increasing demand for durable, odor-resistant liners suitable for high-frequency waste disposal environments.
Germany Trash Can Liner Market Insight
The Germany trash can liner market is expected to witness significant growth from 2026 to 2033, supported by strict environmental policies, advanced waste segregation systems, and strong consumer preference for sustainable packaging materials. Germany’s well-developed recycling infrastructure and emphasis on circular economy principles are driving adoption of compostable and high-recycled-content liners across households and industrial applications. Increasing use of standardized waste separation systems in residential complexes and commercial facilities is further strengthening demand for high-quality, durable liner products.
Asia-Pacific Trash Can Liner Market Insight
The Asia-Pacific trash can liner market is expected to witness the fastest growth rate from 2026 to 2033, supported by rapid urbanization, rising disposable incomes, and expanding municipal waste management systems in countries such as China, India, and Japan. The region’s growing residential construction activity and increasing penetration of organized retail are significantly boosting demand for cost-effective and durable trash can liners. In addition, government-led cleanliness initiatives and smart city programs are encouraging structured waste segregation practices, accelerating product adoption across both urban and semi-urban areas.
Japan Trash Can Liner Market Insight
The Japan trash can liner market is expected to witness steady growth from 2026 to 2033 due to the country’s advanced waste segregation culture, high hygiene standards, and strong emphasis on efficient household and institutional waste management. Consumers prefer compact, high-strength liners suitable for strict sorting systems and limited waste storage spaces. Increasing adoption of eco-friendly materials, including biodegradable polymers, is further aligning with Japan’s sustainability goals. In addition, aging demographics are contributing to demand for convenient and easy-to-handle waste disposal solutions in residential and healthcare environments.
China Trash Can Liner Market Insight
The China trash can liner market accounted for the largest revenue share in Asia-Pacific in 2025, attributed to rapid urban expansion, high population density, and strong growth in residential and commercial infrastructure. Increasing municipal waste generation and expansion of organized sanitation systems are driving large-scale demand for durable and cost-efficient liners. The presence of strong domestic manufacturing capabilities ensures wide product availability at competitive prices. In addition, government-led urban cleanliness initiatives and rising adoption of modern waste management practices in smart city developments are further supporting market growth.
Trash Can Liner Market Share
The Trash Can Liner industry is primarily led by well-established companies, including:
• 3M (U.S.)
• Avery Dennison Corporation (U.S.)
• CCL Industries (Canada)
• Henkel Adhesives Technologies India Private Limited (India)
• ImageTek Labels (U.S.)
• UPM (Finland)
• LINTEC Corporation (Japan)
• Seiko Holdings Corporation (Japan)
• Mondi (U.K.)
• labelsandlabeling (U.S.)
• Chicago Tag & Label (U.S.)
• Honeywell International Inc. (U.S.)
• Intertronics (U.K.)
• Sika AG (Switzerland)
• Macfarlane Group Plc (U.K.)
• H.B. Fuller Company (U.S.)
• Guangzhou Manborui Material Technology Co Ltd (China)
• Constantia Flexibles (Austria)
• Coveris (U.K.)
• R.R. Donnelley & Sons Company (U.S.)
• The Clorox Company (U.S.)
• Reynolds Consumer Products (U.S.)
• Poly-America, L.P. (U.S.)
• Berry Global Inc. (U.S.)
• International Plastics Inc. (U.S.)
• Harwal Group of Companies (U.A.E.)
• Novolex (U.S.)
• NOVPLASTA CZ, s.r.o. (Czech Republic)
• Dagöplast (Estonia)
• Four Star Plastics (U.S.)
• ACHAIKA PLASTICS S.A. (Greece)
• Inteplast Group (U.S.)
• WhiteHall Products (U.S.)
• Heritage Bag (U.S.)
SKU-

- Interactive Data Analysis Dashboard
- Company Analysis Dashboard for high growth potential opportunities
- Research Analyst Access for customization & queries
- Competitor Analysis with Interactive dashboard
- Latest News, Updates & Trend analysis
- Harness the Power of Benchmark Analysis for Comprehensive Competitor Tracking
Global Trash Can Liner Market, Supply Chain Analysis and Ecosystem Framework
To support market growth and help clients navigate the impact of geopolitical shifts, DBMR has integrated in-depth supply chain analysis into its Global Trash Can Liner Market research reports. This addition empowers clients to respond effectively to global changes affecting their industries. The supply chain analysis section includes detailed insights such as Global Trash Can Liner Market consumption and production by country, price trend analysis, the impact of tariffs and geopolitical developments, and import and export trends by country and HSN code. It also highlights major suppliers with data on production capacity and company profiles, as well as key importers and exporters. In addition to research, DBMR offers specialized supply chain consulting services backed by over a decade of experience, providing solutions like supplier discovery, supplier risk assessment, price trend analysis, impact evaluation of inflation and trade route changes, and comprehensive market trend analysis.
Data collection and base year analysis are done using data collection modules with large sample sizes. The stage includes obtaining market information or related data through various sources and strategies. It includes examining and planning all the data acquired from the past in advance. It likewise envelops the examination of information inconsistencies seen across different information sources. The market data is analysed and estimated using market statistical and coherent models. Also, market share analysis and key trend analysis are the major success factors in the market report. To know more, please request an analyst call or drop down your inquiry.
The key research methodology used by DBMR research team is data triangulation which involves data mining, analysis of the impact of data variables on the market and primary (industry expert) validation. Data models include Vendor Positioning Grid, Market Time Line Analysis, Market Overview and Guide, Company Positioning Grid, Patent Analysis, Pricing Analysis, Company Market Share Analysis, Standards of Measurement, Global versus Regional and Vendor Share Analysis. To know more about the research methodology, drop in an inquiry to speak to our industry experts.
Data Bridge Market Research is a leader in advanced formative research. We take pride in servicing our existing and new customers with data and analysis that match and suits their goal. The report can be customized to include price trend analysis of target brands understanding the market for additional countries (ask for the list of countries), clinical trial results data, literature review, refurbished market and product base analysis. Market analysis of target competitors can be analyzed from technology-based analysis to market portfolio strategies. We can add as many competitors that you require data about in the format and data style you are looking for. Our team of analysts can also provide you data in crude raw excel files pivot tables (Fact book) or can assist you in creating presentations from the data sets available in the report.


