
Global Vanilla Market
Market Size in USD Billion
 USD
3.34 Billion
USD
4.99 Billion
2024
2032
USD
3.34 Billion
USD
4.99 Billion
2024
2032
| 2025 - 2032 | |
| USD 3.34 Billion | |
| USD 4.99 Billion | |
| % | |
|
What is the Global Vanilla Market Size and Growth Rate?
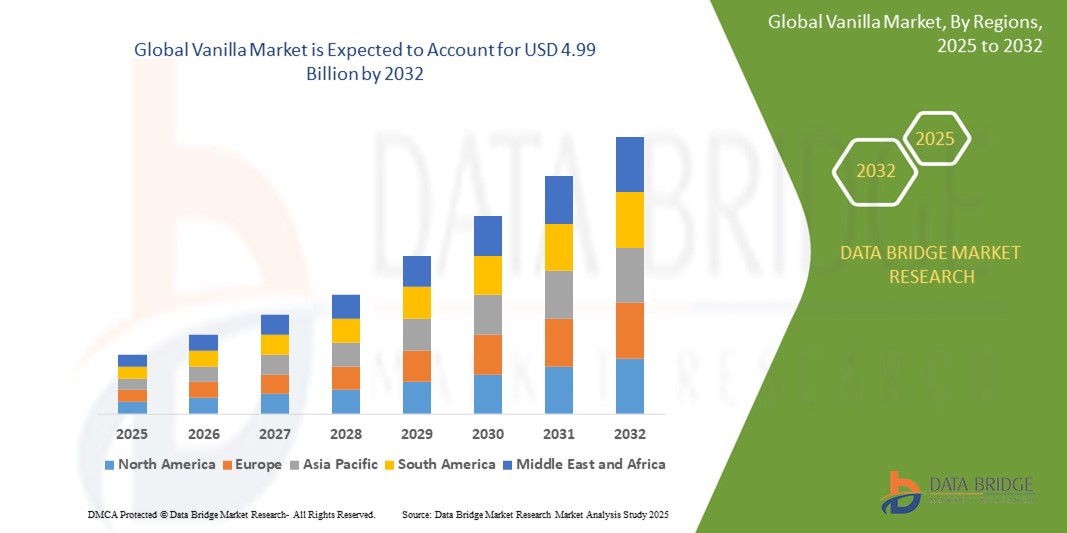
- The global Vanilla market size was valued at USD 3.34 billion in 2024 and is expected to reach USD 4.99 billion by 2032, at a CAGR of 5.17% during the forecast period
- In the food and beverage industry, vanilla serves as a quintessential flavoring agent, enhancing the taste profile of a wide array of products. Its rich, sweet aroma and flavor make it a popular choice in ice creams, baked goods, chocolates, desserts, and beverages
- Vanilla adds depth and complexity to culinary creations, elevating the consumer experience with its warm and comforting notes. Its versatility allows for both subtle undertones and prominent flavors, making it an indispensable ingredient in the formulation of many food and beverage products
- As consumer preferences trend towards natural ingredients, the demand for high-quality vanilla continues to drive the market forward in this sector
What are the Major Takeaways of Vanilla Market?
- Vanilla's versatility and ability to enhance a wide range of food and beverage products make it a sought-after ingredient in the culinary world. Moreover, the perception of vanilla as a timeless and comforting flavor contributes to its enduring popularity among consumers. Manufacturers and retailers respond to this demand by incorporating vanilla into a diverse array of products, driving market growth and innovation
- North America held the largest revenue share of 37.8% in the global Vanilla market in 2024, driven by growing demand for natural, clean-label ingredients and increased health consciousness among consumers
- Asia-Pacific Vanilla market is expected to grow at the fastest CAGR of 13.9% from 2025 to 2032, driven by rapid urbanization, rising disposable incomes, and expanding food and beverage industries across key countries including China, India, Japan, and Southeast Asia
- The Conventional segment dominated the Vanilla market with the largest revenue share of 71.6% in 2024, driven by the high availability, cost-effectiveness, and widespread use of conventional Vanilla across mainstream food, beverage, and fragrance applications
Report Scope and Vanilla Market Segmentation
|
Attributes |
Vanilla Key Market Insights |
|
Segments Covered |
|
|
Countries Covered |
North America
Europe
Asia-Pacific
Middle East and Africa
South America
|
|
Key Market Players |
|
|
Market Opportunities |
|
|
Value Added Data Infosets |
In addition to the insights on market scenarios such as market value, growth rate, segmentation, geographical coverage, and major players, the market reports curated by the Data Bridge Market Research also include in-depth expert analysis, pricing analysis, brand share analysis, consumer survey, demography analysis, supply chain analysis, value chain analysis, raw material/consumables overview, vendor selection criteria, PESTLE Analysis, Porter Analysis, and regulatory framework. |
What is the Key Trend in the Vanilla Market?
“Rising Demand for Sustainable and Ethically Sourced Vanilla Products”
- A major and evolving trend in the global Vanilla market is the increasing demand for sustainably sourced, traceable, and ethically produced Vanilla, driven by consumer awareness around environmental impact and fair trade practices
- Buyers, especially in developed markets, are prioritizing Vanilla products backed by certifications such as Fair Trade, Rainforest Alliance, and Organic, prompting manufacturers to establish transparent, responsible sourcing programs
- For instance, in 2024, Nielsen-Massey Vanillas Inc. expanded its sustainable sourcing initiatives across Madagascar, focusing on farmer welfare, biodiversity conservation, and traceable Vanilla supply chains
- The market is also seeing innovation in synthetic biology and biotechnology, enabling the production of Vanilla flavor compounds through fermentation and bioengineering, offering a sustainable, scalable alternative to traditional cultivation
- Furthermore, partnerships between Vanilla producers, NGOs, and governments are driving community development and environmental stewardship in major Vanilla-producing regions, particularly in Madagascar and Uganda
- This sustainability-driven trend is reshaping the competitive landscape, with companies leveraging ethical sourcing and environmental commitments as key differentiators to meet consumer expectations and regulatory pressures
- As global focus intensifies on responsible consumption and climate resilience, ethically sourced, transparent Vanilla products are expected to drive future market growth and brand loyalty
What are the Key Drivers of Vanilla Market?
- The surging demand for premium, authentic flavors in food, beverage, and personal care products is a significant driver of the Vanilla market's expansion, as consumers seek high-quality, naturally derived ingredients
- For instance, in January 2025, Eurovanille introduced its latest line of gourmet Vanilla extracts, highlighting traceability, clean-label formulation, and superior sensory profiles to cater to discerning customers worldwide
- Growing consumer awareness regarding sustainability and fair trade practices is prompting manufacturers to integrate ethically sourced Vanilla into product portfolios, enhancing brand reputation and meeting regulatory requirements
- In addition, the proliferation of artisanal and specialty food segments, including craft confectionery, dairy, and bakery products, is fueling demand for unique, natural Vanilla profiles that enhance product differentiation
- The increasing role of Vanilla in the cosmetics and personal care industries, particularly in fragrance, skincare, and aromatherapy products, is creating new avenues for market growth, driven by the appeal of botanical ingredients
- Rising disposable incomes, evolving dietary preferences, and the trend toward premiumization are further amplifying demand for high-quality Vanilla across both mature and emerging markets
Which Factor is challenging the Growth of the Vanilla Market?
- The volatile pricing and limited availability of natural Vanilla, particularly from Madagascar, the world’s largest supplier, present significant challenges to market stability and scalability
- For instance, recurring issues such as extreme weather events, political instability, and supply chain disruptions have led to sharp fluctuations in Vanilla prices, impacting manufacturers' cost structures
- Quality consistency remains a concern, as natural Vanilla production is susceptible to agricultural risks, adulteration, and varying flavor profiles, complicating large-scale, standardized product development
- Furthermore, the high production and procurement costs of natural Vanilla compared to synthetic alternatives limit adoption among price-sensitive markets, especially in mass-produced food and beverage segments
- Regulatory complexities surrounding origin labeling, organic certification, and allergen management, particularly in North America and Europe, add to compliance burdens for Vanilla producers
- To overcome these challenges, industry stakeholders must invest in sustainable farming, supply chain transparency, synthetic biology innovations, and cost-efficient production models to ensure long-term Vanilla market growth
How is the Vanilla Market Segmented?
The market is segmented on the basis of product type, origin, form, distribution channel, and end-use.
- By Product Type
On the basis of product type, the Vanilla market is segmented into Organic and Conventional. The Conventional segment dominated the Vanilla market with the largest revenue share of 71.6% in 2024, driven by the high availability, cost-effectiveness, and widespread use of conventional Vanilla across mainstream food, beverage, and fragrance applications. Manufacturers continue to prefer conventional Vanilla due to lower production costs and consistent supply.
The Organic segment is projected to grow at the fastest CAGR from 2025 to 2032, fueled by increasing consumer demand for clean-label, chemical-free, and sustainably sourced ingredients, particularly in health-conscious and premium product categories.
- By Origin
On the basis of origin, the Vanilla market is segmented into Natural and Synthetic. The Natural segment dominated the market with the largest revenue share of 64.3% in 2024, supported by rising consumer preference for authentic, plant-derived flavors and the growing trend toward clean-label and transparent ingredient sourcing across the food, beverage, and personal care industries.
The Synthetic segment is expected to witness steady growth due to its affordability, stable supply, and widespread use in price-sensitive markets, particularly for large-scale, cost-driven production in mass-market products.
- By Form
On the basis of form, the Vanilla market is segmented into Liquid, Powder, and Paste. The Liquid segment dominated the market with the largest revenue share of 48.7% in 2024, driven by its high solubility, strong flavor concentration, and extensive use in beverages, dairy, sauces, and confectionery applications, where liquid essences offer ease of formulation.
The Powder segment is projected to grow at the fastest CAGR from 2025 to 2032, owing to its longer shelf life, easy transport, and growing demand in dry food mixes, instant beverages, and baking applications. The Paste segment holds niche demand, especially in gourmet and artisanal food preparations.
- By Distribution Channel
On the basis of distribution channel, the Vanilla market is segmented into Retailers, Supermarket, Hypermarket, and E-commerce. The Supermarket segment held the largest revenue share of 34.9% in 2024, driven by high consumer footfall, easy product accessibility, and the growing range of Vanilla offerings available on supermarket shelves, including both food-grade and cosmetic-grade products.
The E-commerce segment is anticipated to record the fastest CAGR from 2025 to 2032, propelled by the surge in online shopping, convenience-driven purchasing patterns, and the expanding availability of Vanillas through digital platforms catering to both B2C and B2B buyers.
- By End-Use
On the basis of end-use, the Vanilla market is segmented into Food Industry, Beverages, Cosmetics Industry, and Pharmaceuticals Industry. The Food Industry segment dominated the market with the largest revenue share of 38.5% in 2024, supported by the broad application of Vanilla as a key flavoring agent in bakery, dairy, confectionery, and other food products. Growing demand for natural and premium flavors continues to drive this segment's dominance.
The Pharmaceuticals Industry segment is expected to grow at the fastest CAGR from 2025 to 2032, owing to increasing use of Vanilla in syrups, supplements, and wellness products, where flavor masking, aroma enhancement, and sensory appeal are critical for consumer acceptance.
Which Region Holds the Largest Share of the Vanilla Market?
- North America held the largest revenue share of 37.8% in the global Vanilla market in 2024, driven by growing demand for natural, clean-label ingredients and increased health consciousness among consumers. The region’s mature food and beverage sector, combined with innovation in flavor development, continues to drive high adoption of premium Vanillas across bakery, dairy, confectionery, and beverage applications
- Consumers in North America prefer organic, non-artificial, and plant-based flavor solutions, positioning Vanillas as a key ingredient for product differentiation, particularly in health-conscious and premium product categories
- The presence of major market players, strong investments in flavor innovation, and widespread availability of natural essence products solidify North America’s leadership in the Vanilla market
U.S. Vanilla Market Insight
U.S. Vanilla market accounted for the largest share within North America in 2024, supported by high demand across food, beverage, nutraceutical, and personal care sectors. Consumer preferences for clean-label, plant-based, and authentic flavors continue to drive Vanilla consumption, particularly in flavored beverages, snacks, and health products. Growth in wellness-focused categories, such as functional drinks and dairy alternatives, further fuels market expansion, supported by the country’s advanced food manufacturing infrastructure.
Europe Vanilla Market Insight
The Europe Vanilla market is expected to witness steady growth, driven by stringent regulatory frameworks promoting natural ingredients and strong demand for premium, organic, and sustainable food products. Rising health awareness, along with flavor innovation in bakery, dairy, and beverage industries, is boosting Vanilla adoption. The region is also experiencing growing interest in clean-label, plant-based products, positioning Vanillas as an essential component in both traditional and emerging food formulations.
U.K. Vanilla Market Insight
U.K. Vanilla market is set to grow at a significant CAGR, fueled by strong consumer demand for authentic, natural, and clean-label flavors. Expanding food and beverage sectors, rising health consciousness, and the trend toward premiumization drive Vanilla consumption in flavored drinks, confectionery, and wellness products. In addition, the increasing popularity of exotic fruit flavors and natural essences presents new growth opportunities for Vanilla suppliers targeting the U.K. market.
Germany Vanilla Market Insight
The Germany Vanilla market is projected to expand at a substantial CAGR, supported by high demand for natural, organic, and sustainability-focused food ingredients. Germany’s emphasis on vegan, clean-label, and eco-conscious products enhances the market potential for Vanillas across beverage, bakery, and dairy applications. Local manufacturers are investing in advanced extraction technologies and product innovations to improve flavor authenticity, shelf life, and traceability, supporting steady market growth.
Which Region is the Fastest Growing Region in the Vanilla Market?
Asia-Pacific Vanilla market is expected to grow at the fastest CAGR of 13.9% from 2025 to 2032, driven by rapid urbanization, rising disposable incomes, and expanding food and beverage industries across key countries including China, India, Japan, and Southeast Asia. The region’s growing middle class, preference for convenient and flavored food products, and government-backed food innovation initiatives are major growth drivers. Asia-Pacific's emergence as a manufacturing hub for Vanilla products further enhances affordability and availability, accelerating market penetration.
Japan Vanilla Market Insight
The Japan Vanilla market is experiencing rapid growth, driven by the country’s culinary heritage, demand for authentic, high-quality flavors, and rising popularity of natural ingredients. Integration of Vanillas into health-oriented foods, functional beverages, and wellness products is supporting market expansion. Japan’s aging population and demand for easy-to-consume, flavorful, and health-enhancing offerings further boost Vanilla adoption across the food, nutraceutical, and personal care sectors.
China Vanilla Market Insight
China Vanilla market accounted for the largest revenue share within Asia-Pacific in 2024, fueled by urbanization, rising health awareness, and growing demand for premium, natural flavor solutions. Strong domestic production capabilities, combined with government support for food innovation, have accelerated Vanilla consumption across dairy, snacks, beverages, and functional food categories. China’s expanding middle-class population and focus on healthy lifestyles continue to drive robust Vanilla market growth.
Which are the Top Companies in Vanilla Market?
The vanilla industry is primarily led by well-established companies, including:
- Amadeus Trading Co. (U.S.)
- Apex Flavors (U.S.)
- Boston Vanilla Bean Company (U.S.)
- Charles H. Baldwin and Sons (U.S.)
- Daintree Vanilla and Spice (Australia)
- E.A. Weber and Co. (U.S.)
- Eurovanille (France)
- Lochhead Manufacturing Company (U.S.)
- MacTaggarts Brand (U.S.)
- McCormick & Company Inc. (U.S.)
- Nielsen Massey Vanillas Inc. (U.S.)
- Rodelle Inc. (U.S.)
- SAMBIRANO AROMATIC (Switzerland)
What are the Recent Developments in Global Vanilla Market?
- In April 2024, Taiwanese Vanilla products received global recognition as they were honored with the Superior Taste Award by the International Taste Institute, Brussels. The award-winning products included "Vanilla Ville Vanilla Pods," crafted by the Linbian Natural and Culture Preservation Association, and "Organic Vanilla Beans," produced by the Harmony Organic Agriculture Foundation, marking the latter's second consecutive win. This achievement highlights Taiwan's growing reputation in producing premium quality Vanilla for global markets
- In January 2024, NotCo, a fast-growing food technology company, expanded its NotMilk product line with the introduction of NotMilk Unsweetened Vanilla and NotMilk Barista across new markets. Powered by its proprietary AI platform, Giuseppe, this move enables the company to meet the surging demand for plant-based, Vanilla-flavored alternatives. This expansion reflects NotCo's commitment to innovation and catering to evolving consumer preferences for clean-label products
- In December 2021, Advanced Biotech launched "Abtvanforall Plus Natural," a bio-vanillin solution formulated for diverse applications, including alcoholic beverages, baked goods, frozen dairy, and hard candy. This innovation addresses the increasing need for natural, sustainable flavor alternatives in the Vanilla market. The launch reinforces Advanced Biotech's role in driving clean-label solutions across multiple industries
- In August 2021, Vanilla Bean Kings announced the expansion of its operations with a new production facility located in Western Meadows Industrial Park. This strategic expansion enhances the company's manufacturing capabilities to meet rising demand, particularly in Hartford, Boston, and other key U.S. markets. The move strengthens Vanilla Bean Kings' position as a prominent supplier in the growing natural Vanilla segment
- In January 2021, Blue Pacific Flavours unveiled "Kilimanjaro Vanilla," a sustainably sourced Vanilla extract catering to the rising global demand for natural, clean-label, and eco-friendly flavor solutions. This product introduction enables Blue Pacific Flavours to align with consumer preferences and reinforces its sustainability-driven approach in the Vanilla market
SKU-

- Interactive Data Analysis Dashboard
- Company Analysis Dashboard for high growth potential opportunities
- Research Analyst Access for customization & queries
- Competitor Analysis with Interactive dashboard
- Latest News, Updates & Trend analysis
- Harness the Power of Benchmark Analysis for Comprehensive Competitor Tracking
Table of Content
1 INTRODUCTION
1.1 OBJECTIVES OF THE STUDY
1.2 MARKET DEFINITION
1.3 OVERVIEW OF GLOBAL VANILLA MARKET
1.4 CURRENCY AND PRICING
1.5 LIMITATION
1.6 MARKETS COVERED
2 MARKET SEGMENTATION
2.1 KEY TAKEAWAYS
2.2 ARRIVING AT THE GLOBAL VANILLA MARKET SIZE
2.2.1 VENDOR POSITIONING GRID
2.2.2 TECHNOLOGY LIFE LINE CURVE
2.2.3 MARKET GUIDE
2.2.4 COMPANY POSITIONING GRID
2.2.5 COMAPANY MARKET SHARE ANALYSIS
2.2.6 MULTIVARIATE MODELLING
2.2.7 DEMAND AND SUPPLY-SIDE VARIABLES
2.2.8 TOP TO BOTTOM ANALYSIS
2.2.9 STANDARDS OF MEASUREMENT
2.2.10 VENDOR SHARE ANALYSIS
2.2.11 DATA POINTS FROM KEY PRIMARY INTERVIEWS
2.2.12 DATA POINTS FROM KEY SECONDARY DATABASES
2.3 GLOBAL VANILLA MARKET: RESEARCH SNAPSHOT
2.4 ASSUMPTIONS
3 MARKET OVERVIEW
3.1 DRIVERS
3.2 RESTRAINTS
3.3 OPPORTUNITIES
3.4 CHALLENGES
4 EXECUTIVE SUMMARY
5 PREMIUM INSIGHTS
5.1 VALUE CHAIN ANALYSIS
5.2 SUPPLY CHAIN ANALYSIS
5.3 IMPORT-EXPORT ANALYSIS
5.4 PORTER’S FIVE FORCES ANALYSIS
5.4.1 BARGAINING POWER OF SUPPLIERS
5.4.2 BARGAINING POWER OF BUYERS/CONSUMERS
5.4.3 THREAT OF NEW ENTRANTS
5.4.4 THREAT OF SUBSTITUTE PRODUCTS
5.4.5 INTENSITY OF COMPETITIVE RIVALRY
5.5 RAW MATERIAL SOURCING ANALYSIS
5.6 OVERVIEW OF TECHNOLOGICAL INNOVATIONS
5.7 INDUSTRY TRENDS AND FUTURE PERSPECTIVE
5.8 GROWTH STRATEGIES ADOPTED BY KEY MARKET PLAYERS
5.9 FACTORS INFLUENCING PURCHASING DECISION OF END-USERS
5.1 CONSUMER BUYING BEHAVIOUR
5.11 PRODUCT ADOPTION SCENARIO
6 SUPPLY CHAIN ANALYSIS
6.1 OVERVIEW
6.2 LOGISTIC COST SCENARIO
6.3 IMPORTANCE OF LOGISTICS SERVICE PROVIDERS
7 IMPACT OF ECONOMIC SLOW DOWN ON MARKET
7.1 IMPACT ON PRICE
7.2 IMPACT ON SUPPLY CHAIN
7.3 IMPACT ON SHIPMENT
7.4 IMPACT ON COMPANY’S STRATEGIC DECISIONS
8 REGULATORY FRAMEWORK AND GUIDELINES
9 PRICING INDEX (PRICE AT B2B END & PRICES AT FOB)
10 PRODUCTION CAPACITY OF KEY MANUFACTURERES
11 BRAND OUTLOOK
11.1 COMPARATIVE BRAND ANALYSIS
11.2 PRODUCT VS BRAND OVERVIEW
12 GLOBAL VANILLA MARKET, BY TYPE, 2022-2031, (USD MILLION) (KILO TONS)
12.1 OVERVIEW
12.2 MADAGASCAR
12.3 MEXICAN
12.4 INDIAN
12.5 INDONESIAN
12.6 TAHITIAN
12.7 TONGA
12.8 PAPUA
12.9 UGANDAN
12.1 OTHERS
13 GLOBAL VANILLA MARKET, BY GRADE, 2022-2031, (USD MILLION)
13.1 OVERVIEW
13.2 GRADE A
13.3 GRADE B
13.4 OTHERS
14 GLOBAL VANILLA MARKET, BY ORIGIN, 2022-2031, (USD MILLION)
14.1 OVERVIEW
14.2 NATURAL
14.3 SYNTHETIC
15 GLOBAL VANILLA MARKET, BY FORM, 2022-2031, (USD MILLION)
15.1 OVERVIEW
15.2 LIQUID
15.3 POWDER
15.4 PASTE
16 GLOBAL VANILLA MARKET, BY END USE, 2022-2031, (USD MILLION)
16.1 OVERVIEW
16.2 FOOD
16.2.1 FOOD, BY TYPE
16.2.1.1. CHOCOLATE & CONFECTIONERY
16.2.1.1.1. CHOCOLATE
16.2.1.1.2. CANDY
16.2.1.1.3. CHEWS
16.2.1.1.4. GUMMIES
16.2.1.1.5. OTHERS
16.2.1.2. BAKERY PRODUCTS
16.2.1.2.1. COOKIES & BISCUITS
16.2.1.2.2. CAKES AND PASTRIES
16.2.1.2.3. DOUGHNUTS
16.2.1.2.4. OTHERS
16.2.1.3. DAIRY BASED PRODUCTS
16.2.1.3.1. ICE CREAM
16.2.1.3.2. YOGHURT
16.2.1.3.3. FLAVOURED MILK
16.2.1.3.4. DESSERTS
16.2.1.3.5. OTHERS
16.2.1.4. PROCESSED FOODS
16.2.1.5. OTHERS
16.2.2 FOOD, BY VANILLA TYPE
16.2.2.1. MADAGASCAR
16.2.2.2. MEXICAN
16.2.2.3. INDIAN
16.2.2.4. INDONESIAN
16.2.2.5. TAHITIAN
16.2.2.6. TONGA
16.2.2.7. PAPUA
16.2.2.8. UGANDAN
16.2.2.9. OTHERS
16.3 BEVERAGES
16.3.1 BEVERAGES, BY TYPE
16.3.1.1. RTD COFFEE
16.3.1.2. FLAVOURED DRINKS
16.3.1.3. NUTRITIONAL DRINKS
16.3.1.4. PLANT BASED BEVERAGES
16.3.1.5. OTHERS
16.3.2 BEVERAGES, BY VANILLA TYPE
16.3.2.1. MADAGASCAR
16.3.2.2. MEXICAN
16.3.2.3. INDIAN
16.3.2.4. INDONESIAN
16.3.2.5. TAHITIAN
16.3.2.6. TONGA
16.3.2.7. PAPUA
16.3.2.8. UGANDAN
16.3.2.9. OTHERS
16.4 PERSONAL CARE PRODUCTS
16.4.1 PERSONAL CARE PRODUCTS, BY TYPE
16.4.1.1. CONDITIONER
16.4.1.2. LOTIONS
16.4.1.3. BALM
16.4.1.4. OTHERS
16.4.2 PERSONAL CARE PRODUCTS, BY VANILLA TYPE
16.4.2.1. MADAGASCAR
16.4.2.2. MEXICAN
16.4.2.3. INDIAN
16.4.2.4. INDONESIAN
16.4.2.5. TAHITIAN
16.4.2.6. TONGA
16.4.2.7. PAPUA
16.4.2.8. UGANDAN
16.4.2.9. OTHERS
16.5 PHARMACEUTICALS INDUSTRY
16.5.1 PHARMACEUTICALS INDUSTRY, BY VANILLA TYPE
16.5.1.1. MADAGASCAR
16.5.1.2. MEXICAN
16.5.1.3. INDIAN
16.5.1.4. INDONESIAN
16.5.1.5. TAHITIAN
16.5.1.6. TONGA
16.5.1.7. PAPUA
16.5.1.8. UGANDAN
16.5.1.9. OTHERS
16.6 HOUSEHOLDS/HOME COOKING
16.6.1 HOME COOKING, BY VANILLA TYPE
16.6.1.1. MADAGASCAR
16.6.1.2. MEXICAN
16.6.1.3. INDIAN
16.6.1.4. INDONESIAN
16.6.1.5. TAHITIAN
16.6.1.6. TONGA
16.6.1.7. PAPUA
16.6.1.8. UGANDAN
16.6.1.9. OTHERS
16.7 OTHERS
16.7.1 OTHERS, BY VANILLA TYPE
16.7.1.1. MADAGASCAR
16.7.1.2. MEXICAN
16.7.1.3. INDIAN
16.7.1.4. INDONESIAN
16.7.1.5. TAHITIAN
16.7.1.6. TONGA
16.7.1.7. PAPUA
16.7.1.8. UGANDAN
16.7.1.9. OTHERS
17 GLOBAL VANILLA MARKET, BY DISTRIBUTION CHANNEL, 2022-2031, (USD MILLION)
17.1 OVERVIEW
17.2 B2B
17.2.1 WHOLESALERS
17.2.2 ONLINE
17.3 B2C
17.3.1 SUPERMARKET
17.3.2 HYPERMARKET
17.3.3 SPECIALITY STORES
17.3.4 RETAIL STORES
17.3.5 ONLINE
17.3.6 OTHERS
18 GLOBAL VANILLA MARKET, COMPANY LANDSCAPE
18.1 COMPANY SHARE ANALYSIS: GLOBAL
18.2 COMPANY SHARE ANALYSIS: NORTH AMERICA
18.3 COMPANY SHARE ANALYSIS: EUROPE
18.4 COMPANY SHARE ANALYSIS: ASIA-PACIFIC
18.5 MERGERS & ACQUISITIONS
18.6 NEW PRODUCT DEVELOPMENT & APPROVALS
18.7 EXPANSIONS & PARTNERSHIP
18.8 REGULATORY CHANGES
19 GLOBAL VANILLA MARKET, BY GEOGRAPHY, 2022-2031, (USD MILLION) (KILO TONS)
19.1 OVERVIEW (ALL SEGMENTATION PROVIDED ABOVE IS REPRESNTED IN THIS CHAPTER BY COUNTRY)
19.2 NORTH AMERICA
19.2.1 U.S.
19.2.2 CANADA
19.2.3 MEXICO
19.3 EUROPE
19.3.1 GERMANY
19.3.2 FRANCE
19.3.3 U.K.
19.3.4 ITALY
19.3.5 SPAIN
19.3.6 RUSSIA
19.3.7 TURKEY
19.3.8 BELGIUM
19.3.9 NETHERLANDS
19.3.10 SWITZERLAND
19.3.11 LUXEMBURG
19.3.12 REST OF EUROPE
19.4 ASIA-PACIFIC
19.4.1 JAPAN
19.4.2 CHINA
19.4.3 SOUTH KOREA
19.4.4 INDIA
19.4.5 NEW ZEALAND
19.4.6 AUSTRALIA
19.4.7 SINGAPORE
19.4.8 MALAYSIA
19.4.9 INDONESIA
19.4.10 THAILAND
19.4.11 PHILIPPINES
19.4.12 REST OF ASIA-PACIFIC
19.5 SOUTH AMERICA
19.5.1 BRAZIL
19.5.2 ARGENTINA
19.5.3 REST OF SOUTH AMERICA
19.6 MIDDLE EAST AND AFRICA
19.6.1 SOUTH AFRICA
19.6.2 EGYPT
19.6.3 SAUDI ARABIA
19.6.4 UAE
19.6.5 ISRAEL
19.6.6 REST OF MIDDLE EAST AND AFRICA
20 SWOT AND DBMR ANALYSIS, GLOBAL VANILLA MARKET
21 GLOBAL VANILLA MARKET, COMPANY PROFILES
21.1 DAINTREE VANILLA & SPICE
21.1.1 COMPANY OVERVIEW
21.1.2 REVENUE ANALYSIS
21.1.3 PRODUCT PORTFOLIO
21.1.4 GEOGRAPHIC PRESENCE
21.1.5 RECENT DEVELOPMENTS
21.2 FAROOQI VANILLA BEANS
21.2.1 COMPANY OVERVIEW
21.2.2 REVENUE ANALYSIS
21.2.3 PRODUCT PORTFOLIO
21.2.4 GEOGRAPHIC PRESENCE
21.2.5 RECENT DEVELOPMENTS
21.3 VENUI VANILLA CO LTD
21.3.1 COMPANY OVERVIEW
21.3.2 REVENUE ANALYSIS
21.3.3 PRODUCT PORTFOLIO
21.3.4 GEOGRAPHIC PRESENCE
21.3.5 RECENT DEVELOPMENTS
21.4 HEILALA VANILLA USA
21.4.1 COMPANY OVERVIEW
21.4.2 REVENUE ANALYSIS
21.4.3 PRODUCT PORTFOLIO
21.4.4 GEOGRAPHIC PRESENCE
21.4.5 RECENT DEVELOPMENTS
21.5 APEX FLAVORS, INC
21.5.1 COMPANY OVERVIEW
21.5.2 REVENUE ANALYSIS
21.5.3 PRODUCT PORTFOLIO
21.5.4 GEOGRAPHIC PRESENCE
21.5.5 RECENT DEVELOPMENTS
21.6 TAKASAGO INTERNATIONAL CORPORATION
21.6.1 COMPANY OVERVIEW
21.6.2 REVENUE ANALYSIS
21.6.3 PRODUCT PORTFOLIO
21.6.4 GEOGRAPHIC PRESENCE
21.6.5 RECENT DEVELOPMENTS
21.7 THARAKAN AND COMPANY
21.7.1 COMPANY OVERVIEW
21.7.2 REVENUE ANALYSIS
21.7.3 PRODUCT PORTFOLIO
21.7.4 GEOGRAPHIC PRESENCE
21.7.5 RECENT DEVELOPMENTS
21.8 ADM
21.8.1 COMPANY OVERVIEW
21.8.2 REVENUE ANALYSIS
21.8.3 PRODUCT PORTFOLIO
21.8.4 GEOGRAPHIC PRESENCE
21.8.5 RECENT DEVELOPMENTS
21.9 SYNERGY FLAVORS, INC.
21.9.1 COMPANY OVERVIEW
21.9.2 REVENUE ANALYSIS
21.9.3 PRODUCT PORTFOLIO
21.9.4 GEOGRAPHIC PRESENCE
21.9.5 RECENT DEVELOPMENTS
21.1 LOCHHEAD MANUFACTURING COMPANY
21.10.1 COMPANY OVERVIEW
21.10.2 REVENUE ANALYSIS
21.10.3 PRODUCT PORTFOLIO
21.10.4 GEOGRAPHIC PRESENCE
21.10.5 RECENT DEVELOPMENTS
21.11 LEMUR INTERNATIONAL, INC
21.11.1 COMPANY OVERVIEW
21.11.2 REVENUE ANALYSIS
21.11.3 PRODUCT PORTFOLIO
21.11.4 GEOGRAPHIC PRESENCE
21.11.5 RECENT DEVELOPMENTS
21.12 NATIVE VANILLA
21.12.1 COMPANY OVERVIEW
21.12.2 REVENUE ANALYSIS
21.12.3 PRODUCT PORTFOLIO
21.12.4 GEOGRAPHIC PRESENCE
21.12.5 RECENT DEVELOPMENTS
21.13 MADAGASCAR VANILLA COMPANY LLC
21.13.1 COMPANY OVERVIEW
21.13.2 REVENUE ANALYSIS
21.13.3 PRODUCT PORTFOLIO
21.13.4 GEOGRAPHIC PRESENCE
21.13.5 RECENT DEVELOPMENTS
21.14 SAMBIRANO AROMATIC
21.14.1 COMPANY OVERVIEW
21.14.2 REVENUE ANALYSIS
21.14.3 PRODUCT PORTFOLIO
21.14.4 GEOGRAPHIC PRESENCE
21.14.5 RECENT DEVELOPMENTS
21.15 VANILLAPURA
21.15.1 COMPANY OVERVIEW
21.15.2 REVENUE ANALYSIS
21.15.3 PRODUCT PORTFOLIO
21.15.4 GEOGRAPHIC PRESENCE
21.15.5 RECENT DEVELOPMENTS
21.16 NIELSEN-MASSEY VANILLAS INC
21.16.1 COMPANY OVERVIEW
21.16.2 REVENUE ANALYSIS
21.16.3 PRODUCT PORTFOLIO
21.16.4 GEOGRAPHIC PRESENCE
21.16.5 RECENT DEVELOPMENTS
21.17 BOSTON VANILLA BEAN COMPANY
21.17.1 COMPANY OVERVIEW
21.17.2 REVENUE ANALYSIS
21.17.3 PRODUCT PORTFOLIO
21.17.4 GEOGRAPHIC PRESENCE
21.17.5 RECENT DEVELOPMENTS
21.18 KERRY GROUP
21.18.1 COMPANY OVERVIEW
21.18.2 REVENUE ANALYSIS
21.18.3 PRODUCT PORTFOLIO
21.18.4 GEOGRAPHIC PRESENCE
21.18.5 RECENT DEVELOPMENTS
21.19 IFFINC
21.19.1 COMPANY OVERVIEW
21.19.2 REVENUE ANALYSIS
21.19.3 PRODUCT PORTFOLIO
21.19.4 GEOGRAPHIC PRESENCE
21.19.5 RECENT DEVELOPMENTS
21.2 PROVA
21.20.1 COMPANY OVERVIEW
21.20.2 REVENUE ANALYSIS
21.20.3 PRODUCT PORTFOLIO
21.20.4 GEOGRAPHIC PRESENCE
21.20.5 RECENT DEVELOPMENTS
21.21 MANE
21.21.1 COMPANY OVERVIEW
21.21.2 REVENUE ANALYSIS
21.21.3 PRODUCT PORTFOLIO
21.21.4 GEOGRAPHIC PRESENCE
21.21.5 RECENT DEVELOPMENTS
21.22 MCCORMICK & COMPANY, INC.
21.22.1 COMPANY OVERVIEW
21.22.2 REVENUE ANALYSIS
21.22.3 PRODUCT PORTFOLIO
21.22.4 GEOGRAPHIC PRESENCE
21.22.5 RECENT DEVELOPMENTS
21.23 VNLLA EXTRACT CO.
21.23.1 COMPANY OVERVIEW
21.23.2 REVENUE ANALYSIS
21.23.3 PRODUCT PORTFOLIO
21.23.4 GEOGRAPHIC PRESENCE
21.23.5 RECENT DEVELOPMENTS
21.24 SHANK'S EXTRACTS, INC
21.24.1 COMPANY OVERVIEW
21.24.2 REVENUE ANALYSIS
21.24.3 PRODUCT PORTFOLIO
21.24.4 GEOGRAPHIC PRESENCE
21.24.5 RECENT DEVELOPMENTS
21.25 COOK FLAVORING COMPANY
21.25.1 COMPANY OVERVIEW
21.25.2 REVENUE ANALYSIS
21.25.3 PRODUCT PORTFOLIO
21.25.4 GEOGRAPHIC PRESENCE
21.25.5 RECENT DEVELOPMENTS
21.26 VANILLA BEAN PROJECT
21.26.1 COMPANY OVERVIEW
21.26.2 REVENUE ANALYSIS
21.26.3 PRODUCT PORTFOLIO
21.26.4 GEOGRAPHIC PRESENCE
21.26.5 RECENT DEVELOPMENTS
21.27 INDIAN VANILLA ENTERPRISE
21.27.1 COMPANY OVERVIEW
21.27.2 REVENUE ANALYSIS
21.27.3 PRODUCT PORTFOLIO
21.27.4 GEOGRAPHIC PRESENCE
21.27.5 RECENT DEVELOPMENTS
21.28 ORIGIN VANILLA
21.28.1 COMPANY OVERVIEW
21.28.2 REVENUE ANALYSIS
21.28.3 PRODUCT PORTFOLIO
21.28.4 GEOGRAPHIC PRESENCE
21.28.5 RECENT DEVELOPMENTS
21.29 FRIEDA'S INC
21.29.1 COMPANY OVERVIEW
21.29.2 REVENUE ANALYSIS
21.29.3 PRODUCT PORTFOLIO
21.29.4 GEOGRAPHIC PRESENCE
21.29.5 RECENT DEVELOPMENTS
21.3 SYMRISE PVT LTD
21.30.1 COMPANY OVERVIEW
21.30.2 REVENUE ANALYSIS
21.30.3 PRODUCT PORTFOLIO
21.30.4 GEOGRAPHIC PRESENCE
21.30.5 RECENT DEVELOPMENTS
NOTE: THE COMPANIES PROFILED IS NOT EXHAUSTIVE LIST AND IS AS PER OUR PREVIOUS CLIENT REQUIREMENT. WE PROFILE MORE THAN 100 COMPANIES IN OUR STUDY AND HENCE THE LIST OF COMPANIES CAN BE MODIFIED OR REPLACED ON REQUEST
22 RELATED REPORTS
23 CONCLUSION
24 QUESTIONNAIRE
25 ABOUT DATA BRIDGE MARKET RESEARCH
Global Vanilla Market, Supply Chain Analysis and Ecosystem Framework
To support market growth and help clients navigate the impact of geopolitical shifts, DBMR has integrated in-depth supply chain analysis into its Global Vanilla Market research reports. This addition empowers clients to respond effectively to global changes affecting their industries. The supply chain analysis section includes detailed insights such as Global Vanilla Market consumption and production by country, price trend analysis, the impact of tariffs and geopolitical developments, and import and export trends by country and HSN code. It also highlights major suppliers with data on production capacity and company profiles, as well as key importers and exporters. In addition to research, DBMR offers specialized supply chain consulting services backed by over a decade of experience, providing solutions like supplier discovery, supplier risk assessment, price trend analysis, impact evaluation of inflation and trade route changes, and comprehensive market trend analysis.
Data collection and base year analysis are done using data collection modules with large sample sizes. The stage includes obtaining market information or related data through various sources and strategies. It includes examining and planning all the data acquired from the past in advance. It likewise envelops the examination of information inconsistencies seen across different information sources. The market data is analysed and estimated using market statistical and coherent models. Also, market share analysis and key trend analysis are the major success factors in the market report. To know more, please request an analyst call or drop down your inquiry.
The key research methodology used by DBMR research team is data triangulation which involves data mining, analysis of the impact of data variables on the market and primary (industry expert) validation. Data models include Vendor Positioning Grid, Market Time Line Analysis, Market Overview and Guide, Company Positioning Grid, Patent Analysis, Pricing Analysis, Company Market Share Analysis, Standards of Measurement, Global versus Regional and Vendor Share Analysis. To know more about the research methodology, drop in an inquiry to speak to our industry experts.
Data Bridge Market Research is a leader in advanced formative research. We take pride in servicing our existing and new customers with data and analysis that match and suits their goal. The report can be customized to include price trend analysis of target brands understanding the market for additional countries (ask for the list of countries), clinical trial results data, literature review, refurbished market and product base analysis. Market analysis of target competitors can be analyzed from technology-based analysis to market portfolio strategies. We can add as many competitors that you require data about in the format and data style you are looking for. Our team of analysts can also provide you data in crude raw excel files pivot tables (Fact book) or can assist you in creating presentations from the data sets available in the report.


