
Global Virtual Sensor Market
Market Size in USD Billion
 USD
1.34 Billion
USD
11.94 Billion
2025
2033
USD
1.34 Billion
USD
11.94 Billion
2025
2033
| 2026 - 2033 | |
| USD 1.34 Billion | |
| USD 11.94 Billion | |
| % | |
|
Virtual Sensor Market Overview
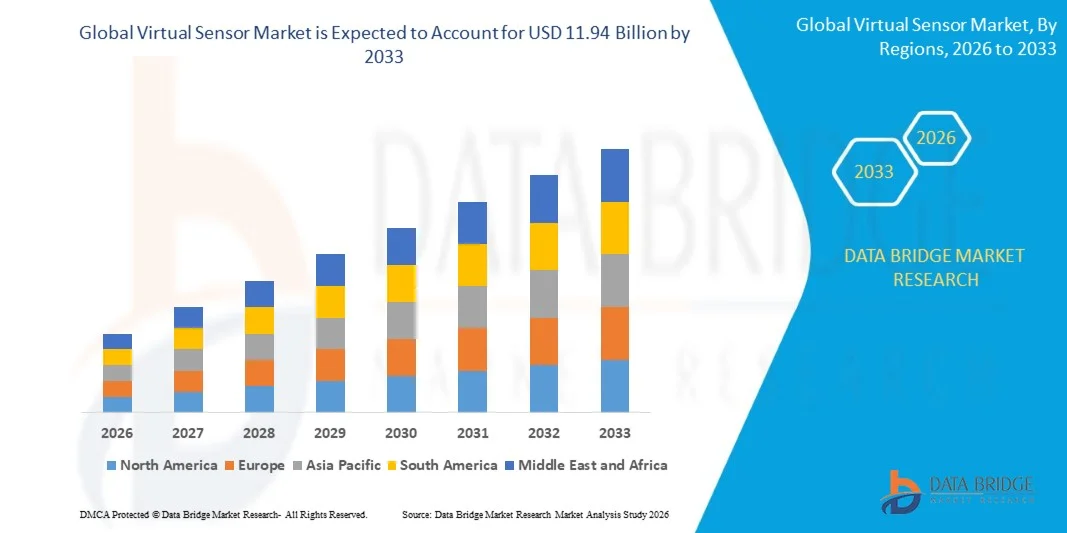
The Virtual Sensor Market was valued at USD 1.34 billion in 2025 and is projected to reach USD 11.94 billion by 2033, growing at a CAGR of 31.40% from 2026 to 2033. The market is experiencing rapid expansion driven by increasing adoption of AI and machine learning algorithms, rising demand for cost-efficient sensing alternatives, and growing integration of virtual sensors in predictive maintenance, industrial automation, and connected vehicle ecosystems. Advancements in edge computing, cloud analytics, and digital twin technologies are further accelerating deployment across complex industrial environments.
The increasing need for real-time monitoring without extensive physical sensor infrastructure, combined with growing emphasis on operational efficiency and data-driven decision-making, is compelling industries to adopt virtual sensing technologies. These solutions are increasingly being used to estimate physical parameters such as temperature, pressure, and flow in real time, reducing hardware dependency while improving system flexibility and scalability across automotive, aerospace, energy, and manufacturing sectors.
Key Market Trends & Insights
- North America dominated the virtual sensor market with the largest revenue share in 2025, supported by strong adoption of advanced analytics platforms, widespread deployment of Industrial Internet of Things (IIoT) systems, and early integration of machine learning-based monitoring across automotive, aerospace, and energy sectors.
- Asia-Pacific is expected to be the fastest-growing region, recording a CAGR of from 2026 to 2033. Growth is driven by rapid industrial digitalization, expanding smart manufacturing ecosystems, increasing government support for AI and IoT deployment, and rising adoption of predictive maintenance solutions across China, India, and Japan.
- The Solutions segment held the largest market revenue share of approximately 68.4% in 2025 driven by widespread adoption of AI-based modelling platforms, digital twin integration, and predictive analytics software across automotive, industrial automation, and energy systems. Virtual sensing solutions are increasingly used for real-time condition monitoring, fault detection, and performance optimization, particularly in connected manufacturing and smart mobility ecosystems.
- The Services segment is projected to register the fastest growth at a CAGR of 33.2% from 2026 to 2033, supported by rising demand for consulting, system integration, calibration, and lifecycle maintenance services. Growing complexity of industrial IoT architectures and increasing reliance on cloud-based analytics platforms are further accelerating service adoption across enterprises transitioning to data-driven operations.
- The Cloud segment held the largest revenue share of approximately 71.6% in 2025 due to increasing adoption of scalable analytics platforms, real-time data processing capabilities, and cost-efficient subscription-based models. Cloud deployment is particularly dominant in automotive telematics, smart manufacturing, and energy management systems where continuous data streaming and remote accessibility are critical.
- The On-Premises segment is expected to grow steadily, driven by stringent data security requirements and latency-sensitive applications in aerospace, defense, and critical industrial operations. Organizations handling proprietary operational data continue to prefer localized infrastructure for enhanced control and compliance adherence.
- The Automotive segment held the largest market revenue share of approximately 22.9% in 2025 driven by increasing integration of virtual sensors in electric vehicles for battery management, predictive maintenance, and autonomous driving systems.
- The Aerospace And Defense segment is projected to register the fastest growth at a CAGR of 34.6% from 2026 to 2033, supported by rising adoption of digital twin-based monitoring systems, mission-critical simulation environments, and lightweight sensing architectures for aircraft and defense platforms. Increasing use of virtual sensors for structural health monitoring and predictive diagnostics in next-generation aircraft such as UAVs is further strengthening segment expansion.
Market Size & Forecast
- Global Market Value (2025): USD 1.34 Billion
- Expected Market Value (2033): USD 11.94 Billion
- Forecast CAGR (2026–2033): 31.40%
- Leading Region in 2025: North America
- Fastest Growing Region: Asia-Pacific
Report Scope and Virtual Sensor Market Segmentation
|
Attributes |
Virtual Sensor Key Market Insights |
|
Segments Covered |
· By Component: Solutions and Services · By Deployment: Cloud and On-Premises · By Verticals: Oil and Gas, Automotive, Transportation, Healthcare, Process Industry, Electrical, Electronics, Consumer Technology, Healthcare, Chemical, Aerospace and Defense, and Others |
|
Countries Covered |
North America · U.S. · Canada · Mexico Europe · Germany · France · U.K. · Netherlands · Switzerland · Belgium · Russia · Italy · Spain · Turkey · Rest of Europe Asia-Pacific · China · Japan · India · South Korea · Singapore · Malaysia · Australia · Thailand · Indonesia · Philippines · Rest of Asia-Pacific Middle East and Africa · Saudi Arabia · U.A.E. · South Africa · Egypt · Israel · Rest of Middle East and Africa South America · Brazil · Argentina · Rest of South America |
|
Key Market Players |
• General Electric (U.S.) |
|
Market Opportunities |
• Expansion Of Digital Twin And Predictive Modeling Systems • Rising Adoption Of AI-Driven Industrial Automation Solutions |
|
Value Added Data Infosets |
In addition to the insights on market scenarios such as market value, growth rate, segmentation, geographical coverage, and major players, the market reports curated by the Data Bridge Market Research also include in-depth expert analysis, geographically represented company-wise production and capacity, network layouts of distributors and partners, detailed and updated price trend analysis and deficit analysis of supply chain and demand. |
Virtual Sensor Market Trends
Trend: Growth In AI-Driven Virtualization And Digital Twin-Based Sensing Systems
Increasing demand for cost-efficient, scalable, and highly accurate sensing solutions is driving rapid adoption of virtual sensors across automotive, industrial, aerospace, and energy sectors. Traditional physical sensors require extensive installation, calibration, and maintenance, whereas virtual sensors leverage AI algorithms, machine learning models, and real-time data analytics to estimate physical parameters such as temperature, pressure, and flow without additional hardware deployment. Growing integration of edge computing and cloud-based platforms is further enhancing the speed, accuracy, and scalability of virtual sensing systems.
In modern automotive systems, manufacturers are increasingly integrating virtual sensor technologies, For instance for battery health estimation, engine performance monitoring, and emissions prediction, enabling real-time diagnostics and improving vehicle efficiency. In industrial environments, virtual sensors are being used in predictive maintenance systems to estimate equipment wear and detect anomalies, reducing unplanned downtime and maintenance costs. Energy and utility companies are also deploying virtual sensing models to monitor grid stability and optimize renewable energy output without relying heavily on physical sensor networks.
The rapid expansion of Industry 4.0 ecosystems, smart factories, and connected infrastructure is also increasing demand for intelligent virtual sensing systems capable of processing large-scale real-time data streams. In addition, aerospace and defense sectors are adopting virtual sensors for flight parameter estimation and system redundancy, improving operational safety and reliability in mission-critical environments. Growing validation through industrial AI deployments in 2025 across Europe and North America, including digital twin-enabled manufacturing systems, has demonstrated predictive maintenance accuracy improvements of nearly 15–22% and significant reductions in sensor hardware dependency.
Virtual Sensor Market Dynamics
Key Market Driver: Rising Adoption Of AI-Based Predictive Analytics And Cost-Effective Sensing Solutions
Industries worldwide are increasingly focused on reducing hardware dependency while improving operational efficiency, which is significantly driving demand for virtual sensor technologies. The integration of AI, machine learning, and real-time data processing enables accurate estimation of physical parameters without requiring extensive physical sensor installations.
Automotive and industrial manufacturers are increasingly deploying virtual sensors for performance monitoring and predictive maintenance, For instance in smart manufacturing plants for equipment health prediction and process optimization, reducing operational costs and improving production efficiency. In energy systems, virtual sensing is being used to monitor grid performance and renewable energy generation in real time, improving system reliability and efficiency.
Similarly, large-scale cloud and edge computing infrastructures are enabling real-time virtual sensing applications across distributed networks. Industrial deployments in the U.S. and Germany during 2024 integrating AI-based virtual sensor platforms in manufacturing operations demonstrated efficiency improvements of around 10–18% through reduced sensor deployment costs and improved predictive accuracy.
Key Restraint/Challenge: Model Accuracy Limitations And High Dependence On Data Quality
Despite strong adoption, virtual sensor systems face challenges related to model accuracy, data dependency, and calibration complexity. The performance of virtual sensors heavily depends on the quality, volume, and consistency of input data, making them vulnerable to inaccuracies in noisy or incomplete datasets.
In addition, developing and maintaining high-precision AI models requires significant computational resources and domain expertise, which increases implementation complexity for small and mid-sized enterprises. Integration with legacy industrial systems also remains a barrier in several regions due to limited digital infrastructure readiness.
Industry assessments indicate that while virtual sensors can significantly reduce hardware costs, accuracy deviations of 5–12% may still occur in complex dynamic environments, particularly where real-time data inputs are inconsistent or insufficient for model training.
Key Market Opportunity: Expansion Of Digital Twin Ecosystems And Autonomous Industrial Systems
The growing adoption of digital twin technology, autonomous systems, and smart infrastructure is creating substantial opportunities for virtual sensor deployment. These systems rely on real-time data simulation and predictive modeling to optimize performance, making virtual sensors a critical component of next-generation industrial ecosystems.
Automotive companies are increasingly integrating virtual sensing into autonomous driving platforms, For instance for real-time vehicle dynamics estimation, battery performance optimization, and predictive safety systems, improving decision-making accuracy and system responsiveness. In smart cities, virtual sensors are being used for traffic flow modeling, environmental monitoring, and infrastructure management without requiring extensive physical sensor networks.
In addition, advancements in AI computing, edge intelligence, and cloud-native analytics are improving virtual sensor performance and scalability, opening new opportunities across aerospace, defense, and industrial automation markets in Asia-Pacific and North America. Large-scale digital twin implementations conducted in 2025 across South Korea and the U.S. demonstrated operational efficiency improvements of around 18–25% in manufacturing systems through integrated virtual sensing and real-time simulation frameworks.
Virtual Sensor Market Scope
The Virtual Sensor Market is segmented on the basis of component, deployment, and verticals.
- By Component
On the basis of component, the virtual sensor market is segmented into Solutions and Services. The Solutions segment held the largest market revenue share of approximately 68.4% in 2025 driven by widespread adoption of AI-based modelling platforms, digital twin integration, and predictive analytics software across automotive, industrial automation, and energy systems. Virtual sensing solutions are increasingly used for real-time condition monitoring, fault detection, and performance optimization, particularly in connected manufacturing and smart mobility ecosystems.
The Services segment is projected to register the fastest growth at a CAGR of 33.2% from 2026 to 2033, supported by rising demand for consulting, system integration, calibration, and lifecycle maintenance services. Growing complexity of industrial IoT architectures and increasing reliance on cloud-based analytics platforms are further accelerating service adoption across enterprises transitioning to data-driven operations.
- By Deployment
On the basis of deployment, the market is segmented into Cloud and On-Premises. The Cloud segment held the largest revenue share of approximately 71.6% in 2025 due to increasing adoption of scalable analytics platforms, real-time data processing capabilities, and cost-efficient subscription-based models. Cloud deployment is particularly dominant in automotive telematics, smart manufacturing, and energy management systems where continuous data streaming and remote accessibility are critical.
The On-Premises segment is expected to grow steadily, driven by stringent data security requirements and latency-sensitive applications in aerospace, defense, and critical industrial operations. Organizations handling proprietary operational data continue to prefer localized infrastructure for enhanced control and compliance adherence.
- By Verticals
On the basis of verticals, the market is segmented into Oil And Gas, Automotive, Transportation, Healthcare, Process Industry, Electrical, Electronics, Consumer Technology, Chemical, Aerospace And Defense, and Others. The Automotive segment held the largest market revenue share of approximately 22.9% in 2025 driven by increasing integration of virtual sensors in electric vehicles for battery management, predictive maintenance, and autonomous driving systems.
The Aerospace And Defense segment is projected to register the fastest growth at a CAGR of 34.6% from 2026 to 2033, supported by rising adoption of digital twin-based monitoring systems, mission-critical simulation environments, and lightweight sensing architectures for aircraft and defense platforms. Increasing use of virtual sensors for structural health monitoring and predictive diagnostics in next-generation aircraft such as UAVs is further strengthening segment expansion.
Virtual Sensor Market Regional Analysis
North America Virtual Sensor Market Insight
North America dominated the virtual sensor market with the largest revenue share of approximately 38.7% in 2025, supported by rapid adoption of AI-driven analytics, strong penetration of Industrial Internet of Things (IIoT) platforms, and increasing deployment of digital twin technologies across automotive, aerospace, and energy sectors. Organizations in the region are increasingly shifting toward software-defined sensing systems to reduce dependency on physical sensors and improve real-time decision-making accuracy. The presence of advanced cloud infrastructure, high R&D investment, and early adoption of autonomous systems further strengthens market growth across industrial and commercial applications.
U.S. Virtual Sensor Market Insight
The U.S. virtual sensor market captured the largest revenue share in 2025 within North America, driven by strong integration of machine learning models into predictive maintenance systems and increasing use of virtual sensing in electric vehicles and smart manufacturing facilities. Enterprises are prioritizing real-time performance optimization and cost reduction through simulation-based monitoring solutions. The expansion of autonomous vehicle testing programs and smart grid modernization initiatives is further accelerating demand for virtual sensor technologies across industrial and transportation ecosystems.
Europe Virtual Sensor Market Insight
The Europe virtual sensor market is expected to witness the fastest growth rate from 2026 to 2033, primarily driven by strict industrial efficiency regulations and increasing adoption of Industry 4.0 frameworks. Rising focus on carbon neutrality and energy optimization is encouraging manufacturers to deploy virtual sensing solutions for predictive analytics and equipment monitoring. Growth is also supported by expanding applications in aerospace, renewable energy systems, and advanced healthcare monitoring platforms across the region.
U.K. Virtual Sensor Market Insight
The U.K. virtual sensor market is expected to witness strong growth from 2026 to 2033, driven by increasing adoption of cloud-based industrial analytics and growing investment in smart infrastructure projects. Businesses are leveraging virtual sensors for predictive maintenance and operational efficiency in sectors such as transportation, energy, and manufacturing. The expansion of digital transformation initiatives across public and private sectors is further supporting market adoption.
Germany Virtual Sensor Market Insight
The Germany virtual sensor market is expected to witness strong growth from 2026 to 2033, supported by the country’s strong industrial automation base and emphasis on precision engineering and sustainability. Manufacturers are increasingly deploying virtual sensors for machine health monitoring and process optimization in automotive production and heavy industries. Integration of digital twin systems in factory operations is also enhancing demand for advanced virtual sensing solutions aligned with Germany’s Industry 4.0 strategy.
Asia-Pacific Virtual Sensor Market Insight
The Asia-Pacific virtual sensor market is expected to witness the fastest growth rate from 2026 to 2033, supported by rapid industrialization, expanding smart manufacturing ecosystems, and increasing adoption of AI and IoT technologies in China, Japan, and India. The region is experiencing strong deployment of virtual sensors in automotive, electronics, and energy sectors to improve efficiency and reduce operational costs. Government-led digital transformation initiatives and growing investments in smart city infrastructure are further accelerating market expansion.
Japan Virtual Sensor Market Insight
The Japan virtual sensor market is expected to witness strong growth from 2026 to 2033 due to high adoption of robotics, industrial automation, and advanced manufacturing systems. Japanese industries are increasingly using virtual sensors for predictive maintenance, quality control, and system optimization in automotive and electronics production. Strong focus on precision, reliability, and energy efficiency is driving adoption across industrial and smart infrastructure applications.
China Virtual Sensor Market Insight
The China virtual sensor market accounted for the largest market revenue share in Asia-Pacific in 2025, attributed to large-scale industrial digitization, rapid expansion of smart factories, and strong government support for AI and IoT integration. Virtual sensors are widely used in manufacturing automation, transportation systems, and energy management platforms. The country’s leadership in smart city development and industrial AI deployment continues to strengthen demand for advanced virtual sensing technologies across multiple sectors.
Virtual Sensor Market Share
The Virtual Sensor industry is primarily led by well-established companies, including:
• General Electric (U.S.)
• Cisco Systems, Inc. (U.S.)
• Honeywell International Inc. (U.S.)
• Siemens (Germany)
• Schneider Electric (France)
• Elliptic Laboratories A/S (Norway)
• Algorithmica Technologies GmbH (Germany)
• EXPUTEC (Germany)
• TACTILE MOBILITY (Israel)
• Cleveland Electric Laboratories (U.S.)
• BioComp Systems, Inc. (U.S.)
• Andata Development Technology GmbH (Austria)
• AVEVA Group plc (U.K.)
• Aspen Technology, Inc. (U.S.)
• OSIsoft, LLC (U.S.)
• Modelway S.r.l. (Italy)
• LMI Technologies Inc. (Canada)
Latest Developments in Virtual Sensor Market
- In November 2025, Siemens (DE) announced the launch of a new virtual sensor platform integrated with machine learning algorithms to enable real-time industrial data analytics. This development is expected to enhance predictive maintenance, improve operational efficiency, and strengthen Siemens’ position in smart manufacturing ecosystems. The innovation is likely to accelerate adoption of AI-enabled virtual sensing across heavy industries, setting new benchmarks for industrial automation solutions.
- In October 2025, Honeywell (US) expanded its collaboration with a leading cloud service provider to strengthen its virtual sensor capabilities for smart city applications. The initiative is designed to enhance real-time data processing and improve urban infrastructure monitoring efficiency. This development is expected to support better traffic management, energy optimization, and sustainable city planning, thereby reinforcing Honeywell’s presence in the digital urban solutions market.
- In September 2025, General Electric (US) introduced a new suite of virtual sensors tailored for the energy sector, focusing on predictive maintenance and operational optimization. The solution aims to improve equipment reliability and reduce downtime in power generation and industrial energy systems. This advancement is expected to accelerate the transition toward data-driven energy management and strengthen GE’s role in supporting cleaner and more efficient energy operations.
- In November 2024, Elliptic Labs launched its AI software platform integrated into Lenovo’s ThinkPad X1 Carbon Aura Edition laptops, introducing Smart Share and AI Virtual Human Presence features. This development enhances device-to-device connectivity and user interaction efficiency by enabling seamless data transfer and intelligent proximity detection. The innovation is expected to improve user experience and expand adoption of AI-powered sensing solutions in consumer electronics.
- In November 2024, Elliptic Labs deployed its AI Virtual Proximity Sensor INNER BEAUTY in the Redmi Note 14 series, expanding its integration to over 500 million devices globally. The technology automatically detects user proximity during calls and adjusts screen behavior to improve usability and power efficiency. This advancement is expected to strengthen smartphone energy optimization capabilities and further drive adoption of virtual sensing technologies in mobile devices.
SKU-

- Interactive Data Analysis Dashboard
- Company Analysis Dashboard for high growth potential opportunities
- Research Analyst Access for customization & queries
- Competitor Analysis with Interactive dashboard
- Latest News, Updates & Trend analysis
- Harness the Power of Benchmark Analysis for Comprehensive Competitor Tracking
Global Virtual Sensor Market, Supply Chain Analysis and Ecosystem Framework
To support market growth and help clients navigate the impact of geopolitical shifts, DBMR has integrated in-depth supply chain analysis into its Global Virtual Sensor Market research reports. This addition empowers clients to respond effectively to global changes affecting their industries. The supply chain analysis section includes detailed insights such as Global Virtual Sensor Market consumption and production by country, price trend analysis, the impact of tariffs and geopolitical developments, and import and export trends by country and HSN code. It also highlights major suppliers with data on production capacity and company profiles, as well as key importers and exporters. In addition to research, DBMR offers specialized supply chain consulting services backed by over a decade of experience, providing solutions like supplier discovery, supplier risk assessment, price trend analysis, impact evaluation of inflation and trade route changes, and comprehensive market trend analysis.
Data collection and base year analysis are done using data collection modules with large sample sizes. The stage includes obtaining market information or related data through various sources and strategies. It includes examining and planning all the data acquired from the past in advance. It likewise envelops the examination of information inconsistencies seen across different information sources. The market data is analysed and estimated using market statistical and coherent models. Also, market share analysis and key trend analysis are the major success factors in the market report. To know more, please request an analyst call or drop down your inquiry.
The key research methodology used by DBMR research team is data triangulation which involves data mining, analysis of the impact of data variables on the market and primary (industry expert) validation. Data models include Vendor Positioning Grid, Market Time Line Analysis, Market Overview and Guide, Company Positioning Grid, Patent Analysis, Pricing Analysis, Company Market Share Analysis, Standards of Measurement, Global versus Regional and Vendor Share Analysis. To know more about the research methodology, drop in an inquiry to speak to our industry experts.
Data Bridge Market Research is a leader in advanced formative research. We take pride in servicing our existing and new customers with data and analysis that match and suits their goal. The report can be customized to include price trend analysis of target brands understanding the market for additional countries (ask for the list of countries), clinical trial results data, literature review, refurbished market and product base analysis. Market analysis of target competitors can be analyzed from technology-based analysis to market portfolio strategies. We can add as many competitors that you require data about in the format and data style you are looking for. Our team of analysts can also provide you data in crude raw excel files pivot tables (Fact book) or can assist you in creating presentations from the data sets available in the report.


