
Global Vitiligo Market
Market Size in USD Billion
 USD
1.43 Billion
USD
2.33 Billion
2025
2033
USD
1.43 Billion
USD
2.33 Billion
2025
2033
| 2026 - 2033 | |
| USD 1.43 Billion | |
| USD 2.33 Billion | |
| % | |
|
Vitiligo Market Size
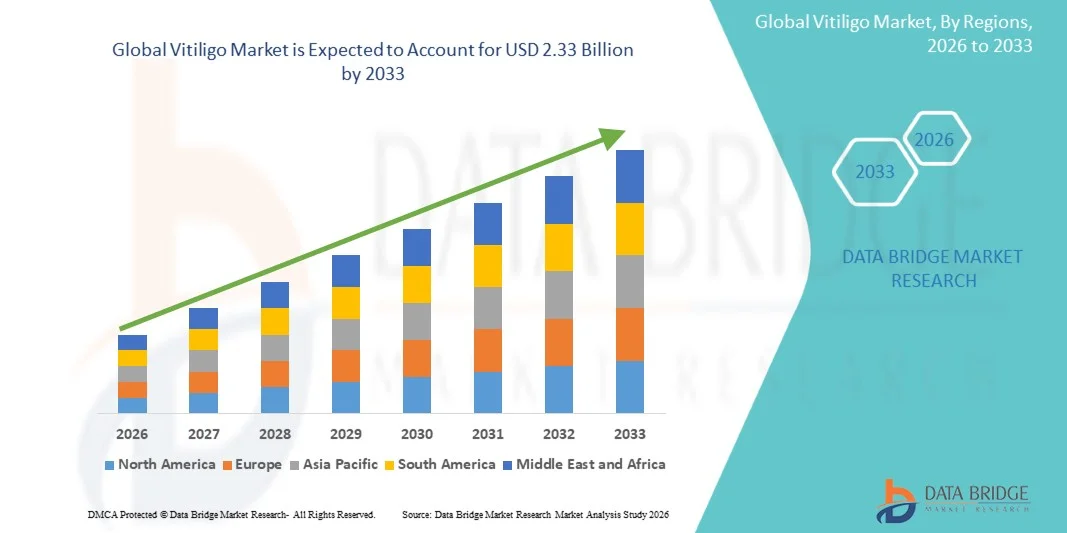
- The global Vitiligo market size was valued at USD 1.43 billion in 2025 and is expected to reach USD 2.33 billion by 2033, at a CAGR of 6.30% during the forecast period
- The market growth is largely fueled by the rising prevalence of vitiligo globally, increasing awareness regarding skin pigmentation disorders, and continuous advancements in dermatological treatment options such as phototherapy, topical immunomodulators, and JAK inhibitors, leading to improved disease management outcomes
- Furthermore, growing patient demand for effective long-term repigmentation therapies, increasing focus on cosmetic and psychological well-being, and expanding access to specialized dermatology care are establishing Vitiligo solutions as an important segment of modern dermatological treatment. These converging factors are accelerating the uptake of Vitiligo solutions, thereby significantly boosting the industry's growth
Vitiligo Market Analysis
- Vitiligo treatments, including topical corticosteroids, calcineurin inhibitors, phototherapy (NBUVB), depigmentation therapy, and emerging JAK inhibitor-based treatments, are increasingly vital components of modern dermatology due to their role in managing pigmentation loss, improving skin repigmentation, and enhancing patient quality of life
- The escalating demand for Vitiligo treatments is primarily fueled by rising global prevalence of autoimmune skin disorders, increasing awareness about cosmetic and psychological impacts of vitiligo, and continuous advancements in targeted dermatological therapies and light-based treatment technologies
- North America dominated the vitiligo market with the largest revenue share of approximately 38.6% in 2025, characterized by advanced dermatology care infrastructure, strong adoption of innovative therapies, high patient awareness, and significant presence of leading pharmaceutical and dermatology companies, particularly in the U.S.
- Asia-Pacific is expected to be the fastest growing region in the vitiligo market during the forecast period due to rising patient population, increasing healthcare expenditure, improving access to dermatological treatments, growing awareness campaigns, and expanding specialty dermatology clinics across India, China, and Southeast Asia
- The Non-Segmental Vitiligo segment dominated the largest market revenue share of 72.4% in 2025, driven by its higher global prevalence and chronic progressive nature
Report Scope and Vitiligo Market Segmentation
|
Attributes |
Vitiligo Key Market Insights |
|
Segments Covered |
|
|
Countries Covered |
North America · U.S. · Canada · Mexico Europe · Germany · France · U.K. · Netherlands · Switzerland · Belgium · Russia · Italy · Spain · Turkey · Rest of Europe Asia-Pacific · China · Japan · India · South Korea · Singapore · Malaysia · Australia · Thailand · Indonesia · Philippines · Rest of Asia-Pacific Middle East and Africa · Saudi Arabia · U.A.E. · South Africa · Egypt · Israel · Rest of Middle East and Africa South America · Brazil · Argentina · Rest of South America |
|
Key Market Players |
· AbbVie Inc. (U.S.) · Pfizer Inc. (U.S.) · Johnson & Johnson (U.S.) · Novartis AG (Switzerland) · Eli Lilly and Company (U.S.) · Bristol-Myers Squibb Company (U.S.) · Merck & Co., Inc. (U.S.) · Incyte Corporation (U.S.) · Sun Pharmaceutical Industries Ltd. (India) · Dr. Reddy’s Laboratories Ltd. (India) · Cipla Limited (India) · Glenmark Pharmaceuticals Ltd. (India) · LEO Pharma A/S (Denmark) · Galderma S.A. (Switzerland) · Amgen Inc. (U.S.) · Viatris Inc. (U.S.) · Teva Pharmaceutical Industries Ltd. (Israel) · Aclaris Therapeutics, Inc. (U.S.) · Almirall S.A. (Spain) · Bausch Health Companies Inc. (Canada) |
|
Market Opportunities |
· Rising demand for targeted and advanced dermatology therapies · Expanding awareness and improving access in emerging markets |
|
Value Added Data Infosets |
In addition to the insights on market scenarios such as market value, growth rate, segmentation, geographical coverage, and major players, the market reports curated by the Data Bridge Market Research also include in-depth expert analysis, patient epidemiology, pipeline analysis, pricing analysis, and regulatory framework. |
Vitiligo Market Trends
“Enhanced Therapeutic Innovation and Expansion of Advanced Treatment Approaches”
- A significant and accelerating trend in the global Vitiligo market is the growing focus on advanced therapeutic innovations aimed at addressing repigmentation, immune modulation, and long-term disease management. Increasing understanding of vitiligo as an autoimmune condition is driving research toward targeted therapies rather than conventional symptomatic approaches
- For instance, Janus kinase (JAK) inhibitors such as ruxolitinib cream have emerged as a breakthrough topical treatment, demonstrating meaningful repigmentation outcomes in non-segmental vitiligo patients. In several clinical settings across North America and Europe, dermatologists are increasingly prescribing JAK inhibitors as part of combination regimens with phototherapy to improve treatment response rates
- Another key development is the expansion of narrowband UVB (NB-UVB) phototherapy as a standard of care for widespread vitiligo cases. Hospitals and dermatology clinics in countries such as India, the United States, and Germany are reporting higher adoption of NB-UVB due to its improved safety profile and effectiveness in stimulating melanocyte activity
- In addition, regenerative medicine approaches such as melanocyte transplantation and cellular grafting techniques are gaining traction, particularly for stable vitiligo cases. Specialized dermatology centers in Japan and South Korea are advancing surgical repigmentation procedures that offer improved cosmetic outcomes for patients with localized disease
- There is also increasing interest in combination therapies that integrate immunosuppressants, antioxidants, and vitamin supplementation to improve overall treatment response. This multimodal approach is helping dermatologists tailor treatment plans based on disease severity, distribution, and patient-specific response patterns
- Globally, rising awareness campaigns, improved diagnosis rates, and expanding dermatology infrastructure are contributing to earlier intervention, which is critical for achieving better repigmentation outcomes
Vitiligo Market Dynamics
Driver
“Rising Disease Awareness and Expanding Dermatology Care Infrastructure”
- The increasing global awareness of vitiligo as a chronic autoimmune skin disorder is a key driver supporting market expansion. Public health initiatives, patient advocacy groups, and dermatology education programs are helping reduce stigma and encouraging earlier diagnosis and treatment seeking behavior
- For instance, in 2024–2025, several dermatology associations in countries such as India, the United Kingdom, and the United States have launched awareness campaigns promoting early screening and timely intervention for pigmentary disorders. These initiatives have significantly improved patient consultation rates in dermatology clinics
- Expanding access to dermatology care, particularly in emerging economies, is also supporting market growth. The establishment of specialized skin clinics and teledermatology services in regions such as Asia-Pacific and Latin America is improving access to expert consultation and treatment planning
- Furthermore, increasing healthcare expenditure and government support for dermatological research are enabling wider adoption of advanced therapies, including phototherapy and novel topical agents
- Growing social acceptance and reduced stigma associated with visible skin conditions are also encouraging more patients to seek medical treatment rather than cosmetic concealment alone, further expanding the addressable patient pool
Restraint/Challenge
“Limited Long-Term Curative Options and High Treatment Variability”
- One of the major challenges in the vitiligo market is the lack of a definitive cure and the highly variable response to existing therapies. While several treatment options exist, outcomes differ significantly among patients, making long-term disease management unpredictable
- For instance, some patients respond well to phototherapy and topical immunomodulators, while others experience minimal repigmentation even after prolonged treatment, leading to discontinuation or treatment fatigue. This variability complicates standardized treatment protocols across clinical settings
- Another key challenge is the chronic and relapsing nature of vitiligo, where repigmented areas may relapse after discontinuation of therapy or due to immune reactivation. This creates the need for prolonged maintenance therapy, increasing the overall treatment burden for patients
- In addition, access to advanced therapies such as JAK inhibitors and phototherapy remains limited in several low- and middle-income regions due to high costs and infrastructure constraints. This creates disparities in treatment availability across global markets
- Psychological burden associated with visible skin depigmentation also impacts treatment adherence, as patients may experience anxiety, depression, or reduced quality of life, further complicating long-term management outcomes
- Addressing these challenges through continued research into durable treatment solutions, improved affordability of advanced therapies, and wider access to dermatology care will be essential for sustained market growth
Vitiligo Market Scope
The market is segmented on the basis of type, treatment, dosage form, route of administration, end-users, and distribution channel.
- By Type
On the basis of type, the Vitiligo market is segmented into Segmental Vitiligo, Non-Segmental Vitiligo, and Others. The Non-Segmental Vitiligo segment dominated the largest market revenue share of 72.4% in 2025, driven by its higher global prevalence and chronic progressive nature. It is the most commonly diagnosed form of vitiligo, affecting patients with symmetrical depigmentation across multiple body regions. Increasing awareness and early dermatological consultation support higher diagnosis rates. Rising demand for long-term treatment solutions such as phototherapy and topical immunomodulators further strengthens the segment. Expanding availability of advanced biologics enhances treatment uptake. Strong clinical research focus on non-segmental cases reinforces market dominance. Growing patient awareness campaigns contribute to early intervention and sustained care.
The Segmental Vitiligo segment is expected to witness the fastest growth rate of 21.8% from 2026 to 2033, driven by its early onset and rapid stabilization phase, which allows targeted intervention strategies. Although less common, it requires specialized treatment approaches such as early phototherapy and surgical options. Increasing pediatric diagnosis rates are boosting awareness and treatment adoption. Advancements in skin grafting and cellular therapies are improving outcomes. Rising dermatology consultations support early disease management. Growing focus on cosmetic restoration further accelerates demand. Expanding research in localized vitiligo therapies strengthens segment growth.
- By Treatment
On the basis of treatment, the Vitiligo market is segmented into Medications, Therapies, Surgery, and Others. The Medications segment held the largest market revenue share of 46.9% in 2025, driven by widespread use of corticosteroids, calcineurin inhibitors, and emerging JAK inhibitors for repigmentation. Drug-based therapies remain the first-line approach for most patients due to accessibility and ease of use. Increasing prescription of topical and systemic treatments supports segment dominance. Rising approvals of novel targeted therapies enhance market expansion. Strong dermatologist preference for pharmacological management reinforces demand. Growing patient adherence to long-term medication further supports growth.
The Therapies segment is expected to witness the fastest CAGR of 24.7% from 2026 to 2033, driven by increasing adoption of phototherapy and combination treatment approaches. Narrowband UVB therapy is widely used for its effectiveness in stimulating melanocyte activity. Rising availability of advanced dermatology clinics supports access. Growing patient preference for non-invasive treatments boosts adoption. Increasing clinical evidence supporting combination therapies enhances outcomes. Expanding insurance coverage for phototherapy strengthens market penetration. Continuous innovation in light-based devices drives segment growth.
- By Dosage Form
On the basis of dosage form, the Vitiligo market is segmented into Oral, Injectable, Creams, Gel, Ointment, and Others. The Creams segment accounted for the largest market revenue share of 39.6% in 2025, driven by its direct skin application, ease of use, and high patient compliance. Topical corticosteroids and calcineurin inhibitors are widely prescribed for localized vitiligo. Strong availability of dermatological formulations supports dominance. Lower side effects compared to systemic therapies enhance preference. Rising use in outpatient dermatology settings further boosts demand. Expanding product innovation in topical formulations reinforces market leadership.
The Injectable segment is expected to witness the fastest growth rate of 25.3% from 2026 to 2033, driven by increasing adoption of biologics and advanced immunotherapy treatments. Injectable JAK inhibitors and other targeted therapies are gaining clinical acceptance. Rising demand for effective systemic treatment in severe cases supports growth. Expanding clinical trials in biologic dermatology strengthen innovation. Improved patient outcomes with injectable therapies accelerate adoption. Increasing specialist prescribing trends further boost usage. Growing focus on precision dermatology supports segment expansion.
- By Route of Administration
On the basis of route of administration, the Vitiligo market is segmented into Oral, Parenteral, Topical, and Others. The Topical segment dominated the largest market revenue share of 52.8% in 2025, driven by its primary role in managing localized vitiligo lesions. Topical corticosteroids and immunomodulators are widely used as first-line therapy. Ease of application and minimal systemic exposure support strong adoption. High patient compliance reinforces segment leadership. Strong dermatology prescription patterns further boost usage. Expanding availability of topical formulations strengthens market dominance.
The Parenteral segment is expected to witness the fastest CAGR of 23.9% from 2026 to 2033, driven by increasing use of injectable biologics and systemic immunotherapies. These treatments are particularly effective in widespread and resistant vitiligo cases. Rising adoption of advanced JAK inhibitor therapies supports growth. Expanding clinical research in systemic dermatology enhances development. Increasing physician preference for targeted treatments boosts uptake. Growing patient awareness of advanced therapies strengthens demand. Continuous innovation in injectable delivery systems supports expansion.
- By End-Users
On the basis of end-users, the Vitiligo market is segmented into Hospitals, Specialty Clinics, Homecare, and Others. The Specialty Clinics segment held the largest market revenue share of 44.5% in 2025, driven by high patient preference for dermatology-focused care and advanced treatment availability. These clinics offer phototherapy, laser treatment, and specialized dermatological consultations. Increasing prevalence of cosmetic skin disorders supports demand. Strong physician expertise in pigmentary disorders reinforces segment leadership. Growing access to advanced treatment technologies further boosts adoption. Rising outpatient dermatology visits continue to strengthen growth.
The Homecare segment is expected to witness the fastest CAGR of 24.2% from 2026 to 2033, driven by increasing availability of topical therapies and portable phototherapy devices. Patients prefer home-based treatment for convenience and long-term management. Rising teledermatology services support remote care adoption. Growing awareness of chronic disease self-management boosts demand. Increasing availability of prescription topical treatments enhances accessibility. Expanding digital healthcare platforms further strengthen uptake. Continuous innovation in home-use dermatology devices supports segment growth.
- By Distribution Channel
On the basis of distribution channel, the Vitiligo market is segmented into Hospital Pharmacy, Retail Pharmacy, and Online Pharmacy. The Hospital Pharmacy segment dominated the largest market revenue share of 48.1% in 2025, driven by direct dispensing of prescription medications following dermatology consultations. Hospitals remain the primary treatment centers for moderate to severe vitiligo cases. Strong physician control over prescriptions supports dominance. Availability of advanced therapies in hospital settings reinforces demand. High patient inflow for specialist care further boosts sales. Integrated treatment pathways strengthen market leadership.
The Online Pharmacy segment is expected to witness the fastest CAGR of 26.4% from 2026 to 2033, driven by increasing digital healthcare adoption and rising preference for home delivery of dermatology medications. Growing telemedicine consultations are boosting e-prescriptions. Expanding e-commerce penetration supports accessibility of treatments. Patient preference for convenience and privacy accelerates demand. Wider availability of branded and generic drugs online strengthens adoption. Increasing digital health infrastructure further supports growth. Continuous expansion of online pharmacy platforms drives rapid segment growth.
Vitiligo Market Regional Analysis
- North America dominated the vitiligo market with the largest revenue share of approximately 38.6% in 2025, characterized by advanced dermatology care infrastructure, strong adoption of innovative therapies, high patient awareness, and significant presence of leading pharmaceutical and dermatology companies, particularly in the U.S.
- Patients in the region highly value early diagnosis, access to advanced treatment options such as topical therapies, phototherapy, and emerging biologics, along with specialized dermatology services that support long-term disease management and improved quality of life
- This widespread adoption is further supported by strong healthcare spending, well-established specialty clinics, active research and clinical trial activity, and increasing awareness of autoimmune skin disorders, establishing North America as a key market for vitiligo treatment solutions
U.S. Vitiligo Market Insight
The U.S. vitiligo market captured the largest revenue share in 2025 within North America, driven by strong access to dermatology specialists, high awareness of pigmentary disorders, and increasing use of advanced treatment modalities including JAK inhibitors, phototherapy, and combination therapies. Patients are increasingly seeking effective long-term repigmentation solutions supported by dermatology clinics and research-driven treatment protocols. The presence of major pharmaceutical companies and ongoing clinical innovation further supports market expansion.
Europe Vitiligo Market Insight
The Europe vitiligo market is projected to expand at a substantial CAGR throughout the forecast period, primarily driven by strong public healthcare systems, rising awareness of skin pigmentation disorders, and increasing availability of advanced dermatological treatments. Growth in specialty dermatology clinics and adoption of combination therapies are further supporting market development across the region.
U.K. Vitiligo Market Insight
The U.K. vitiligo market is anticipated to grow at a noteworthy CAGR during the forecast period, driven by improved access to dermatology care, increasing patient awareness through public health initiatives, and growing adoption of phototherapy and topical immunomodulators. Expanding private dermatology services is also contributing to market growth.
Germany Vitiligo Market Insight
The Germany vitiligo market is expected to expand at a considerable CAGR during the forecast period, fueled by advanced healthcare infrastructure, strong focus on dermatological research, and increasing use of innovative treatment options. The country’s emphasis on evidence-based medicine and early intervention is supporting broader adoption of vitiligo therapies.
Asia-Pacific Vitiligo Market Insight
The Asia-Pacific vitiligo market is poised to grow at the fastest CAGR during the forecast period, due to rising patient population, increasing healthcare expenditure, improving access to dermatological treatments, growing awareness campaigns, and expanding specialty dermatology clinics across India, China, Japan, and Southeast Asia. Greater affordability of treatments and improving healthcare infrastructure are also accelerating growth in the region.
Japan Vitiligo Market Insight
The Japan vitiligo market is gaining momentum due to advanced dermatology services, high patient awareness, and strong adoption of technologically advanced treatment approaches such as targeted phototherapy and combination regimens. The aging population and increasing focus on cosmetic and quality-of-life dermatology are also supporting market demand.
China Vitiligo Market Insight
The China vitiligo market accounted for the largest market revenue share in Asia Pacific in 2025, attributed to the country’s large patient base, improving dermatology infrastructure, rising awareness of skin disorders, and increasing availability of advanced treatment options. Expanding hospital dermatology departments and growing access to specialized care are key factors propelling market growth in China.
Vitiligo Market Share
The Vitiligo industry is primarily led by well-established companies, including:
- AbbVie Inc. (U.S.)
- Pfizer Inc. (U.S.)
- Johnson & Johnson (U.S.)
- Novartis AG (Switzerland)
- Eli Lilly and Company (U.S.)
- Bristol-Myers Squibb Company (U.S.)
- Merck & Co., Inc. (U.S.)
- Incyte Corporation (U.S.)
- Sun Pharmaceutical Industries Ltd. (India)
- Reddy’s Laboratories Ltd. (India)
- Cipla Limited (India)
- Glenmark Pharmaceuticals Ltd. (India)
- LEO Pharma A/S (Denmark)
- Galderma S.A. (Switzerland)
- Amgen Inc. (U.S.)
- Viatris Inc. (U.S.)
- Teva Pharmaceutical Industries Ltd. (Israel)
- Aclaris Therapeutics, Inc. (U.S.)
- Almirall S.A. (Spain)
- Bausch Health Companies Inc. (Canada)
Latest Developments in Global Vitiligo Market
- In September 2021, the U.S. FDA approved ruxolitinib cream (Opzelura) for the treatment of atopic dermatitis, marking the introduction of the first topical Janus kinase (JAK) inhibitor that would later become a breakthrough platform therapy for vitiligo management. This approval established the foundation for repurposing JAK inhibition as a novel repigmentation strategy in autoimmune skin disorders
- In December 2021, the U.S. FDA accepted the supplemental New Drug Application (sNDA) for Opzelura (ruxolitinib cream) for vitiligo under priority review, signaling strong regulatory momentum for the first targeted repigmentation therapy in nonsegmental vitiligo. This milestone accelerated the transition of vitiligo treatment from off-label immunosuppressants to targeted JAK pathway therapies
- In July 2022, the U.S. FDA approved Opzelura (ruxolitinib 1.5% cream) for the treatment of nonsegmental vitiligo in adults and adolescents aged 12 years and older, making it the first and only FDA-approved therapy specifically for repigmentation in vitiligo patients. This marked a historic breakthrough in dermatology by introducing the first targeted topical therapy for pigment restoration
- In February 2023, the European Medicines Agency (EMA) Committee for Medicinal Products for Human Use (CHMP) issued a positive opinion recommending approval of ruxolitinib cream for nonsegmental vitiligo, paving the way for its expansion into the European market and strengthening global commercialization of JAK inhibitors for vitiligo treatment
- In November 2024, Health Canada approved ruxolitinib cream (Opzelura) for the treatment of nonsegmental vitiligo in adults and pediatric patients aged 12 and above, expanding access to the first targeted repigmentation therapy across North America beyond the United States. This further reinforced global regulatory adoption of JAK inhibitor–based vitiligo treatments
- In September 2025, the U.S. FDA expanded approval of ruxolitinib cream (Opzelura) for use in children aged 2 to 11 years with atopic dermatitis, broadening its pediatric indication and indirectly strengthening its market penetration in vitiligo care by increasing long-term clinical adoption of JAK-based dermatology therapies
- In February 2026, NHS England and NICE approved ruxolitinib cream for vitiligo treatment in the UK, following earlier rejection and subsequent reimbursement negotiations. This decision enabled large-scale patient access through the public healthcare system, marking a major commercialization milestone for vitiligo therapeutics in Europe
SKU-

- Interactive Data Analysis Dashboard
- Company Analysis Dashboard for high growth potential opportunities
- Research Analyst Access for customization & queries
- Competitor Analysis with Interactive dashboard
- Latest News, Updates & Trend analysis
- Harness the Power of Benchmark Analysis for Comprehensive Competitor Tracking
Data collection and base year analysis are done using data collection modules with large sample sizes. The stage includes obtaining market information or related data through various sources and strategies. It includes examining and planning all the data acquired from the past in advance. It likewise envelops the examination of information inconsistencies seen across different information sources. The market data is analysed and estimated using market statistical and coherent models. Also, market share analysis and key trend analysis are the major success factors in the market report. To know more, please request an analyst call or drop down your inquiry.
The key research methodology used by DBMR research team is data triangulation which involves data mining, analysis of the impact of data variables on the market and primary (industry expert) validation. Data models include Vendor Positioning Grid, Market Time Line Analysis, Market Overview and Guide, Company Positioning Grid, Patent Analysis, Pricing Analysis, Company Market Share Analysis, Standards of Measurement, Global versus Regional and Vendor Share Analysis. To know more about the research methodology, drop in an inquiry to speak to our industry experts.
Data Bridge Market Research is a leader in advanced formative research. We take pride in servicing our existing and new customers with data and analysis that match and suits their goal. The report can be customized to include price trend analysis of target brands understanding the market for additional countries (ask for the list of countries), clinical trial results data, literature review, refurbished market and product base analysis. Market analysis of target competitors can be analyzed from technology-based analysis to market portfolio strategies. We can add as many competitors that you require data about in the format and data style you are looking for. Our team of analysts can also provide you data in crude raw excel files pivot tables (Fact book) or can assist you in creating presentations from the data sets available in the report.


