
Indonesia Zeolite Market
Market Size in USD Million
 USD
98.31 Million
USD
154.71 Million
2024
2032
USD
98.31 Million
USD
154.71 Million
2024
2032
| 2025 - 2032 | |
| USD 98.31 Million | |
| USD 154.71 Million | |
| % | |
|
Zeolite Market Size
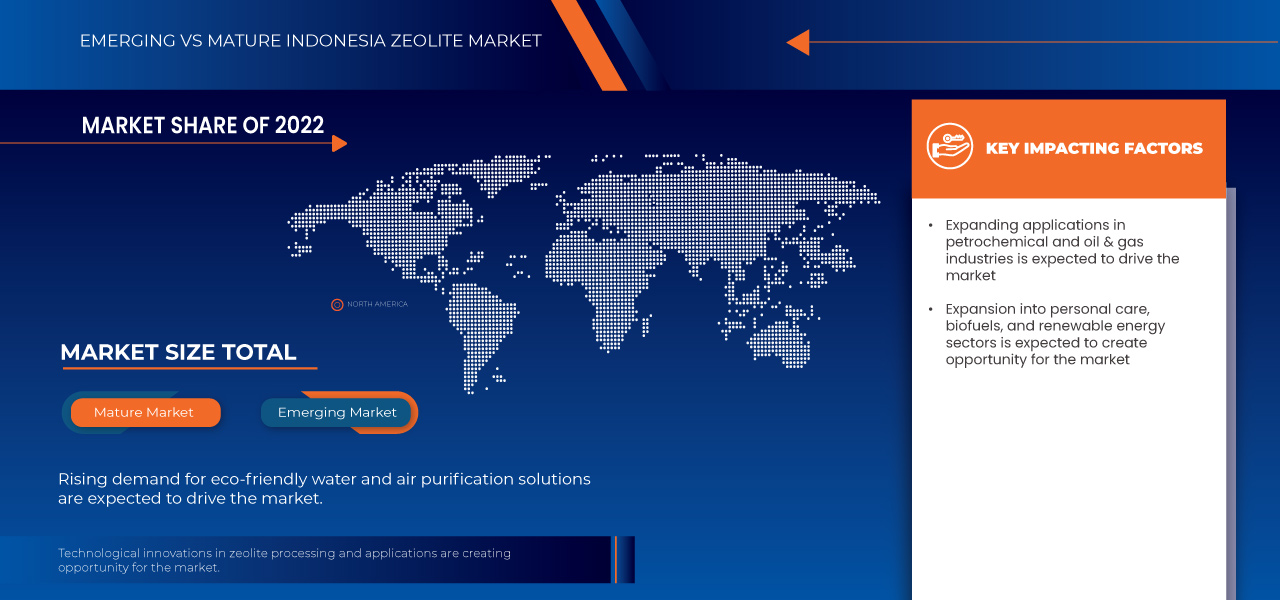
- The Indonesia zeolite market size was valued at USD 98.31 million in 2024 and is expected to reach USD 154.71 million by 2032, at a CAGR of 5.8% during the forecast period
- The market growth is largely fueled by increasing global food demand, rising adoption of nitrogen-based fertilizers in agriculture, expanding industrial applications, government initiatives promoting sustainable farming, advancements in fertilizer technology, and growing awareness about soil health and crop productivity worldwide.
- Furthermore, rising population pressure, shrinking arable land, and the need for higher crop yields are encouraging efficient fertilizer use. Strategic investments, technological innovations, and favorable agrochemical policies are also supporting ammonium sulfate demand, particularly in emerging economies focused on food security and agricultural development.
Zeolite Market Analysis
- The Zeolite market is expanding due to rising disease prevalence, growing awareness, and the adoption of biologic therapies. Improved diagnostic capabilities and increasing healthcare expenditure in emerging markets are also contributing significantly to market growth across both developed and developing regions.
- Future market growth is supported by ongoing clinical trials, advancements in precision medicine, and telehealth integration. Pharmaceutical companies are investing in novel treatment approaches, while regulatory support and faster drug approvals are creating opportunities for innovation and improved patient outcomes globally.
- The synthetic zeolite segment is expected to dominate the Zeolite market with a 76.47% share in 2025, driven by its superior ion-exchange capacity, controlled drug delivery potential, and ability to enhance therapeutic efficacy, supporting its increasing adoption in advanced treatment formulations and research applications.
Report Scope and Zeolite Market Segmentation
|
Attributes |
Zeolite Key Market Insights |
|
Segments Covered |
|
|
Key Market Players |
|
|
Market Opportunities |
|
|
Value Added Data Infosets |
In addition to the insights on market scenarios such as market value, growth rate, segmentation, geographical coverage, and major players, the market reports curated by the Data Bridge Market Research also include import export analysis, production capacity overview, production consumption analysis, price trend analysis, climate change scenario, supply chain analysis, value chain analysis, raw material/consumables overview, vendor selection criteria, PESTLE Analysis, Porter Analysis, and regulatory framework. |
Zeolite Market Trends
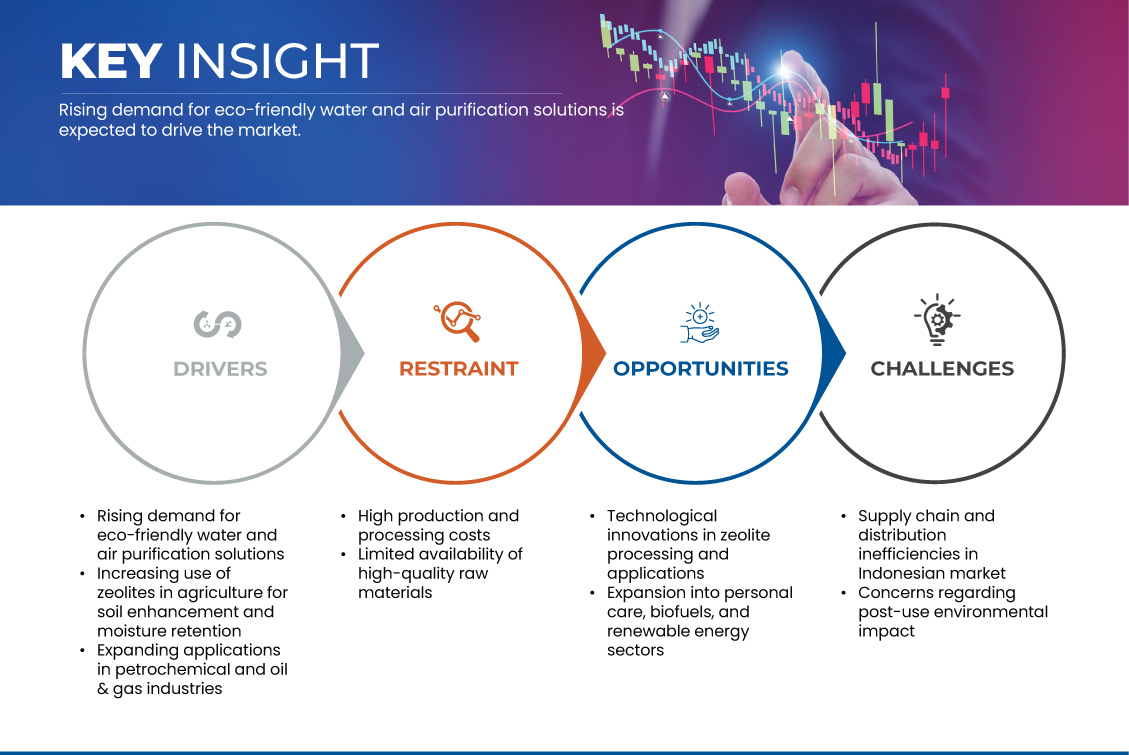
“Rising Demand For Eco-Friendly Water And Air Purification Solutions”
- The market is experiencing significant growth driven by the rising demand for eco-friendly water and air purification solutions. As environmental concerns intensify and regulatory bodies enforce stricter pollution control standards, industries and municipalities are increasingly turning to sustainable technologies for effective remediation.
- In water treatment, zeolites are extensively utilized for removing heavy metals, ammonia, and other contaminants, offering a cost-effective and environmentally responsible alternative to conventional methods.
- Similarly, in air purification systems, zeolites contribute to the removal of volatile organic compounds (VOCs), odors, and harmful gases, supporting cleaner indoor and industrial environments.
- The growing awareness among consumers and industries about the environmental and health impacts of untreated pollutants is accelerating the adoption of zeolite-based filtration systems. This trend is further supported by government initiatives promoting sustainable infrastructure and waste management practices.
- Consequently, the increasing inclination towards green purification technologies is expected to remain a key driver for the continued expansion of the Indonesia zeolite market in the coming years
Zeolite Market Dynamics
Driver
“INCREASING USE OF ZEOLITES IN AGRICULTURE FOR SOIL ENHANCEMENT AND MOISTURE RETENTION”
- The zeolite market is witnessing significant growth, driven by the increasing adoption of zeolites in agriculture for soil enhancement and moisture retention.
- Zeolites, particularly clinoptilolite and mordenite, possess high cation exchange capacities and porous structures, enabling them to retain essential nutrients such as ammonium and potassium in the root zone, thereby improving nutrient use efficiency and reducing leaching losses
- In Indonesia, where diverse soil types and climatic conditions prevail, the application of zeolites has proven beneficial in enhancing soil physical and chemical properties. Studies have demonstrated that zeolite amendments increase soil moisture retention, promote hydraulic conductivity, and improve crop yields, particularly in sandy and low-fertility soils. Furthermore, zeolites' ability to act as slow-release fertilizers ensures a steady supply of nutrients, aligning with sustainable agricultural practices.
- The environmental advantages of zeolite use, including reduced nitrate leaching and mitigation of greenhouse gas emissions, further underscore their role in promoting sustainable agriculture.
- As Indonesia continues to prioritize food security and environmental sustainability, the integration of zeolites into agricultural practices is expected to remain a key driver for the expansion of the zeolite market in the coming years.
Restraint/Challenge
“HIGH PRODUCTION AND PROCESSING COSTS”
- The market faces significant challenges due to high production and processing costs, which impede its competitiveness and profitability.
- Natural zeolite extraction involves energy-intensive processes such as crushing, grinding, and calcination, leading to elevated operational expenses. For instance, calcination temperatures typically range from 500°C to 650°C, requiring substantial energy input.
- Additionally, the synthesis of synthetic zeolites demands specialized equipment and high energy consumption, further escalating costs. The use of organic structure-directing agents (OSDAs) in synthesis introduces additional expenses and environmental concerns due to the need for complex waste management
- Geographical factors also contribute to cost challenges. Zeolite deposits in Indonesia are often located in remote or mountainous regions, increasing transportation and logistics expenses
- These high production and processing costs limit the market's ability to offer competitive pricing, especially for small and medium-sized enterprises (SMEs). The financial burden of complying with environmental regulations and implementing sustainable practices further strains profitability.
Zeolite Market Scope
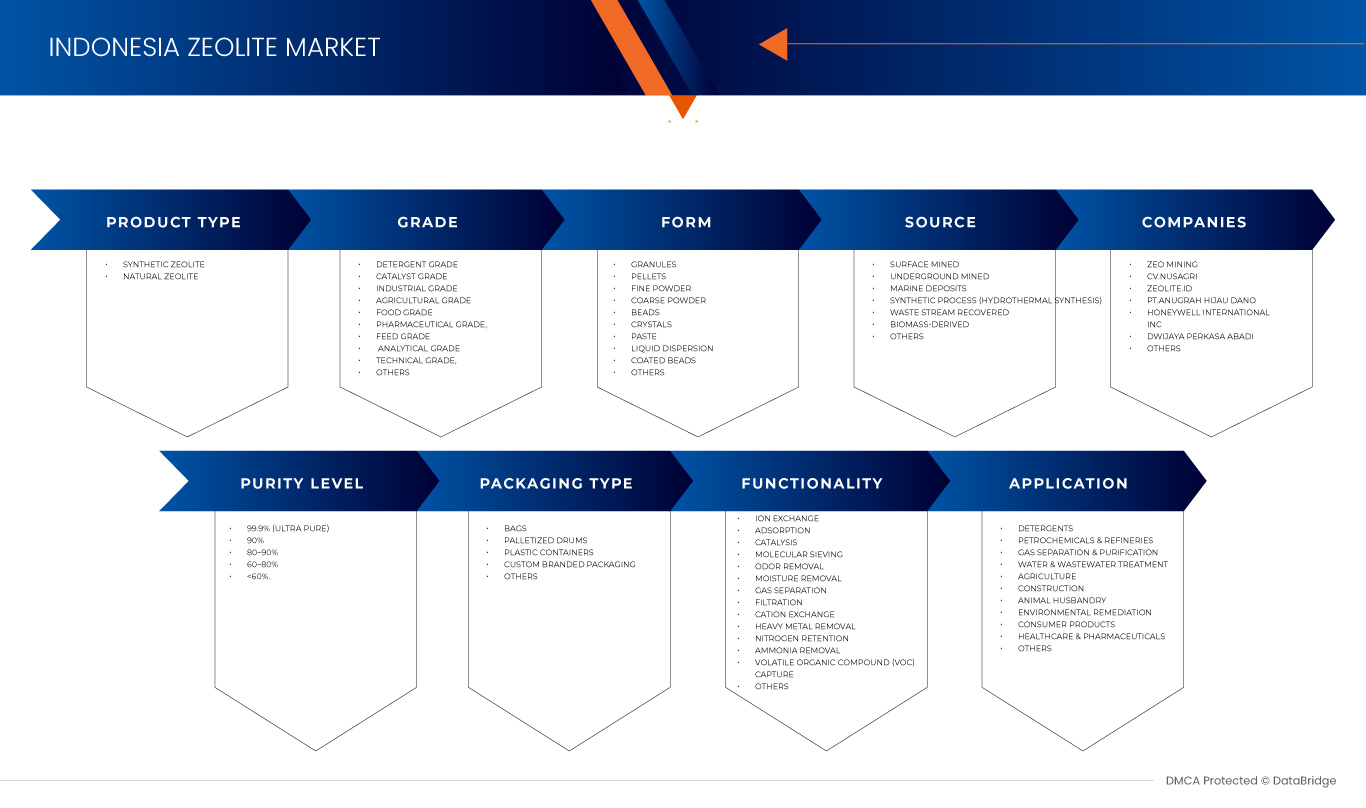
The Indonesia Zeolite Market is segmented into eight segments based on Product Type, Grade, Form, Source, Purity Level, Packaging Type, Functionality, Application.
- By Product Type:
On the basis of product type, the market is segmented into Synthetic Zeolite and Natural Zeolite. In 2025, the Synthetic Zeolite segment is expected to dominate the market with a 76.47% market share, driven by its customizable properties, higher purity, consistent quality, and growing demand in specialized applications such as catalysis, advanced gas separation, and high-performance detergents.
The Synthetic Zeolite segment is anticipated to witness the fastest growth rate from 2025 to 2032, fueled by continuous innovation in synthesis methods, increasing demand for tailored solutions in various industrial applications, and stricter environmental regulations favoring high-efficiency materials.
- By Grade:
On the basis of grade, the market is segmented into Detergent Grade, Catalyst Grade, Industrial Grade, Agricultural Grade, Food Grade, Pharmaceutical Grade, Feed Grade, Analytical Grade, Technical Grade, and Others. The Catalyst Grade segment is expected to hold the largest market revenue share in 2025, driven by the expanding petrochemical and refinery industries, increasing demand for efficient and selective catalysts, and stringent environmental regulations promoting cleaner production processes.
The Detergent Grade segment is anticipated to witness the fastest CAGR 6.2% from 2025 to 2032, fueled by rising investments in renewable energy and biofuels, continuous development of advanced catalytic processes, and growing demand for high-performance catalysts in various chemical reactions.
- By Form:
On the basis of form, the market is segmented into Granules, Pellets, Fine Powder, Coarse Powder, Beads, Crystals, Paste, Liquid Dispersion, Coated Beads, and Others. The Fine Powder segment is expected to hold the largest market revenue share in 2025, driven by its high surface area, excellent adsorption capabilities, and widespread use in applications such as detergents, adsorbents, and fine chemical processing where rapid reaction or high contact efficiency is crucial.
The Granules segment is anticipated to witness the fastest CAGR from 2025 to 2032, driven by increasing demand for engineered forms in applications like gas separation, petrochemical refining, and water treatment, where consistent size, high crush strength, and efficient packing are essential for optimal performance.
- By Source:
On the basis of source, the market is segmented into Surface Mined, Underground Mined, Marine Deposits, Synthetic Process (Hydrothermal Synthesis), Waste Stream Recovered, Biomass-Derived, and Others. The Synthetic Process (Hydrothermal Synthesis) segment is expected to hold the largest market revenue share in 2025, driven by the ability to produce zeolites with tailored structures, higher purity, and specific properties required for high-value applications in catalysis, adsorption, and molecular sieving.
The Surface Mined segment is anticipated to witness the fastest CAGR from 2025 to 2032, fueled by continuous advancements in synthetic methods, increasing demand for specialized zeolite structures, and the growing need for consistent, high-performance materials in diverse industrial and advanced technological applications.
- By Purity Level:
On the basis of purity level, the market is segmented into 99.9% (Ultra Pure), 90%, 80–90%, 60–80%, and <60%. The 99.9% (Ultra Pure) segment is expected to hold the largest market revenue share in 2025, driven by stringent requirements for high-performance applications in pharmaceuticals, specialized catalysts, advanced gas separation, and sensitive environmental remediation where even trace impurities can impact performance.
The 99.9% (Ultra Pure) segment is anticipated to witness the fastest CAGR from 2025 to 2032, fueled by increasing demand for high-quality materials in emerging technologies, stricter regulatory standards for product purity, and the rising focus on maximizing efficiency and performance in critical industrial processes.
- By Packaging Type:
On the basis of packaging type, the market is segmented into Bags, Palletized Drums, Plastic Containers, Custom Branded Packaging, and Others. The Bags segment is expected to hold the largest market revenue share in 2025, driven by its cost-effectiveness, ease of handling for bulk quantities, and widespread use across various industrial and agricultural applications that require large volumes of zeolite.
The Bags segment is anticipated to witness the fastest CAGR from 2025 to 2032, fueled by increasing demand for smaller, more manageable quantities, enhanced protection against moisture and contamination, and growing use in consumer products and specialized industrial applications.
- By Functionality:
On the basis of functionality, the market is segmented into Ion Exchange, Adsorption, Catalysis, Molecular Sieving, Odor Removal, Moisture Removal, Gas Separation, Filtration, Cation Exchange, Heavy Metal Removal, Nitrogen Retention, Ammonia Removal, Volatile Organic Compound (VOC) Capture, and Others. The Adsorption segment is expected to hold the largest market revenue share in 2025, driven by its widespread application in gas purification, moisture removal, air drying, and various environmental remediation processes where effective pollutant capture is essential.
The Ion Exchange segment is anticipated to witness the fastest CAGR from 2025 to 2032, fueled by increasing demand for efficient separation of industrial gases, rising focus on greenhouse gas capture, and the growth of sectors like petrochemicals, natural gas processing, and oxygen/nitrogen production.
- By Application:
On the basis of application, the market is segmented into Detergents, Petrochemicals & Refineries, Gas Separation & Purification, Water & Wastewater Treatment, Agriculture, Construction, Animal Husbandry, Environmental Remediation, Consumer Products, Healthcare & Pharmaceuticals, and Others. The Water & Wastewater Treatment segment is expected to hold the largest market revenue share in 2025, driven by increasing global water scarcity, stringent environmental regulations on water discharge, and the growing need for effective removal of heavy metals, ammonia, and other contaminants.
The Detergents segment is anticipated to witness the fastest CAGR from 2025 to 2032, fueled by increasing adoption of zeolites for soil conditioning, nutrient retention, and ammonia control in animal feed, driven by growing demand for sustainable agricultural practices and improved animal health.
Zeolite Market Share
The Zeolite industry is primarily led by well-established companies, including:
- Zeo Mining
- CV.NUSAGRI
- zeolite.id
- PT.ANUGRAH HIJAU DANO
- Honeywell International Inc.
- Dwijaya Perkasa Abadi
- PT. Panja Multi Mineralindo
- Arkema
- PT. PRIJADI CAHAYA INDONESIA
- BASF
- Java Indah
- CLARIANT
Latest Developments in Indonesia Zeolite Market
- In May 2020, Honeywell International Inc. developments in catalysts focus on enhancing refining processes by improving efficiency and product quality. These innovations are designed to optimize the conversion of crude oil into valuable fuels and chemicals, supporting cleaner and more sustainable refinery operations.
- In December 2024, BASF inaugurated a state-of-the-art Catalyst Development and Solids Processing Center in Ludwigshafen, Germany. This facility accelerates the transition from laboratory-scale innovations to pilot-scale production, enabling faster delivery of advanced zeolite catalysts to the market and supporting sustainable chemical processes.
- In July 2024, Clariant Catalysts and KBR expanded their strategic collaboration to enhance low-carbon ammonia production. This partnership aims to advance ammonia synthesis with improved energy efficiency and reduced carbon emissions, supporting the transition to more sustainable chemical processes. By leveraging Clariant’s innovative catalyst technologies and KBR’s expertise in ammonia production, the collaboration seeks to optimize process performance and environmental impact. This initiative aligns with global efforts to promote cleaner energy solutions and decarbonization
- In April 2024, Clariant introduced the CATOFIN 312 catalyst, an advanced propane dehydrogenation (PDH) catalyst designed to enhance propylene production. The new catalyst offers improved selectivity, higher yield, and increased operational efficiency, helping manufacturers optimize performance while reducing energy consumption. By enabling more sustainable and cost-effective propylene production, CATOFIN 312 supports the growing demand for high-purity olefins in the petrochemical industry. This innovation reinforces Clariant’s commitment to advancing catalyst technology for a more efficient and sustainable future
- In March 2024, Clariant launched CLARITY Prime, an advanced purification adsorbent designed to enhance edible oil refining. The solution improves color, taste, and stability while reducing contaminants, ensuring higher-quality oil production. This innovation supports more efficient and sustainable food processing
SKU-

- Interactive Data Analysis Dashboard
- Company Analysis Dashboard for high growth potential opportunities
- Research Analyst Access for customization & queries
- Competitor Analysis with Interactive dashboard
- Latest News, Updates & Trend analysis
- Harness the Power of Benchmark Analysis for Comprehensive Competitor Tracking
Table of Content
1 INTRODUCTION
1.1 OBJECTIVES OF THE STUDY
1.2 MARKET DEFINITION
1.3 OVERVIEW
1.4 LIMITATIONS
1.5 MARKETS COVERED
2 MARKET SEGMENTATION
2.1 MARKETS COVERED
2.2 GEOGRAPHICAL SCOPE
2.3 YEARS CONSIDERED FOR THE STUDY
2.4 CURRENCY AND PRICING
2.5 DBMR TRIPOD DATA VALIDATION MODEL
2.6 MULTIVARIATE MODELING
2.7 PRIMARY INTERVIEWS WITH KEY OPINION LEADERS
2.8 DBMR MARKET POSITION GRID
2.9 DBMR VENDOR SHARE ANALYSIS
2.1 MARKET APPLICATION COVERAGE GRID
2.11 SECONDARY SOURCES
2.12 ASSUMPTIONS
3 EXECUTIVE SUMMARY
4 PREMIUM INSIGHTS
4.1 PORTER’S FIVE FORCES
4.1.1 THREAT OF NEW ENTRANTS
4.1.2 BARGAINING POWER OF SUPPLIERS
4.1.3 BARGAINING POWER OF BUYERS
4.1.4 THREAT OF SUBSTITUTES
4.1.5 INDUSTRY RIVALRY
4.2 PRICING ANALYSIS
4.3 BRAND OUTLOOK
4.3.1 BRAND COMPARITIVE ANALYSIS OF INDONESIA ZEOLITE MARKET
4.3.2 PRODUCT VS BRAND OVERVIEW
4.3.2.1 PRODUCT OVERVIEW
4.3.2.2 BRAND OVERVIEW
4.3.3 CONCLUSION
4.4 COST ANALYSIS BREAKDOWN
4.4.1 RAW MATERIALS
4.4.2 ENERGY CONSUMPTION
4.4.3 LABOR AND OPERATIONAL COSTS
4.4.4 RESEARCH AND DEVELOPMENT
4.5 FACTORS INFLUENCING PURCHASING DECISION OF END-USERS
4.5.1 ENVIRONMENTAL REGULATIONS AND PHOSPHATE-FREE DETERGENTS
4.5.2 AGRICULTURAL APPLICATIONS AND SOIL HEALTH
4.5.3 WATER TREATMENT AND PURIFICATION NEEDS
4.5.4 INDUSTRIAL APPLICATIONS IN PETROCHEMICALS AND CONSTRUCTION
4.5.5 ECONOMIC FACTORS AND SUPPLY STABILITY
4.5.6 HEALTH AND SAFETY CONSIDERATIONS
4.5.7 GOVERNMENT POLICIES AND INFRASTRUCTURE DEVELOPMENT
4.6 GROWTH STRATEGIES ADOPTED BY KEY MARKET PLAYERS
4.6.1 STRATEGIC DECISIONS:
4.7 IMPACT OF ECONOMIC SLOW DOWN ON MARKET
4.7.1 IMPACT ON PRICE
4.7.2 IMPACT ON SUPPLY CHAIN
4.7.3 IMPACT ON SHIPMENT
4.7.4 IMPACT ON COMPANY’S STRATEGIC DECISIONS
4.8 INDUSTRY ECOSYSTEM ANALYSIS
4.8.1 PROMINENT COMPANIES
4.8.2 SMALL & MEDIUM SIZE COMPANIES
4.8.3 END USERS
4.8.4 RESEARCH AND DEVELOPMENT
4.9 INNOVATION TRACKER AND STRATEGIC ANALYSIS
4.9.1 MAJOR DEALS AND STRATEGIC ALLIANCES ANALYSIS
4.9.1.1 JOINT VENTURES
4.9.1.2 MERGERS AND ACQUISITION
4.9.1.3 LICENSING AND PARTNERSHIP
4.9.1.4 TECHNOLOGY COLLABORATIONS
4.9.1.5 STRATEGIC DIVESTMENTS
4.9.2 NUMBER OF PRODUCTS IN DEVELOPMENT
4.9.3 STAGE OF DEVELOPMENT
4.9.4 TIMELINES AND MILESTONES
4.9.5 INNOVATION STRATEGIES AND METHODOLOGIES
4.9.6 RISK ASSESSMENT AND MITIGATION
4.9.7 FUTURE OUTLOOK
4.1 OVERVIEW OF TECHNOLOGICAL INNOVATIONS
4.10.1 TECHNOLOGICAL INNOVATIONS IN ZEOLITE SYNTHESIS
4.10.2 MARKET TRENDS AND APPLICATIONS
4.10.3 FUTURE OUTLOOK
4.11 PRODUCTION CAPACITY OUTLOOK
4.12 PROFIT MARGINS SCENARIO
4.12.1 MARGIN RANGE BY PRODUCT TYPE
4.12.2 KEY FACTORS INFLUENCING MARGINS
4.12.3 DOMESTIC VS. EXPORT MARKET MARGINS
4.13 RAW MATERIAL SOURCING ANALYSIS
4.13.1 ABUNDANT NATURAL RESERVES
4.13.2 KEY PRODUCERS AND SUPPLIERS
4.13.3 PRODUCTION AND EXPORT DYNAMICS
4.13.4 APPLICATIONS AND MARKET DEMAND
4.13.5 CHALLENGES AND OPPORTUNITIES
4.14 SUPPLY CHAIN ANALYSIS
4.15 VALUE CHAIN ANALYSIS
4.16 TARIFF ANALYSIS
4.16.1 CURRENT TARIFF RATES IN TOP-5 COUNTRY MARKETS
4.16.2 OUTLOOK: LOCAL PRODUCTION VS. IMPORT RELIANCE
4.16.3 VENDOR SELECTION CRITERIA DYNAMICS
4.16.4 IMPACT ON SUPPLY CHAIN
4.16.5 INDUSTRY PARTICIPANTS: PROACTIVE MOVES
4.16.6 IMPACT ON PRICES
4.16.7 REGULATORY INCLINATION
4.17 PETENT ANALYSIS
4.17.1 PATENT QUALITY AND STRENGTH
4.17.2 PATENT FAMILIES
4.17.2.1 LICENSING AND COLLABORATIONS
4.17.2.2 COMPANY PATENT LANDSCAPE
4.17.2.3 REGION PATENT LANDSCAPE
4.17.2.4 IP STRATEGY AND MANAGEMENT
4.17.2.5 PATENT ANALYSIS
5 REGULATION COVERAGE
6 MARKET OVERVIEW
6.1 DRIVERS
6.1.1 RISING DEMAND FOR ECO-FRIENDLY WATER AND AIR PURIFICATION SOLUTIONS
6.1.2 INCREASING USE OF ZEOLITES IN AGRICULTURE FOR SOIL ENHANCEMENT AND MOISTURE RETENTION
6.1.3 EXPANDING APPLICATIONS IN PETROCHEMICAL AND OIL & GAS INDUSTRIES
6.2 RESTRAINTS
6.2.1 HIGH PRODUCTION AND PROCESSING COSTS
6.2.2 LIMITED AVAILABILITY OF HIGH-QUALITY RAW MATERIALS
6.3 OPPORTUNITIES
6.3.1 TECHNOLOGICAL INNOVATIONS IN ZEOLITE PROCESSING AND APPLICATIONS
6.3.2 EXPANSION INTO PERSONAL CARE, BIOFUELS, AND RENEWABLE ENERGY SECTORS
6.4 CHALLENGES
6.4.1 SUPPLY CHAIN AND DISTRIBUTION INEFFICIENCIES IN INDONESIAN MARKET
6.4.2 CONCERNS REGARDING POST-USE ENVIRONMENTAL IMPACT
7 INDONESIA ZEOLITE MARKET, BY PRODUCT TYPE
7.1 OVERVIEW
7.2 SYNTHETIC ZEOLITE
7.2.1 SYNTHETIC ZEOLITE, BY PRODUCT TYPE
7.2.1.1 ZEOLITE A, BY PRODUCT TYPE
7.2.1.2 ZEOLITE ZSM-5, BY PRODUCT TYPE
7.3 NATURAL ZEOLITE
7.3.1 NATURAL ZEOLITE, BY PRODUCT TYPE
8 INDONESIA ZEOLITE MARKET, BY GRADE
8.1 OVERVIEW
8.2 DETERGENT GRADE
8.3 CATALYST GRADE
8.4 INDUSTRIAL GRADE
8.5 AGRICULTURAL GRADE
8.6 FOOD GRADE
8.7 PHARMACEUTICAL GRADE
8.8 FEED GRADE
8.9 ANALYTICAL GRADE
8.1 TECHNICAL GRADE
8.11 OTHERS
9 INDONESIA ZEOLITE MARKET, BY FORM
9.1 OVERVIEW
9.2 GRANULES
9.2.1 GRANULES, BY FORM
9.3 PELLETS
9.4 FINE POWDER
9.5 COARSE POWDER
9.6 BEADS
9.7 CRYSTALS
9.8 PASTE
9.9 LIQUID DISPERSION
9.1 COATED BEADS
9.11 OTHERS
10 INDONESIA ZEOLITE MARKET, BY SOURCE
10.1 OVERVIEW
10.2 SURFACE MINED
10.3 UNDERGROUND MINED
10.4 MARINE DEPOSITS
10.5 SYNTHETIC PROCESS (HYDROTHERMAL SYNTHESIS)
10.6 WASTE STREAM RECOVERED
10.7 BIOMASS-DERIVED
10.8 OTHERS
11 INDONESIA ZEOLITE MARKET, BY PURITY LEVEL
11.1 OVERVIEW
11.2 99.9% (ULTRA PURE)
11.3 0.9
11.4 80–90%
11.5 60–80%
11.6 <60%
12 INDONESIA ZEOLITE MARKET, BY PACKAGING TYPE
12.1 OVERVIEW
12.2 BAGS
12.2.1 BAGS, BY PACKAGING TYPE
12.3 PALLETIZED DRUMS
12.4 PLASTIC CONTAINERS
12.5 CUSTOM BRANDED PACKAGING
12.6 OTHERS
13 INDONESIA ZEOLITE MARKET, BY FUNCTIONALITY
13.1 OVERVIEW
13.2 ION EXCHANGE
13.3 ADSORPTION
13.4 CATALYSIS
13.5 MOLECULAR SIEVING
13.6 ODOR REMOVAL
13.7 MOISTURE REMOVAL
13.8 GAS SEPARATION
13.9 FILTRATION
13.1 CATION EXCHANGE
13.11 HEAVY METAL REMOVAL
13.12 NITROGEN RETENTION
13.13 AMMONIA REMOVAL
13.14 VOLATILE ORGANIC COMPOUND (VOC) CAPTURE
13.15 OTHERS
14 INDONESIA ZEOLITE MARKET, BY APPLICATION
14.1 OVERVIEW
14.2 DETERGENTS
14.2.1 DETERGENTS, BY APPLICATION
14.2.2 DETERGENTS, BY PRODUCT TYPE
14.3 PETROCHEMICALS & REFINERIES
14.3.1 PETROCHEMICALS & REFINERIES ENTS, BY APPLICATION
14.3.2 PETROCHEMICALS & REFINERIES, BY PRODUCT TYPE
14.4 GAS SEPARATION & PURIFICATION
14.4.1 GAS SEPARATION & PURIFICATION, BY APPLICATION
14.4.2 GAS SEPARATION & PURIFICATION, BY PRODUCT TYPE
14.5 WATER & WASTEWATER TREATMENT
14.5.1 WATER & WASTEWATER TREATMENT, BY APPLICATION
14.5.2 WATER & WASTEWATER TREATMENT, BY PRODUCT TYPE
14.6 AGRICULTURE
14.6.1 AGRICULTURE, BY APPLICATION
14.6.2 AGRICULTURE, BY PRODUCT TYPE
14.7 CONSTRUCTION
14.7.1 CONSTRUCTION, BY APPLICATION
14.7.2 CONSTRUCTION, BY PRODUCT TYPE
14.8 ANIMAL HUSBANDRY
14.8.1 ANIMAL HUSBANDRY, BY APPLICATION
14.8.2 ANIMAL HUSBANDRY, BY PRODUCT TYPE
14.9 ENVIRONMENTAL REMEDIATION
14.9.1 ENVIRONMENTAL REMEDIATION, BY APPLICATION
14.9.2 ENVIRONMENTAL REMEDIATION, BY PRODUCT TYPE
14.1 CONSUMER PRODUCTS
14.10.1 CONSUMER PRODUCTS, BY APPLICATION
14.10.2 CONSUMER PRODUCTS, BY PRODUCT TYPE
14.11 HEALTHCARE & PHARMACEUTICALS
14.11.1 HEALTHCARE & PHARMACEUTICALS, BY APPLICATION
14.11.2 HEALTHCARE & PHARMACEUTICALS, BY PRODUCT TYPE
14.12 OTHERS
14.12.1 OTHERS, BY PRODUCT TYPE
15 INDONESIA ZEOLITE MARKET: COMPANY LANDSCAPE
15.1 COMPANY SHARE ANALYSIS: INDONESIA
16 SWOT ANALYSIS
17 COMPANY PROFILES MANUFACTURER
17.1 ZEO MINING
17.1.1 COMPANY SNAPSHOT
17.1.2 PRODUCT PORTFOLIO
17.1.3 RECENT DEVELOPMENTS
17.2 CV.NUSAGRI
17.2.1 COMPANY SNAPSHOT
17.2.2 PRODUCT PORTFOLIO
17.2.3 RECENT DEVELOPMENTS
17.3 ZEOLITE.ID
17.3.1 COMPANY SNAPSHOT
17.3.2 PRODUCT PORTFOLIO
17.3.3 RECENT DEVELOPMENT
17.4 PT.ANUGRAH HIJAU DANO
17.4.1 COMPANY SNAPSHOT
17.4.2 PRODUCT PORTFOLIO
17.4.3 RECENT DEVELOPMENT
17.5 HONEYWELL INTERNATIONAL INC
17.5.1 COMPANY SNAPSHOT
17.5.2 REVENUE ANALYSIS
17.5.3 PRODUCT/BRAND PORTFOLIO
17.5.4 RECENT DEVELOPMENT/NEWS
17.6 ARKEMA
17.6.1 COMPANY SNAPSHOT
17.6.2 REVENUE ANALYSIS
17.6.3 PRODUCT PORTFOLIO
17.6.4 RECENT DEVELOPMENT/NEWS
17.7 BASF
17.7.1 COMPANY SNAPSHOT
17.7.2 REVENUE ANALYSIS
17.7.3 PRODUCT PORTFOLIO
17.7.4 RECENT DEVELOPMENTS/NEWS
17.8 CLARIANT
17.8.1 COMPANY SNAPSHOT
17.8.2 REVENUE ANALYSIS
17.8.3 PRODUCT/BRAND PORTFOLIO
17.8.4 RECENT DEVELOPMENT/NEWS
17.9 DWIJAYA PERKASA ABADI
17.9.1 COMPANY SNAPSHOT
17.9.2 PRODUCT PORTFOLIO
17.9.3 RECENT DEVELOPMENTS
17.1 JAVA INDAH
17.10.1 COMPANY SNAPSHOT
17.10.2 PRODUCT PORTFOLIO
17.10.3 RECENT DEVELOPMENT
17.11 PT. PANJA MULTI MINERALINDO
17.11.1 COMPANY SNAPSHOT
17.11.2 PRODUCT PORTFOLIO
17.11.3 RECENT DEVELOPMENTS
17.12 PT. PRIJADI CAHAYA INDONESIA
17.12.1 COMPANY SNAPSHOT
17.12.2 PRODUCT PORTFOLIO
17.12.3 RECENT DEVELOPMENT
18 COMPANY PROFILES DISTRIBUTORS
18.1 PT SAVANNA LANDS TRADING
18.1.1 COMPANY SNAPSHOT
18.1.2 PRODUCT PORTFOLIO
18.1.3 RECENT DEVELOPMENT
18.2 WIGMORE TRADING LIMITED
18.2.1 COMPANY SNAPSHOT
18.2.2 PRODUCT PORTFOLIO
18.2.3 RECENT DEVELOPMENT
18.3 XIAMEN ZEOLITEMIN BIOTECH CO.,LTD.
18.3.1 COMPANY SNAPSHOT
18.3.2 PRODUCT PORTFOLIO
18.3.3 RECENT DEVELOPMENTS
18.4 PT. GAEL VADA INDONESIA
18.4.1 COMPANY SNAPSHOT
18.4.2 PRODUCT PORTFOLIO
18.4.3 RECENT DEVELOPMENTS
19 QUESTIONNAIRE
20 RELATED REPORTS
List of Table
TABLE 1 REGULATORY FRAMEWORK AND GUIDELINES
TABLE 2 INDONESIA ZEOLITE MARKET, BY PRODUCT TYPE, 2018-2032 (USD THOUSAND)
TABLE 3 INDONESIA ZEOLITE MARKET, BY PRODUCT TYPE, 2018-2032 (TONS))
TABLE 4 INDONESIA SYNTHETIC ZEOLITE IN ZEOLITE MARKET, BY PRODUCT TYPE, 2018-2032 (USD THOUSAND)
TABLE 5 INDONESIA ZEOLITE A IN ZEOLITE MARKET, BY PRODUCT TYPE, 2018-2032 (USD THOUSAND)
TABLE 6 INDONESIA ZEOLITE ZSM-5 IN ZEOLITE MARKET, BY PRODUCT TYPE, 2018-2032 (USD THOUSAND)
TABLE 7 INDONESIA NATURAL ZEOLITE IN ZEOLITE MARKET, BY PRODUCT TYPE, 2018-2032 (USD THOUSAND)
TABLE 8 INDONESIA ZEOLITE MARKET, BY GRADE, 2018-2032 (USD THOUSAND)
TABLE 9 INDONESIA ZEOLITE MARKET, BY FORM, 2018-2032 (USD THOUSAND)
TABLE 10 INDONESIA GRANULES IN ZEOLITE MARKET, BY FORM, 2018-2032 (USD THOUSAND)
TABLE 11 INDONESIA ZEOLITE MARKET, BY SOURCE, 2018-2032 (USD THOUSAND)
TABLE 12 INDONESIA ZEOLITE MARKET, BY PURITY LEVEL, 2018-2032 (USD THOUSAND)
TABLE 13 INDONESIA ZEOLITE MARKET, BY PACKAGING TYPE, 2018-2032 (USD THOUSAND)
TABLE 14 INDONESIA BAGS IN ZEOLITE MARKET, BY PACKAGING TYPE, 2018-2032 (USD THOUSAND)
TABLE 15 INDONESIA ZEOLITE MARKET, BY FUNCTIONALITY, 2018-2032 (USD THOUSAND)
TABLE 16 INDONESIA ZEOLITE MARKET, BY APPLICATION, 2018-2032 (USD THOUSAND)
TABLE 17 INDONESIA DETERGENTS IN ZEOLITE MARKET, BY APPLICATION, 2018-2032 (USD THOUSAND)
TABLE 18 INDONESIA DETERGENTS IN ZEOLITE MARKET, BY PRODUCT TYPE, 2018-2032 (USD THOUSAND)
TABLE 19 INDONESIA PETROCHEMICALS & REFINERIES IN ZEOLITE MARKET, BY APPLICATION, 2018-2032 (USD THOUSAND)
TABLE 20 INDONESIA PETROCHEMICALS & REFINERIES IN ZEOLITE MARKET, BY PRODUCT TYPE, 2018-2032 (USD THOUSAND)
TABLE 21 INDONESIA GAS SEPARATION & PURIFICATION IN ZEOLITE MARKET, BY APPLICATION, 2018-2032 (USD THOUSAND)
TABLE 22 INDONESIA GAS SEPARATION & PURIFICATION IN ZEOLITE MARKET, BY PRODUCT TYPE, 2018-2032 (USD THOUSAND)
TABLE 23 INDONESIA WATER & WASTEWATER TREATMENT IN ZEOLITE MARKET, BY APPLICATION, 2018-2032 (USD THOUSAND)
TABLE 24 INDONESIA WATER & WASTEWATER TREATMENT IN ZEOLITE MARKET, BY PRODUCT TYPE, 2018-2032 (USD THOUSAND)
TABLE 25 INDONESIA AGRICULTURE IN ZEOLITE MARKET, BY APPLICATION, 2018-2032 (USD THOUSAND)
TABLE 26 INDONESIA AGRICULTURE IN ZEOLITE MARKET, BY PRODUCT TYPE, 2018-2032 (USD THOUSAND)
TABLE 27 INDONESIA CONSTRUCTION IN ZEOLITE MARKET, BY APPLICATION, 2018-2032 (USD THOUSAND)
TABLE 28 INDONESIA CONSTRUCTION IN ZEOLITE MARKET, BY PRODUCT TYPE, 2018-2032 (USD THOUSAND)
TABLE 29 INDONESIA ANIMAL HUSBANDRY IN ZEOLITE MARKET, BY APPLICATION, 2018-2032 (USD THOUSAND)
TABLE 30 INDONESIA ANIMAL HUSBANDRY IN ZEOLITE MARKET, BY PRODUCT TYPE, 2018-2032 (USD THOUSAND)
TABLE 31 INDONESIA ENVIRONMENTAL REMEDIATION IN ZEOLITE MARKET, BY APPLICATION, 2018-2032 (USD THOUSAND)
TABLE 32 INDONESIA ENVIRONMENTAL REMEDIATION IN ZEOLITE MARKET, BY PRODUCT TYPE, 2018-2032 (USD THOUSAND)
TABLE 33 INDONESIA CONSUMER PRODUCTS IN ZEOLITE MARKET, BY APPLICATION, 2018-2032 (USD THOUSAND)
TABLE 34 INDONESIA CONSUMER PRODUCTS IN ZEOLITE MARKET, BY PRODUCT TYPE, 2018-2032 (USD THOUSAND)
TABLE 35 INDONESIA HEALTHCARE & PHARMACEUTICALS IN ZEOLITE MARKET, BY APPLICATION, 2018-2032 (USD THOUSAND)
TABLE 36 INDONESIA HEALTHCARE & PHARMACEUTICALS IN ZEOLITE MARKET, BY PRODUCT TYPE, 2018-2032 (USD THOUSAND)
TABLE 37 INDONESIA OTHERS IN ZEOLITE MARKET, BY PRODUCT TYPE, 2018-2032 (USD THOUSAND)
List of Figure
FIGURE 1 INDONESIA ZEOLITE MARKET
FIGURE 2 INDONESIA ZEOLITE MARKET: DATA TRIANGULATION
FIGURE 3 INDONESIA ZEOLITE MARKET: DROC ANALYSIS
FIGURE 4 INDONESIA ZEOLITE MARKET: REGIONAL MARKET ANALYSIS
FIGURE 5 INDONESIA ZEOLITE MARKET: COMPANY RESEARCH ANALYSIS
FIGURE 6 INDONESIA ZEOLITE MARKET: MULTIVARIATE MODELLING
FIGURE 7 INDONESIA ZEOLITE MARKET: INTERVIEW DEMOGRAPHICS
FIGURE 8 INDONESIA ZEOLITE MARKET: DBMR MARKET POSITION GRID
FIGURE 9 INDONESIA ZEOLITE MARKET: VENDOR SHARE ANALYSIS
FIGURE 10 INDONESIA ZEOLITE MARKET: SEGMENTATION
FIGURE 11 EXECUTIVE SUMMARY
FIGURE 12 TWO SEGMENTS COMPRISE THE INDONESIA ZEOLITE MARKET, BY PRODUCT TYPE (2024)
FIGURE 13 RISING DEMAND FOR ECO-FRIENDLY WATER AND AIR PURIFICATION SOLUTIONS IS EXPECTED TO DRIVE THE INDONESIA ZEOLITE MARKET IN THE FORECAST PERIOD (2025-2032)
FIGURE 14 THE SYNTHETIC ZEOLITE SEGMENT IS EXPECTED TO ACCOUNT FOR THE LARGEST SHARE OF THE INDONESIA ZEOLITE MARKET IN 2025 AND 2032
FIGURE 15 PORTER’S FIVE FORCES
FIGURE 16 INDONESIA ZEOLITE MARKET, 2024-2032, AVERAGE SELLING PRICE (USD/TON)
FIGURE 17 NUMBER OF INTERNATIONAL PATENT FAMILIES BY PUBLICATION YEAR
FIGURE 18 DRIVERS, RESTRAINTS, OPPORTUNITIES AND CHALLENGES OF INDONESIA ZEOLITE MARKET
FIGURE 19 INDONESIA ZEOLITE MARKET: BY PRODUCT TYPE, 2024
FIGURE 20 INDONESIA ZEOLITE MARKET, BY GRADE, 2024
FIGURE 21 INDONESIA ZEOLITE MARKET, BY FORM, 2024
FIGURE 22 INDONESIA ZEOLITE MARKET, BY SOURCE, 2024
FIGURE 23 INDONESIA ZEOLITE MARKET, BY PURITY LEVEL, 2024
FIGURE 24 INDONESIA ZEOLITE MARKET, BY PACKAGING TYPE, 2024
FIGURE 25 INDONESIA ZEOLITE MARKET, BY FUNCTIONALITY, 2024
FIGURE 26 INDONESIA ZEOLITE MARKET, BY APPLICATION, 2024
FIGURE 27 INDONESIA ZEOLITE MARKET: COMPANY SHARE 2024 (%)
Data collection and base year analysis are done using data collection modules with large sample sizes. The stage includes obtaining market information or related data through various sources and strategies. It includes examining and planning all the data acquired from the past in advance. It likewise envelops the examination of information inconsistencies seen across different information sources. The market data is analysed and estimated using market statistical and coherent models. Also, market share analysis and key trend analysis are the major success factors in the market report. To know more, please request an analyst call or drop down your inquiry.
The key research methodology used by DBMR research team is data triangulation which involves data mining, analysis of the impact of data variables on the market and primary (industry expert) validation. Data models include Vendor Positioning Grid, Market Time Line Analysis, Market Overview and Guide, Company Positioning Grid, Patent Analysis, Pricing Analysis, Company Market Share Analysis, Standards of Measurement, Global versus Regional and Vendor Share Analysis. To know more about the research methodology, drop in an inquiry to speak to our industry experts.
Data Bridge Market Research is a leader in advanced formative research. We take pride in servicing our existing and new customers with data and analysis that match and suits their goal. The report can be customized to include price trend analysis of target brands understanding the market for additional countries (ask for the list of countries), clinical trial results data, literature review, refurbished market and product base analysis. Market analysis of target competitors can be analyzed from technology-based analysis to market portfolio strategies. We can add as many competitors that you require data about in the format and data style you are looking for. Our team of analysts can also provide you data in crude raw excel files pivot tables (Fact book) or can assist you in creating presentations from the data sets available in the report.


