
Latin America Exosome Therapeutics Market
Market Size in USD Thousand
 USD
15.19 Thousand
USD
48.14 Thousand
2021
2029
USD
15.19 Thousand
USD
48.14 Thousand
2021
2029
| 2022 - 2029 | |
| USD 15.19 Thousand | |
| USD 48.14 Thousand | |
| % | |
Market Analysis and Insights: Latin America Exosome Therapeutics Market
Latin America exosome therapeutics market is expected to gain market growth in the forecast period of 2022 to 2029. Data Bridge Market Research analyses that the market is growing with a CAGR of 15.8% in the forecast period of 2022 to 2029 and is expected to reach USD 48.14 thousand by 2029 from USD 15.19 thousand in 2021. The rising prevalence of chronic inflammatory autoimmune diseases and technological developments in exosome therapeutics are likely to be the major drivers which propel the demand of the market in the forecast period.
The exosomes are a specific class of cell-derived extracellular vesicles composed of endosomes and are typically 30-150 nm in diameter – the smallest type of extracellular vesicle. Protected by a lipid bilayer, the exosomes are pushed into the extracellular environment, which contains a complex cargo of contents derived from the original cell. The contents present in the cargo are proteins, lipids, messenger ribonucleic acid (mRNA), microsomal ribonucleic acid (miRNA), and deoxyribonucleic acid (DNA). The exosomes are distinct by how they are formed – through the fusion and exocytosis of multivesicular bodies into the extracellular space. The exosomes have been connected to treat various chronic conditions such as autoimmune disorders. Nanotechnology has shown novel insights for the prior detection of cancer-based on nanocarriers such as exosomes. Since the exosomes provide strong potential for applicability in therapeutic interventions, the exosomes have been regarded as potential drug carriers.
The exosomes consist of two types, the natural exosomes, and the hybrid exosomes. The natural exosomes are further sub-segmented into exogenous exosomes and autologous exosomes. The autologous exosomes are safe and operative vehicles for the targeted delivery of drugs for the treatment of cancer, autoimmune diseases, and chronic inflammatory diseases. The exogenous exosomes are tiny extracellular membrane vesicles released from endosomes of various cells and can be found in most of the body fluids, such as the synovial fluid, amniotic fluid, and semen. In cancer, exosomes have vital roles in the metastatic spread, drug resistance, and the formation of new blood vessels.
The factors that are expected to act as drivers for the growth of the Latin America exosome therapeutics market are the increased incidence of chronic inflammatory diseases, the rise in research and development activities for exosome therapeutics, and government funding for the development and production of exosome therapeutics. Moreover, the growth potential in the emerging economies for exosome therapeutics and increased use of anti-aging therapy bolsters the exosome therapeutics market growth. However, the rise in cost, the stringent regulations imposed, and the risks observed while using the exosome therapeutics are the restraints that may hinder the market growth. An increase in healthcare expenditure is expected to provide a lucrative opportunity for market growth. On the other hand, rising investments, coupled with a lack of standardized procedures for isolating exosomes as well as non-availability of required expertise, are some of the significant challenges that are expected to affect the market growth.
The Latin America exosome therapeutics market report provides details of market share, new developments, and product pipeline analysis, the impact of domestic and localized market players, analyses opportunities in terms of emerging revenue pockets, changes in market regulations, product approvals, strategic decisions, product launches, geographic expansions, and technological innovations in the market. To understand the analysis and the market scenario, contact us for an Analyst Brief. Our team will help you create a revenue impact solution to achieve your desired goal.
 Latin America Exosome Therapeutics Market Scope And Market Size
Latin America exosome therapeutics market is categorized into seven notable segments which are based on type, source, therapy, transporting capacity, application, route of administration, and end user. The growth among segments helps you analyze niche pockets of growth and strategies to approach the market and determine your core application areas and the difference in your target markets.
- On the basis of type, the Latin America exosome therapeutics market is segmented into natural exosomes and hybrid exosomes. In 2022, the natural exosomes segment is expected to dominate the Latin America exosome therapeutics market due to the rise in cases of metabolic diseases in Latin America and the availability of natural exosomes for treatment.
- On the basis of source, the Latin America exosome therapeutics market is segmented into mesenchymal stem cells, blood, body fluids, urine, dendritic cells, saliva, milk, and others. In 2022, the mesenchymal stem cell segment is expected to dominate the Latin America exosome therapeutics market due to mesenchymal stem cells being used for the treatment of neurodegenerative diseases and fewer side effects.
- On the basis of therapy, the Latin America exosome therapeutics market is segmented into immunotherapy, gene therapy, and chemotherapy. In 2022, the immunotherapy segment is expected to dominate the Latin America exosome therapeutics market due to high accuracy, high effectivity, and exosomes derived from immune cells involved in cancer immunotherapy.
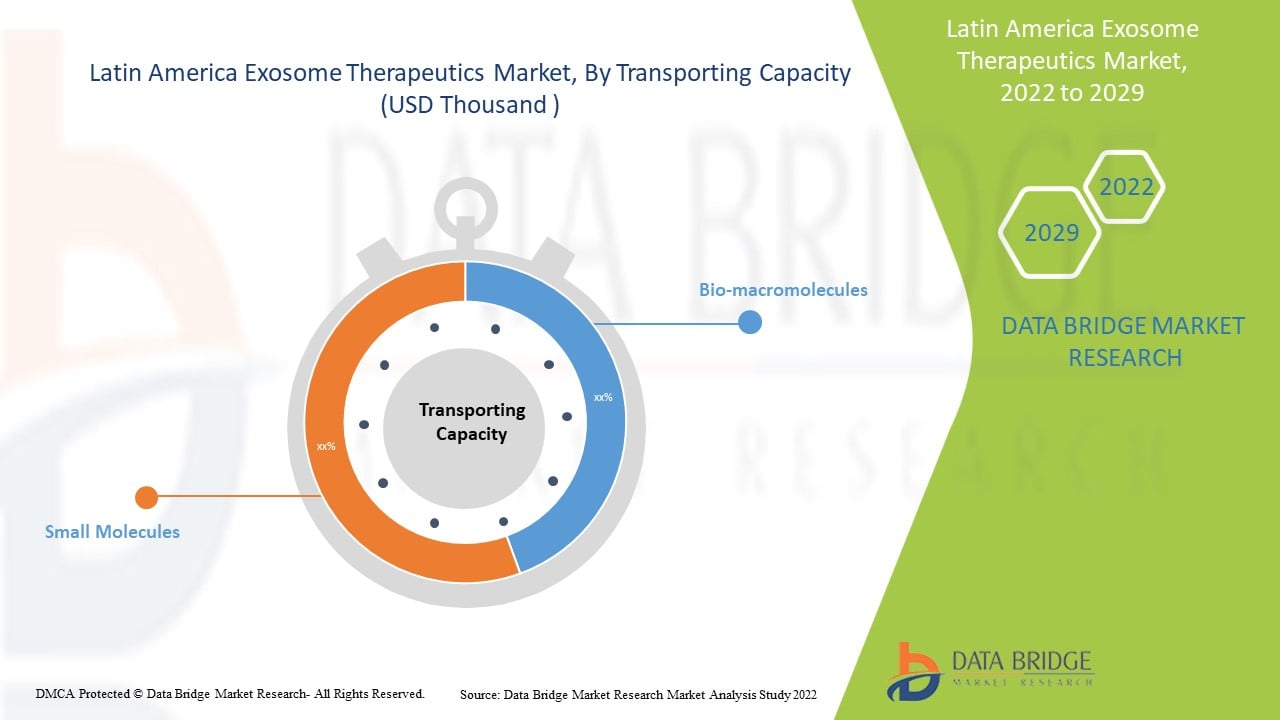
- On the basis of transporting capacity, the Latin America exosome therapeutics market is segmented into bio macromolecules and small molecules. In 2022, the bio macromolecules segment is expected to dominate the Latin America exosome therapeutics market due to the presence of high sensitivity, increased use of protein therapeutics to cure inflammatory disorders in Latin America.
- On the basis of application, the Latin America exosome therapeutics market is segmented into metabolic disorders, oncology, cardiac disorders, neurology, inflammatory disorders, organ transplantation, gynecology disorders, blood disorders, and others. In 2022, the metabolic disorders segment is expected to dominate the Latin America exosome therapeutics market due to the increase in cases of obesity in Brazil and the availability of exosome therapeutics in diagnostic laboratories.
- On the basis of route of administration, the Latin America exosome therapeutics market is segmented into parenteral and oral. In 2022, the parenteral segment is expected to dominate the Latin America exosome therapeutics market due to the immediate onset of action and use of parenteral administration for drugs that are poorly absorbed.
- On the basis of end user, the Latin America exosome therapeutics market is segmented into research and academic institutes, hospitals, and diagnostics centers. In 2022, the research and academic institutes segment is expected to dominate the Latin America exosome therapeutics market due to the rise in research and development of exosomes in Brazil and Argentina.
Latin America Exosome Therapeutics Market Country Level Analysis
Latin America exosome therapeutics market is analyzed, and market size information is provided by type, source, therapy, transporting capacity, application, route of administration, and end user.
The countries covered in the Latin Americaexosome therapeutics market report are Brazil, Argentina, Venezuela, Colombia, Ecuador, Peru, Uruguay, Costa Rica, Panama, Dominican Republic, and the rest of Latin America.
Latin America is expected to grow with a substantial growth rate in the forecast period of 2021 to 2029. South Africa is expected to dominate the Latin America exosome therapeutics market due to increasing R&D activities in the pharma and biotech sector and increasing outsourcing services.
The country section of the report also provides individual market impacting factors and changes in regulation in the market domestically that impact the current and future trends of the market. Data points such as new sales, replacement sales, country demographics, regulatory acts, and import-export tariffs are some of the major pointers used to forecast the market scenario for individual countries. Also, the presence and availability of Latin America brands and their challenges faced due to large or scarce competition from local and domestic brands, the impact of sales channels are considered while providing forecast analysis of the country data.
Growth Potential for the Exosome Therapeutics in Emerging Economies and the Strategic Initiatives by Market Players are Creating new Opportunities in the Latin America Exosome Therapeutics Market
Latin America exosome therapeutics market also provides you with detailed market analysis for every country's growth in a particular industry with the exosome therapeutics sales, impact of advancement in the exosome therapeutics, and changes in regulatory scenarios with their support for the Latin America exosome therapeutics market. The data is available for the historic period 2011 to 2020.
Competitive Landscape and Latin America Exosome Therapeutics Market Share Analysis
Latin America exosome therapeutics market competitive landscape provides details by the competitor. Details included are company overview, company financials, revenue generated, market potential, investment in research and development, new market initiatives, production sites and facilities, company strengths and weaknesses, product launch, product trials pipelines, product approvals, patents, product width, and breadth, application dominance, technology lifeline curve. The above data points provided are only related to the company's focus related to the exosome therapeutics market.
The major company providing exosome therapeutics in Latin America is Kimera Labs.
DBMR analysts understand competitive strengths and provide competitive analysis for each competitor separately.
The strategic initiatives by the market player and new technological advancements for Latin America exosome therapeutics are bridging the gap for the treatment of inflammatory diseases.
For instance,
- In January 2020, Kimera Labs had received the FDA approval for the purest mesenchymal stem cell (MSC) exosomes in existence. The approval received would ensure strict compliance with good laboratory practices (GLPs) and current good manufacturing practice (CGMP) standards to enable the production of pharmaceutical-grade exosomes for investigational trials and the development of future clinical applications
Collaboration, joint ventures, and other strategies by the market player are enhancing the company market in the Latin America exosome therapeutics market, which also provides the benefit for the organization to improve their offering for treatment products.
SKU-

- Interactive Data Analysis Dashboard
- Company Analysis Dashboard for high growth potential opportunities
- Research Analyst Access for customization & queries
- Competitor Analysis with Interactive dashboard
- Latest News, Updates & Trend analysis
- Harness the Power of Benchmark Analysis for Comprehensive Competitor Tracking
Table of Content
1 INTRODUCTION
1.1 OBJECTIVES OF THE STUDY
1.2 MARKET DEFINITION
1.3 OVERVIEW OF THE LATIN AMERICA EXOSOME THERAPEUTICS MARKET
1.4 CURRENCY AND PRICING
1.5 LIMITATIONS
1.6 MARKETS COVERED
2 LATIN AMERICA EXOSOME THERAPEUTICS MARKET: SEGMENTATION
2.1 MARKETS COVERED
2.2 GEOGRAPHICAL SCOPE
2.3 YEARS CONSIDERED FOR THE STUDY
2.4 DBMR TRIPOD DATA VALIDATION MODEL
2.5 PRIMARY INTERVIEWS WITH KEY OPINION LEADERS
2.6 MULTIVARIATE MODELLING
2.7 TYPE SEGMENT LIFELINE CURVE
2.8 DBMR MARKET POSITION GRID
2.9 VENDOR SHARE ANALYSIS
2.1 MARKET END USER COVERAGE GRID
2.11 SECONDARY SOURCES
2.12 ASSUMPTIONS
3 EXECUTIVE SUMMARY
4 PREMIUM INSIGHTS
5 PIPELINE ANALYSIS
6 LATIN AMERICA EXOSOME THERAPEUTICS MARKET: REGULATIONS
7 MARKET OVERVIEW
7.1 DRIVERS
7.1.1 RISING PREVALENCE OF CHRONIC INFLAMMATION, AUTOIMMUNE DISEASE, LYME DISEASE, AND OTHER CHRONIC DEGENERATIVE DISEASES
7.1.2 RISE IN INCIDENCE OF ONCOLOGY DISEASES
7.1.3 TECHNOLOGICAL ADVANCEMENTS IN EXOSOME THERAPEUTICS
7.1.4 RISE IN RESEARCH AND DEVELOPMENT ACTIVITIES, INVOLVED IN EXOSOME THERAPEUTICS
7.1.5 GOVERNMENT FUNDING FOR THE DEVELOPMENT AND PRODUCTION OF EXOSOME THERAPEUTICS
7.2 RESTRAINTS
7.2.1 HIGH COST ASSOCIATED WITH THE EXOSOME THERAPEUTICS
7.2.2 LACK OF AUTHENTICATION REQUIREMENTS FOR ISOLATION OF EXOSOMES
7.2.3 RISKS OBSERVED WHILE USING EXOSOME THERAPEUTICS
7.2.4 UNMET MEDICAL NEEDS
7.3 OPPORTUNITIES
7.3.1 INCREASE USE OF ANTI-AGING THERAPY
7.3.2 STRATEGIC INITIATIVES BY MARKET PLAYERS
7.3.3 RISE IN HEALTHCARE EXPENDITURE
7.3.4 AVAILABILITY OF VARIOUS EXOSOME ISOLATION AND PURIFICATION TECHNIQUES
7.3.5 PROGRESSING THERAPEUTIC VALUE OF EXOSOME
7.4 CHALLENGES
7.4.1 THE SHORTAGE OF SKILLED PROFESSIONALS REQUIRED FOR THE ISOLATION OF EXOSOME
7.4.2 LATE APPROVAL ASSOCIATED WITH PRODUCT LAUNCHES
8 IMPACT OF COVID-19 ON LATIN AMERICA EXOSOME THERAPEUTICS MARKET
8.1 IMPACT ON PRICE
8.2 IMPACT ON DEMAND
8.3 IMPACT ON SUPPLY CHAIN
8.4 STRATEGIC DECISIONS BY MANUFACTURERS
8.5 CONCLUSION
9 LATIN AMERICA EXOSOME THERAPEUTICS MARKET, BY TYPE
9.1 OVERVIEW
9.2 NATURAL EXOSOMES
9.2.1 AUTOLOGOUS EXOSOMES
9.2.2 EXOGENOUS EXOSOMES
9.3 HYBRID EXOSOMES
10 LATIN AMERICA EXOSOME THERAPEUTICS MARKET, BY SOURCE
10.1 OVERVIEW
10.2 MESENCHYMAL STEM CELLS
10.3 BLOOD
10.3.1 T-LYMPHOCYTES
10.3.2 OTHERS
10.4 BODY FLUIDS
10.4.1 AMNIOTIC FLUID
10.4.2 SEMEN
10.4.3 SYNOVIAL FLUID
10.4.4 OTHERS
10.5 URINE
10.6 DENDRITIC CELLS
10.7 SALIVA
10.8 MILK
10.9 OTHERS
11 LATIN AMERICA EXOSOME THERAPEUTICS MARKET, BY THERAPY
11.1 OVERVIEW
11.2 IMMUNOTHERAPY
11.3 GENE THERAPY
11.4 CHEMOTHERAPY
12 LATIN AMERICA EXOSOME THERAPEUTICS MARKET, BY TRANSPORTING CAPACITY
12.1 OVERVIEW
12.2 BIO MACROMOLECULES
12.2.1 NUCLEIC ACIDS
12.2.2 PROTEINS
12.2.3 PEPTIDES
12.3 SMALL MOLECULES
13 LATIN AMERICA EXOSOME THERAPEUTICS MARKET, BY APPLICATION
13.1 OVERVIEW
13.2 METABOLIC DISORDERS
13.3 ONCOLOGY
13.3.1 NON-SMALL CELL LUNG CANCER
13.3.2 BREAST CANCER
13.3.3 GASTRIC CANCER
13.3.4 HEAD AND NECK CANCER
13.3.5 OTHERS
13.4 CARDIAC DISORDERS
13.5 NEUROLOGY
13.5.1 ALZHEIMER'S DISEASE
13.5.2 PARKINSON'S DISEASE
13.5.3 OTHERS
13.6 INFLAMMATORY DISORDERS
13.7 ORGAN TRANSPLANTATION
13.8 GYNECOLOGY DISORDERS
13.9 BLOOD DISORDERS
13.1 OTHERS
14 LATIN AMERICA EXOSOME THERAPEUTICS MARKET, BY ROUTE OF ADMINISTRATION
14.1 OVERVIEW
14.2 PARENTERAL
14.3 ORAL
15 LATIN AMERICA EXOSOME THERAPEUTICS MARKET, BY END USER
15.1 OVERVIEW
15.2 RESEARCH AND ACADEMIC INSTITUTES
15.3 HOSPITALS
15.4 DIAGNOSTIC CENTERS
16 LATIN AMERICA EXOSOME THERAPEUTICS MARKET, BY REGION
16.1 LATIN AMERICA
16.1.1 BRAZIL
16.1.2 ARGENTINA
16.1.3 VENEZUELA
16.1.4 COLOMBIA
16.1.5 ECUADOR
16.1.6 PERU
16.1.7 URUGUAY
16.1.8 COSTA RICA
16.1.9 PANAMA
16.1.10 DOMINICAN REPUBLIC
16.1.11 REST OF LATIN AMERICA
17 LATIN AMERICA EXOSOME THERAPEUTICS MARKET: COMPANY LANDSCAPE
17.1 COMPANY SHARE ANALYSIS: LATIN AMERICA
18 COMPANY PROFILE
18.1 KIMERA LABS
18.1.1 COMPANY SNAPSHOT
18.1.2 COMPANY SHARE ANALYSIS
18.1.3 PRODUCT PORTFOLIO
18.1.4 RECENT DEVELOPMENTS
18.2 STEM CELLS GROUP
18.2.1 COMPANY SNAPSHOT
18.2.2 COMPANY SHARE ANALYSIS
18.2.3 PRODUCT PORTFOLIO
18.2.4 RECENT DEVELOPMENTS
18.3 AEGLE THERAPEUTICS
18.3.1 COMPANY SNAPSHOT
18.3.2 PRODUCT PORTFOLIO
18.3.3 RECENT DEVELOPMENTS
18.4 AVALON GLOBOCARE CORP.(2021)
18.4.1 COMPANY SNAPSHOT
18.4.2 REVENUE ANALYSIS
18.4.3 PRODUCT PORTFOLIO
18.4.4 RECENT DEVELOPMENTS
18.5 CAPRICOR THERAPEUTICS (2021)
18.5.1 COMPANY SNAPSHOT
18.5.2 REVENUE ANALYSIS
18.5.3 PRODUCT PORTFOLIO
18.5.4 RECENT DEVELOPMENTS
18.6 CODIAK (2021)
18.6.1 COMPANY SNAPSHOT
18.6.2 REVENUE ANALYSIS
18.6.3 PRODUCT PORTFOLIO
18.6.4 RECENT DEVELOPMENTS
18.7 EXOSOME SCIENCES (A SUBSIDIARY OF AETHLON MEDICAL) (2021)
18.7.1 COMPANY SNAPSHOT
18.7.2 REVENUE ANALYSIS
18.7.3 PRODUCT PORTFOLIO
18.7.4 RECENT DEVELOPMENTS NO RECENT DEVELOPMENTS
18.8 EXOPHARM
18.8.1 COMPANY SNAPSHOT
18.8.2 PRODUCT PORTFOLIO
18.8.3 RECENT DEVELOPMENTS
18.9 EVOX THERAPEUTICS
18.9.1 COMPANY SNAPSHOT
18.9.2 PRODUCT PORTFOLIO
18.9.3 RECENT DEVELOPMENTS
18.1 EV THERAPEUTICS
18.10.1 COMPANY SNAPSHOT
18.10.2 PRODUCT PORTFOLIO
18.10.3 RECENT DEVELOPMENTS
18.11 JAZZ PHARMACEUTICALS, INC
18.11.1 COMPANY SNAPSHOT
18.11.2 REVENUE ANALYSIS
18.11.3 PRODUCT PORTFOLIO
18.11.4 RECENT DEVELOPMENTS
18.12 RENEURON GROUP PLC
18.12.1 COMPANY SNAPSHOT
18.12.2 REVENUE ANALYSIS
18.12.3 PRODUCT PORTFOLIO
18.12.4 RECENT DEVELOPMENTS
18.13 STEM CELL MEDICINE
18.13.1 COMPANY SNAPSHOT
18.13.2 PRODUCT PORTFOLIO
18.13.3 RECENT DEVELOPMENTS
19 QUESTIONNAIRE
20 RELATED REPORTS
List of Table
TABLE 1 LATIN AMERICA EXOSOME THERAPEUTICSMARKET, PIPELINE ANALYSIS
TABLE 2 LATIN AMERICA EXOSOME THERAPEUTICS MARKET, BY TYPE, 2020-2029 (USD THOUSAND)
TABLE 3 LATIN AMERICA NATURAL EXOSOMES IN EXOSOME THERAPEUTICS MARKET, BY REGION, 2020-2029 (USD THOUSAND)
TABLE 4 LATIN AMERICA NATURAL EXOSOMES IN EXOSOME THERAPEUTICS MARKET, BY TYPE, 2020-2029 (USD THOUSAND)
TABLE 5 LATIN AMERICA HYBRID EXOSOMES IN EXOSOME THERAPEUTICS MARKET, BY REGION, 2020-2029 (USD THOUSAND)
TABLE 6 LATIN AMERICA EXOSOME THERAPEUTICS MARKET, BY SOURCE, 2020-2029 (USD THOUSAND)
TABLE 7 LATIN AMERICA MESENCHYMAL STEM CELLS IN EXOSOME THERAPEUTICS MARKET, BY REGION, 2020-2029 (USD THOUSAND)
TABLE 8 LATIN AMERICA BLOOD IN EXOSOME THERAPEUTICS MARKET, BY REGION, 2020-2029 (USD THOUSAND)
TABLE 9 LATIN AMERICA BLOOD IN EXOSOME THERAPEUTICS MARKET, BY SOURCE, 2020-2029 (USD THOUSAND)
TABLE 10 LATIN AMERICA BODY FLUIDS IN EXOSOME THERAPEUTICS MARKET, BY REGION, 2020-2029 (USD THOUSAND)
TABLE 11 LATIN AMERICA BLOOD IN EXOSOME THERAPEUTICS MARKET, BY SOURCE, 2020-2029 (USD THOUSAND)
TABLE 12 LATIN AMERICA URINE IN EXOSOME THERAPEUTICS MARKET, BY REGION, 2020-2029 (USD THOUSAND)
TABLE 13 LATIN AMERICA DENDRITIC CELLS IN EXOSOME THERAPEUTICS MARKET, BY REGION, 2020-2029 (USD THOUSAND)
TABLE 14 LATIN AMERICA SALIVA IN EXOSOME THERAPEUTICS MARKET, BY REGION, 2020-2029 (USD THOUSAND)
TABLE 15 LATIN AMERICA MILK IN EXOSOME THERAPEUTICS MARKET, BY REGION, 2020-2029 (USD THOUSAND)
TABLE 16 LATIN AMERICA OTHERS IN EXOSOME THERAPEUTICS MARKET, BY REGION, 2020-2029 (USD THOUSAND)
TABLE 17 LATIN AMERICA EXOSOME THERAPEUTICS MARKET, BY THERAPY, 2020-2029 (USD THOUSAND)
TABLE 18 LATIN AMERICA IMMUNOTHERAPY IN EXOSOME THERAPEUTICS MARKET, BY REGION, 2020-2029 (USD THOUSAND)
TABLE 19 LATIN AMERICA GENE THERAPY IN EXOSOME THERAPEUTICS MARKET, BY REGION, 2020-2029 (USD THOUSAND)
TABLE 20 LATIN AMERICA CHEMOTHERAPY IN EXOSOME THERAPEUTICS MARKET, BY REGION, 2020-2029 (USD THOUSAND)
TABLE 21 LATIN AMERICA EXOSOME THERAPEUTICS MARKET, BY TRANSPORTING CAPACITY, 2020-2029 (USD THOUSAND)
TABLE 22 LATIN AMERICA BIO MACROMOLECULES IN EXOSOME THERAPEUTICS MARKET, BY REGION, 2020-2029 (USD THOUSAND)
TABLE 23 LATIN AMERICA BIO MACROMOLECULES IN EXOSOME THERAPEUTICS MARKET, BY TRANSPORTING CAPACITY, 2020-2029 (USD THOUSAND)
TABLE 24 LATIN AMERICA SMALL MOLECULES IN EXOSOME THERAPEUTICS MARKET, BY REGION, 2020-2029 (USD THOUSAND)
TABLE 25 LATIN AMERICA EXOSOME THERAPEUTICS MARKET, BY APPLICATION, 2020-2029 (USD THOUSAND)
TABLE 26 LATIN AMERICA METABOLIC DISORDERS IN EXOSOME THERAPEUTICS MARKET, BY REGION, 2020-2029 (USD THOUSAND)
TABLE 27 LATIN AMERICA ONCOLOGY IN EXOSOME THERAPEUTICS MARKET, BY REGION, 2020-2029 (USD THOUSAND)
TABLE 28 LATIN AMERICA ONCOLOGY IN LATIN AMERICA EXOSOME THERAPEUTICS MARKET, BY APPLICATION, 2020-2029 (USD THOUSAND)
TABLE 29 LATIN AMERICA CARDIAC DISORDERS IN EXOSOME THERAPEUTICS MARKET, BY REGION, 2020-2029 (USD THOUSAND)
TABLE 30 LATIN AMERICA NEUROLOGY IN EXOSOME THERAPEUTICS MARKET, BY REGION, 2020-2029 (USD THOUSAND)
TABLE 31 LATIN AMERICA NEUROLOGY IN EXOSOME THERAPEUTICS MARKET, BY APPLICATION, 2020-2029 (USD THOUSAND)
TABLE 32 LATIN AMERICA INFLAMMATORY DISORDERS IN EXOSOME THERAPEUTICS MARKET, BY REGION, 2020-2029 (USD THOUSAND)
TABLE 33 LATIN AMERICA ORGAN TRANSPLANTATION IN EXOSOME THERAPEUTICS MARKET, BY REGION, 2020-2029 (USD THOUSAND)
TABLE 34 LATIN AMERICA GYNECOLOGY DISORDERS IN EXOSOME THERAPEUTICS MARKET, BY REGION, 2020-2029 (USD THOUSAND)
TABLE 35 LATIN AMERICA BLOOD DISORDERS IN EXOSOME THERAPEUTICS MARKET, BY REGION, 2020-2029 (USD THOUSAND)
TABLE 36 LATIN AMERICA OTHERS IN EXOSOME THERAPEUTICS MARKET, BY REGION, 2020-2029 (USD THOUSAND)
TABLE 37 LATIN AMERICA EXOSOME THERAPEUTICS MARKET, BY ROUTE OF ADMINISTRATION, 2020-2029 (USD THOUSAND)
TABLE 38 LATIN AMERICA PARENTERAL IN EXOSOME THERAPEUTICS MARKET, BY REGION, 2020-2029 (USD THOUSAND)
TABLE 39 LATIN AMERICA ORAL IN EXOSOME THERAPEUTICS MARKET, BY REGION, 2020-2029 (USD THOUSAND)
TABLE 40 LATIN AMERICA EXOSOME THERAPEUTICS MARKET, BY END USER, 2020-2029 (USD THOUSAND)
TABLE 41 LATIN AMERICA RESEARCH AND ACADEMIC INSTITUTES IN EXOSOME THERAPEUTICS MARKET, BY REGION, 2020-2029 (USD THOUSAND)
TABLE 42 LATIN AMERICA HOSPITALS IN EXOSOME THERAPEUTICS MARKET, BY REGION, 2020-2029 (USD THOUSAND)
TABLE 43 LATIN AMERICA DIAGNOSTIC CENTERS IN EXOSOME THERAPEUTICS MARKET, BY REGION, 2020-2029 (USD THOUSAND)
TABLE 44 LATIN AMERICA EXOSOME THERAPEUTICS, BY COUNTRY, 2020-2029 (USD THOUSAND)
TABLE 45 LATIN AMERICA EXOSOME THERAPEUTICS MARKET, BY TYPE, 2020-2029 (USD THOUSAND)
TABLE 46 LATIN AMERICA NATURAL EXOSOMES IN EXOSOME THERAPEUTICS MARKET, BY TYPE, 2020-2029 (USD THOUSAND)
TABLE 47 LATIN AMERICA EXOSOME THERAPEUTICS MARKET, BY SOURCE, 2020-2029 (USD THOUSAND)
TABLE 48 LATIN AMERICA BLOOD IN EXOSOME THERAPEUTICS MARKET, BY SOURCE, 2020-2029 (USD THOUSAND)
TABLE 49 LATIN AMERICA BODY FLUIDS IN EXOSOME THERAPEUTICS MARKET, BY SOURCE, 2020-2029 (USD THOUSAND)
TABLE 50 LATIN AMERICA EXOSOME THERAPEUTICS MARKET, BY THERAPY, 2020-2029 (USD THOUSAND)
TABLE 51 LATIN AMERICA EXOSOME THERAPEUTICS MARKET, BY TRANSPORTING CAPACITY, 2020-2029 (USD THOUSAND)
TABLE 52 LATIN AMERICA BIO MACROMOLECULES IN EXOSOME THERAPEUTICS MARKET, BY TRANSPORTING CAPACITY, 2020-2029 (USD THOUSAND)
TABLE 53 LATIN AMERICA EXOSOME THERAPEUTICS MARKET, BY APPLICATION, 2020-2029 (USD THOUSAND)
TABLE 54 LATIN AMERICA ONCOLOGY IN EXOSOME THERAPEUTICS MARKET, BY APPLICATION, 2020-2029 (USD THOUSAND)
TABLE 55 LATIN AMERICA NEUROLOGY IN EXOSOME THERAPEUTICS MARKET, BY APPLICATION, 2020-2029 (USD THOUSAND)
TABLE 56 LATIN AMERICA EXOSOME THERAPEUTICS MARKET, BY ROUTE OF ADMINISTRATION, 2020-2029 (USD THOUSAND)
TABLE 57 LATIN AMERICA EXOSOME THERAPEUTICS MARKET, BY END USER, 2020-2029 (USD THOUSAND)
TABLE 58 BRAZIL EXOSOME THERAPEUTICS MARKET, BY TYPE, 2020-2029 (USD THOUSAND)
TABLE 59 BRAZIL NATURAL EXOSOMES IN EXOSOME THERAPEUTICS MARKET, BY TYPE, 2020-2029 (USD THOUSAND)
TABLE 60 BRAZIL EXOSOME THERAPEUTICS MARKET, BY SOURCE, 2020-2029 (USD THOUSAND)
TABLE 61 BRAZIL BLOOD IN EXOSOME THERAPEUTICS MARKET, BY SOURCE, 2020-2029 (USD THOUSAND)
TABLE 62 BRAZIL BODY FLUIDS IN EXOSOME THERAPEUTICS MARKET, BY SOURCE, 2020-2029 (USD THOUSAND)
TABLE 63 BRAZIL EXOSOME THERAPEUTICS MARKET, BY THERAPY, 2020-2029 (USD THOUSAND)
TABLE 64 BRAZIL EXOSOME THERAPEUTICS MARKET, BY TRANSPORTING CAPACITY, 2020-2029 (USD THOUSAND)
TABLE 65 BRAZIL BIO MACROMOLECULES IN EXOSOME THERAPEUTICS MARKET, BY TRANSPORTING CAPACITY, 2020-2029 (USD THOUSAND)
TABLE 66 BRAZIL EXOSOME THERAPEUTICS MARKET, BY APPLICATION, 2020-2029 (USD THOUSAND)
TABLE 67 BRAZIL ONCOLOGY IN EXOSOME THERAPEUTICS MARKET, BY APPLICATION, 2020-2029 (USD THOUSAND)
TABLE 68 BRAZIL NEUROLOGY IN EXOSOME THERAPEUTICS MARKET, BY APPLICATION, 2020-2029 (USD THOUSAND)
TABLE 69 BRAZIL EXOSOME THERAPEUTICS MARKET, BY ROUTE OF ADMINISTRATION, 2020-2029 (USD THOUSAND)
TABLE 70 BRAZIL EXOSOME THERAPEUTICS MARKET, BY END USER, 2020-2029 (USD THOUSAND)
TABLE 71 ARGENTINA EXOSOME THERAPEUTICS MARKET, BY TYPE, 2020-2029 (USD THOUSAND)
TABLE 72 ARGENTINA NATURAL EXOSOMES IN EXOSOME THERAPEUTICS MARKET, BY TYPE, 2020-2029 (USD THOUSAND)
TABLE 73 ARGENTINA EXOSOME THERAPEUTICS MARKET, BY SOURCE, 2020-2029 (USD THOUSAND)
TABLE 74 ARGENTINA BLOOD IN EXOSOME THERAPEUTICS MARKET, BY SOURCE, 2020-2029 (USD THOUSAND)
TABLE 75 ARGENTINA BODY FLUIDS IN EXOSOME THERAPEUTICS MARKET, BY SOURCE, 2020-2029 (USD THOUSAND)
TABLE 76 ARGENTINA EXOSOME THERAPEUTICS MARKET, BY THERAPY, 2020-2029 (USD THOUSAND)
TABLE 77 ARGENTINA EXOSOME THERAPEUTICS MARKET, BY TRANSPORTING CAPACITY, 2020-2029 (USD THOUSAND)
TABLE 78 ARGENTINA BIO MACROMOLECULES IN EXOSOME THERAPEUTICS MARKET, BY TRANSPORTING CAPACITY, 2020-2029 (USD THOUSAND)
TABLE 79 ARGENTINA EXOSOME THERAPEUTICS MARKET, BY APPLICATION, 2020-2029 (USD THOUSAND)
TABLE 80 ARGENTINA ONCOLOGY IN EXOSOME THERAPEUTICS MARKET, BY APPLICATION, 2020-2029 (USD THOUSAND)
TABLE 81 ARGENTINA NEUROLOGY IN EXOSOME THERAPEUTICS MARKET, BY APPLICATION, 2020-2029 (USD THOUSAND)
TABLE 82 ARGENTINA EXOSOME THERAPEUTICS MARKET, BY ROUTE OF ADMINISTRATION, 2020-2029 (USD THOUSAND)
TABLE 83 ARGENTINA EXOSOME THERAPEUTICS MARKET, BY END USER, 2020-2029 (USD THOUSAND)
TABLE 84 VENEZUELA EXOSOME THERAPEUTICS MARKET, BY TYPE, 2020-2029 (USD THOUSAND)
TABLE 85 VENEZUELA NATURAL EXOSOMES IN EXOSOME THERAPEUTICS MARKET, BY TYPE, 2020-2029 (USD THOUSAND)
TABLE 86 VENEZUELA EXOSOME THERAPEUTICS MARKET, BY SOURCE, 2020-2029 (USD THOUSAND)
TABLE 87 VENEZUELA BLOOD IN EXOSOME THERAPEUTICS MARKET, BY SOURCE, 2020-2029 (USD THOUSAND)
TABLE 88 VENEZUELA BODY FLUIDS IN EXOSOME THERAPEUTICS MARKET, BY SOURCE, 2020-2029 (USD THOUSAND)
TABLE 89 VENEZUELA EXOSOME THERAPEUTICS MARKET, BY THERAPY, 2020-2029 (USD THOUSAND)
TABLE 90 VENEZUELA EXOSOME THERAPEUTICS MARKET, BY TRANSPORTING CAPACITY, 2020-2029 (USD THOUSAND)
TABLE 91 VENEZUELA BIO MACROMOLECULES IN EXOSOME THERAPEUTICS MARKET, BY TRANSPORTING CAPACITY, 2020-2029 (USD THOUSAND)
TABLE 92 VENEZUELA EXOSOME THERAPEUTICS MARKET, BY APPLICATION, 2020-2029 (USD THOUSAND)
TABLE 93 VENEZUELA ONCOLOGY IN EXOSOME THERAPEUTICS MARKET, BY APPLICATION, 2020-2029 (USD THOUSAND)
TABLE 94 VENEZUELA NEUROLOGY IN EXOSOME THERAPEUTICS MARKET, BY APPLICATION, 2020-2029 (USD THOUSAND)
TABLE 95 VENEZUELA EXOSOME THERAPEUTICS MARKET, BY ROUTE OF ADMINISTRATION, 2020-2029 (USD THOUSAND)
TABLE 96 VENEZUELA EXOSOME THERAPEUTICS MARKET, BY END USER, 2020-2029 (USD THOUSAND)
TABLE 97 COLOMBIA EXOSOME THERAPEUTICS MARKET, BY TYPE, 2020-2029 (USD THOUSAND)
TABLE 98 COLOMBIA NATURAL EXOSOMES IN EXOSOME THERAPEUTICS MARKET, BY TYPE, 2020-2029 (USD THOUSAND)
TABLE 99 COLOMBIA EXOSOME THERAPEUTICS MARKET, BY SOURCE, 2020-2029 (USD THOUSAND)
TABLE 100 COLOMBIA BLOOD IN EXOSOME THERAPEUTICS MARKET, BY SOURCE, 2020-2029 (USD THOUSAND)
TABLE 101 COLOMBIA BODY FLUIDS IN EXOSOME THERAPEUTICS MARKET, BY SOURCE, 2020-2029 (USD THOUSAND)
TABLE 102 COLOMBIA EXOSOME THERAPEUTICS MARKET, BY THERAPY, 2020-2029 (USD THOUSAND)
TABLE 103 COLOMBIA EXOSOME THERAPEUTICS MARKET, BY TRANSPORTING CAPACITY, 2020-2029 (USD THOUSAND)
TABLE 104 COLOMBIA BIO MACROMOLECULES EXOSOME THERAPEUTICS MARKET, BY TRANSPORTING CAPACITY, 2020-2029 (USD THOUSAND)
TABLE 105 COLOMBIA EXOSOME THERAPEUTICS MARKET, BY APPLICATION, 2020-2029 (USD THOUSAND)
TABLE 106 COLOMBIA ONCOLOGY IN EXOSOME THERAPEUTICS MARKET, BY APPLICATION, 2020-2029 (USD THOUSAND)
TABLE 107 COLOMBIA NEUROLOGY IN EXOSOME THERAPEUTICS MARKET, BY APPLICATION, 2020-2029 (USD THOUSAND)
TABLE 108 COLOMBIA EXOSOME THERAPEUTICS MARKET, BY ROUTE OF ADMINISTRATION, 2020-2029 (USD THOUSAND)
TABLE 109 COLOMBIA EXOSOME THERAPEUTICS MARKET, BY END USER, 2020-2029 (USD THOUSAND)
TABLE 110 ECUADOR EXOSOME THERAPEUTICS MARKET, BY TYPE, 2020-2029 (USD THOUSAND)
TABLE 111 ECUADOR NATURAL EXOSOMES IN EXOSOME THERAPEUTICS MARKET, BY TYPE, 2020-2029 (USD THOUSAND)
TABLE 112 ECUADOR EXOSOME THERAPEUTICS MARKET, BY SOURCE, 2020-2029 (USD THOUSAND)
TABLE 113 ECUADOR BLOOD IN EXOSOME THERAPEUTICS MARKET, BY SOURCE, 2020-2029 (USD THOUSAND)
TABLE 114 ECUADOR BODY FLUIDS IN EXOSOME THERAPEUTICS MARKET, BY SOURCE, 2020-2029 (USD THOUSAND)
TABLE 115 ECUADOR EXOSOME THERAPEUTICS MARKET, BY THERAPY, 2020-2029 (USD THOUSAND)
TABLE 116 ECUADOR EXOSOME THERAPEUTICS MARKET, BY TRANSPORTING CAPACITY, 2020-2029 (USD THOUSAND)
TABLE 117 ECUADOR BIO MACROMOLECULES IN EXOSOME THERAPEUTICS MARKET, BY TRANSPORTING CAPACITY, 2020-2029 (USD THOUSAND)
TABLE 118 ECUADOR EXOSOME THERAPEUTICS MARKET, BY APPLICATION, 2020-2029 (USD THOUSAND)
TABLE 119 ECUADOR ONCOLOGY IN EXOSOME THERAPEUTICS MARKET, BY APPLICATION, 2020-2029 (USD THOUSAND)
TABLE 120 ECUADOR NEUROLOGY IN EXOSOME THERAPEUTICS MARKET, BY APPLICATION, 2020-2029 (USD THOUSAND)
TABLE 121 ECUADOR EXOSOME THERAPEUTICS MARKET, BY ROUTE OF ADMINISTRATION, 2020-2029 (USD THOUSAND)
TABLE 122 ECUADOR EXOSOME THERAPEUTICS MARKET, BY END USER, 2020-2029 (USD THOUSAND)
TABLE 123 PERU EXOSOME THERAPEUTICS MARKET, BY TYPE, 2020-2029 (USD THOUSAND)
TABLE 124 PERU NATURAL EXOSOMES IN EXOSOME THERAPEUTICS MARKET, BY TYPE, 2020-2029 (USD THOUSAND)
TABLE 125 PERU EXOSOME THERAPEUTICS MARKET, BY SOURCE, 2020-2029 (USD THOUSAND)
TABLE 126 PERU BLOOD IN EXOSOME THERAPEUTICS MARKET, BY SOURCE, 2020-2029 (USD THOUSAND)
TABLE 127 PERU BODY FLUIDS IN EXOSOME THERAPEUTICS MARKET, BY SOURCE, 2020-2029 (USD THOUSAND)
TABLE 128 PERU EXOSOME THERAPEUTICS MARKET, BY THERAPY, 2020-2029 (USD THOUSAND)
TABLE 129 PERU EXOSOME THERAPEUTICS MARKET, BY TRANSPORTING CAPACITY, 2020-2029 (USD THOUSAND)
TABLE 130 PERU BIO MACROMOLECULES IN EXOSOME THERAPEUTICS MARKET, BY TRANSPORTING CAPACITY, 2020-2029 (USD THOUSAND)
TABLE 131 PERU EXOSOME THERAPEUTICS MARKET, BY APPLICATION, 2020-2029 (USD THOUSAND)
TABLE 132 PERU ONCOLOGY IN EXOSOME THERAPEUTICS MARKET, BY APPLICATION, 2020-2029 (USD THOUSAND)
TABLE 133 PERU NEUROLOGY IN EXOSOME THERAPEUTICS MARKET, BY APPLICATION, 2020-2029 (USD THOUSAND)
TABLE 134 PERU EXOSOME THERAPEUTICS MARKET, BY ROUTE OF ADMINISTRATION, 2020-2029 (USD THOUSAND)
TABLE 135 PERU EXOSOME THERAPEUTICS MARKET, BY END USER, 2020-2029 (USD THOUSAND)
TABLE 136 URUGUAY EXOSOME THERAPEUTICS MARKET, BY TYPE, 2020-2029 (USD THOUSAND)
TABLE 137 URUGUAY NATURAL EXOSOMES IN EXOSOME THERAPEUTICS MARKET, BY TYPE, 2020-2029 (USD THOUSAND)
TABLE 138 URUGUAY EXOSOME THERAPEUTICS MARKET, BY SOURCE, 2020-2029 (USD THOUSAND)
TABLE 139 URUGUAY BLOOD IN EXOSOME THERAPEUTICS MARKET, BY SOURCE, 2020-2029 (USD THOUSAND)
TABLE 140 URUGUAY BODY FLUIDS IN EXOSOME THERAPEUTICS MARKET, BY SOURCE, 2020-2029 (USD THOUSAND)
TABLE 141 URUGUAY EXOSOME THERAPEUTICS MARKET, BY THERAPY, 2020-2029 (USD THOUSAND)
TABLE 142 URUGUAY EXOSOME THERAPEUTICS MARKET, BY TRANSPORTING CAPACITY, 2020-2029 (USD THOUSAND)
TABLE 143 URUGUAY BIO MACROMOLECULES IN EXOSOME THERAPEUTICS MARKET, BY TRANSPORTING CAPACITY, 2020-2029 (USD THOUSAND)
TABLE 144 URUGUAY EXOSOME THERAPEUTICS MARKET, BY APPLICATION, 2020-2029 (USD THOUSAND)
TABLE 145 URUGUAY ONCOLOGY IN EXOSOME THERAPEUTICS MARKET, BY APPLICATION, 2020-2029 (USD THOUSAND)
TABLE 146 URUGUAY NEUROLOGY IN EXOSOME THERAPEUTICS MARKET, BY APPLICATION, 2020-2029 (USD THOUSAND)
TABLE 147 URUGUAY EXOSOME THERAPEUTICS MARKET, BY ROUTE OF ADMINISTRATION, 2020-2029 (USD THOUSAND)
TABLE 148 URUGUAY EXOSOME THERAPEUTICS MARKET, BY END USER, 2020-2029 (USD THOUSAND)
TABLE 149 COSTA RICA EXOSOME THERAPEUTICS MARKET, BY TYPE, 2020-2029 (USD THOUSAND)
TABLE 150 COSTA RICA NATURAL EXOSOMES IN EXOSOME THERAPEUTICS MARKET, BY TYPE, 2020-2029 (USD THOUSAND)
TABLE 151 COSTA RICA EXOSOME THERAPEUTICS MARKET, BY SOURCE, 2020-2029 (USD THOUSAND)
TABLE 152 COSTA RICA EXOSOME THERAPEUTICS MARKET, BY SOURCE, 2020-2029 (USD THOUSAND)
TABLE 153 COSTA RICA EXOSOME THERAPEUTICS MARKET, BY SOURCE, 2020-2029 (USD THOUSAND)
TABLE 154 COSTA RICA EXOSOME THERAPEUTICS MARKET, BY THERAPY, 2020-2029 (USD THOUSAND)
TABLE 155 COSTA RICA EXOSOME THERAPEUTICS MARKET, BY TRANSPORTING CAPACITY, 2020-2029 (USD THOUSAND)
TABLE 156 COSTA RICA EXOSOME THERAPEUTICS MARKET, BY TRANSPORTING CAPACITY, 2020-2029 (USD THOUSAND)
TABLE 157 COSTA RICA EXOSOME THERAPEUTICS MARKET, BY APPLICATION, 2020-2029 (USD THOUSAND)
TABLE 158 COSTA RICA EXOSOME THERAPEUTICS MARKET, BY APPLICATION, 2020-2029 (USD THOUSAND)
TABLE 159 COSTA RICA EXOSOME THERAPEUTICS MARKET, BY APPLICATION, 2020-2029 (USD THOUSAND)
TABLE 160 COSTA RICA EXOSOME THERAPEUTICS MARKET, BY ROUTE OF ADMINISTRATION, 2020-2029 (USD THOUSAND)
TABLE 161 COSTA RICA EXOSOME THERAPEUTICS MARKET, BY END USER, 2020-2029 (USD THOUSAND)
TABLE 162 PANAMA EXOSOME THERAPEUTICS MARKET, BY TYPE, 2020-2029 (USD THOUSAND)
TABLE 163 PANAMA NATURAL EXOSOMES IN EXOSOME THERAPEUTICS MARKET, BY TYPE, 2020-2029 (USD THOUSAND)
TABLE 164 PANAMA EXOSOME THERAPEUTICS MARKET, BY SOURCE, 2020-2029 (USD THOUSAND)
TABLE 165 PANAMA BLOOD IN EXOSOME THERAPEUTICS MARKET, BY SOURCE, 2020-2029 (USD THOUSAND)
TABLE 166 PANAMA BODY FLUIDS IN EXOSOME THERAPEUTICS MARKET, BY SOURCE, 2020-2029 (USD THOUSAND)
TABLE 167 PANAMA EXOSOME THERAPEUTICS MARKET, BY THERAPY, 2020-2029 (USD THOUSAND)
TABLE 168 PANAMA EXOSOME THERAPEUTICS MARKET, BY TRANSPORTING CAPACITY, 2020-2029 (USD THOUSAND)
TABLE 169 PANAMA BIO MACROMOLECULES IN EXOSOME THERAPEUTICS MARKET, BY TRANSPORTING CAPACITY, 2020-2029 (USD THOUSAND)
TABLE 170 PANAMA EXOSOME THERAPEUTICS MARKET, BY APPLICATION, 2020-2029 (USD THOUSAND)
TABLE 171 PANAMA ONCOLOGY IN EXOSOME THERAPEUTICS MARKET, BY APPLICATION, 2020-2029 (USD THOUSAND)
TABLE 172 PANAMA NEUROLOGY IN EXOSOME THERAPEUTICS MARKET, BY APPLICATION, 2020-2029 (USD THOUSAND)
TABLE 173 PANAMA EXOSOME THERAPEUTICS MARKET, BY ROUTE OF ADMINISTRATION, 2020-2029 (USD THOUSAND)
TABLE 174 PANAMA EXOSOME THERAPEUTICS MARKET, BY END USER, 2020-2029 (USD THOUSAND)
TABLE 175 DOMINICAN REPUBLIC EXOSOME THERAPEUTICS MARKET, BY TYPE, 2020-2029 (USD THOUSAND)
TABLE 176 DOMINICAN REPUBLIC NATURAL EXOSOMES IN EXOSOME THERAPEUTICS MARKET, BY TYPE, 2020-2029 (USD THOUSAND)
TABLE 177 DOMINICAN REPUBLIC EXOSOME THERAPEUTICS MARKET, BY SOURCE, 2020-2029 (USD THOUSAND)
TABLE 178 DOMINICAN REPUBLIC BLOOD IN EXOSOME THERAPEUTICS MARKET, BY SOURCE, 2020-2029 (USD THOUSAND)
TABLE 179 DOMINICAN REPUBLIC BODY FLUIDS IN EXOSOME THERAPEUTICS MARKET, BY SOURCE, 2020-2029 (USD THOUSAND)
TABLE 180 DOMINICAN REPUBLIC EXOSOME THERAPEUTICS MARKET, BY THERAPY, 2020-2029 (USD THOUSAND)
TABLE 181 DOMINICAN REPUBLIC EXOSOME THERAPEUTICS MARKET, BY TRANSPORTING CAPACITY, 2020-2029 (USD THOUSAND)
TABLE 182 DOMINICAN REPUBLIC BIO MACROMOLECULES IN EXOSOME THERAPEUTICS MARKET, BY TRANSPORTING CAPACITY, 2020-2029 (USD THOUSAND)
TABLE 183 DOMINICAN REPUBLIC EXOSOME THERAPEUTICS MARKET, BY APPLICATION, 2020-2029 (USD THOUSAND)
TABLE 184 DOMINICAN REPUBLIC ONCOLOGY IN EXOSOME THERAPEUTICS MARKET, BY APPLICATION, 2020-2029 (USD THOUSAND)
TABLE 185 DOMINICAN REPUBLIC NEUROLOGY IN EXOSOME THERAPEUTICS MARKET, BY APPLICATION, 2020-2029 (USD THOUSAND)
TABLE 186 DOMINICAN REPUBLIC EXOSOME THERAPEUTICS MARKET, BY ROUTE OF ADMINISTRATION, 2020-2029 (USD THOUSAND)
TABLE 187 DOMINICAN REPUBLIC EXOSOME THERAPEUTICS MARKET, BY END USER, 2020-2029 (USD THOUSAND)
TABLE 188 REST OF LATIN AMERICA EXOSOME THERAPEUTICS MARKET, BY TYPE, 2020-2029 (USD THOUSAND)
List of Figure
FIGURE 1 LATIN AMERICA EXOSOME THERAPEUTICS MARKET: SEGMENTATION
FIGURE 2 LATIN AMERICA EXOSOME THERAPEUTICS MARKET: DATA TRIANGULATION
FIGURE 3 LATIN AMERICA EXOSOME THERAPEUTICS MARKET: DROC ANALYSIS
FIGURE 4 LATIN AMERICA EXOSOME THERAPEUTICS MARKET: LATIN AMERICA VS REGIONAL MARKET ANALYSIS
FIGURE 5 LATIN AMERICA EXOSOME THERAPEUTICS MARKET: COMPANY RESEARCH ANALYSIS
FIGURE 6 LATIN AMERICA EXOSOME THERAPEUTICS MARKET: INTERVIEW DEMOGRAPHICS
FIGURE 7 LATIN AMERICA EXOSOME THERAPEUTICS MARKET: DBMR POSITION GRID
FIGURE 8 LATIN AMERICA EXOSOME THERAPEUTICS MARKET: VENDOR SHARE ANALYSIS
FIGURE 9 LATIN AMERICA EXOSOME THERAPEUTICS MARKET: END USER COVERAGE GRID
FIGURE 10 LATIN AMERICA EXOSOME THERAPEUTICS MARKET: SEGMENTATION
FIGURE 11 THE INCREASED PREVALENCE OF AUTOIMMUNE DISORDERS, LYME DISEASES, INCIDENCE OF CANCER AND RISE IN TECHNOLOGICAL ADVANCEMENTS IS EXPECTED TO DRIVE THE LATIN AMERICA EXOSOME THERAPEUTICS MARKET FROM 2022 TO 2029
FIGURE 12 TYPE SEGMENT IS EXPECTED TO HAVE THE LARGEST SHARE OF THE LATIN AMERICA EXOSOME THERAPEUTICS MARKET IN 2022 & 2029
FIGURE 13 DRIVERS, RESTRAINTS, OPPORTUNITIES, AND CHALLENGES OF LATIN AMERICA EXOSOME THERAPEUTICS MARKET
FIGURE 14 THE PREVALENCE OF MULTIPLE SCLEROSIS IN WORLD HEALTH ORGANISATION (WHO) REGIONS IN 2020.
FIGURE 15 INCIDENCE RATE OF CANCER IN AUSTRALIA AND OTHER COUNTRIES (2020)
FIGURE 16 LATIN AMERICA EXOSOME THERAPEUTICS MARKET: BY TYPE, 2021
FIGURE 17 LATIN AMERICA EXOSOME THERAPEUTICS MARKET: BY TYPE, 2020-2029 (USD THOUSAND)
FIGURE 18 LATIN AMERICA EXOSOME THERAPEUTICS MARKET: BY TYPE, CAGR (2022-2029)
FIGURE 19 LATIN AMERICA EXOSOME THERAPEUTICS MARKET: BY TYPE, LIFELINE CURVE
FIGURE 20 LATIN AMERICA EXOSOME THERAPEUTICS MARKET: BY SOURCE, 2021
FIGURE 21 LATIN AMERICA EXOSOME THERAPEUTICS MARKET: BY SOURCE, 2020-2029 (USD THOUSAND)
FIGURE 22 LATIN AMERICA EXOSOME THERAPEUTICS MARKET: BY SOURCE, CAGR (2022-2029)
FIGURE 23 LATIN AMERICA EXOSOME THERAPEUTICS MARKET: BY SOURCE, LIFELINE CURVE
FIGURE 24 LATIN AMERICA EXOSOME THERAPEUTICS MARKET: BY THERAPY, 2021
FIGURE 25 LATIN AMERICA EXOSOME THERAPEUTICS MARKET: BY THERAPY, 2020-2029 (USD THOUSAND)
FIGURE 26 LATIN AMERICA EXOSOME THERAPEUTICS MARKET: BY THERAPY, CAGR (2022-2029)
FIGURE 27 LATIN AMERICA EXOSOME THERAPEUTICS MARKET: BY THERAPY, LIFELINE CURVE
FIGURE 28 LATIN AMERICA EXOSOME THERAPEUTICS MARKET: BY TRANSPORTING CAPACITY, 2021
FIGURE 29 LATIN AMERICA EXOSOME THERAPEUTICS MARKET: BY TRANSPORTING CAPACITY, 2020-2029 (USD THOUSAND)
FIGURE 30 LATIN AMERICA EXOSOME THERAPEUTICS MARKET: BY TRANSPORTING CAPACITY, CAGR (2022-2029)
FIGURE 31 LATIN AMERICA EXOSOME THERAPEUTICS MARKET: BY TRANSPORTING CAPACITY, LIFELINE CURVE
FIGURE 32 LATIN AMERICA EXOSOME THERAPEUTICS MARKET: BY APPLICATION, 2021
FIGURE 33 LATIN AMERICA EXOSOME THERAPEUTICS MARKET: BY APPLICATION, 2020-2029 (USD THOUSAND)
FIGURE 34 LATIN AMERICA EXOSOME THERAPEUTICS MARKET: BY APPLICATION, CAGR (2022-2029)
FIGURE 35 LATIN AMERICA EXOSOME THERAPEUTICS MARKET: BY APPLICATION, LIFELINE CURVE
FIGURE 36 LATIN AMERICA EXOSOME THERAPEUTICS MARKET: BY ROUTE OF ADMINISTRATION, 2021
FIGURE 37 LATIN AMERICA EXOSOME THERAPEUTICS MARKET: BY ROUTE OF ADMINISTRATION, 2020-2029 (USD THOUSAND)
FIGURE 38 LATIN AMERICA EXOSOME THERAPEUTICS MARKET: BY ROUTE OF ADMINISTRATION, CAGR (2022-2029)
FIGURE 39 LATIN AMERICA EXOSOME THERAPEUTICS MARKET: BY ROUTE OF ADMINISTRATION, LIFELINE CURVE
FIGURE 40 LATIN AMERICA EXOSOME THERAPEUTICS MARKET: BY END USER, 2021
FIGURE 41 LATIN AMERICA EXOSOME THERAPEUTICS MARKET: BY END USER, 2020-2029 (USD THOUSAND)
FIGURE 42 LATIN AMERICA EXOSOME THERAPEUTICS MARKET: BY END USER, CAGR (2022-2029)
FIGURE 43 LATIN AMERICA EXOSOME THERAPEUTICS MARKET: BY END USER, LIFELINE CURVE
FIGURE 44 LATIN AMERICA EXOSOME THERAPEUTICS MARKET: SNAPSHOT (2021)
FIGURE 45 LATIN AMERICA EXOSOME THERAPEUTICS MARKET: BY COUNTRY (2021)
FIGURE 46 LATIN AMERICA EXOSOME THERAPEUTICS MARKET: BY COUNTRY (2022 & 2029)
FIGURE 47 LATIN AMERICA EXOSOME THERAPEUTICS MARKET: BY COUNTRY (2021 & 2029)
FIGURE 48 LATIN AMERICA EXOSOME THERAPEUTICS MARKET: BY TYPE (2022-2029)
FIGURE 49 LATIN AMERICA EXOSOME THERAPEUTICS MARKET: COMPANY SHARE 2021 (%)
Data collection and base year analysis are done using data collection modules with large sample sizes. The stage includes obtaining market information or related data through various sources and strategies. It includes examining and planning all the data acquired from the past in advance. It likewise envelops the examination of information inconsistencies seen across different information sources. The market data is analysed and estimated using market statistical and coherent models. Also, market share analysis and key trend analysis are the major success factors in the market report. To know more, please request an analyst call or drop down your inquiry.
The key research methodology used by DBMR research team is data triangulation which involves data mining, analysis of the impact of data variables on the market and primary (industry expert) validation. Data models include Vendor Positioning Grid, Market Time Line Analysis, Market Overview and Guide, Company Positioning Grid, Patent Analysis, Pricing Analysis, Company Market Share Analysis, Standards of Measurement, Global versus Regional and Vendor Share Analysis. To know more about the research methodology, drop in an inquiry to speak to our industry experts.
Data Bridge Market Research is a leader in advanced formative research. We take pride in servicing our existing and new customers with data and analysis that match and suits their goal. The report can be customized to include price trend analysis of target brands understanding the market for additional countries (ask for the list of countries), clinical trial results data, literature review, refurbished market and product base analysis. Market analysis of target competitors can be analyzed from technology-based analysis to market portfolio strategies. We can add as many competitors that you require data about in the format and data style you are looking for. Our team of analysts can also provide you data in crude raw excel files pivot tables (Fact book) or can assist you in creating presentations from the data sets available in the report.


