
Middle And East Africa Pharmaceutical Solvent Market
Market Size in USD Million
 USD
367.96 Million
USD
507.46 Million
2024
2032
USD
367.96 Million
USD
507.46 Million
2024
2032
| 2025 - 2032 | |
| USD 367.96 Million | |
| USD 507.46 Million | |
| % | |
|
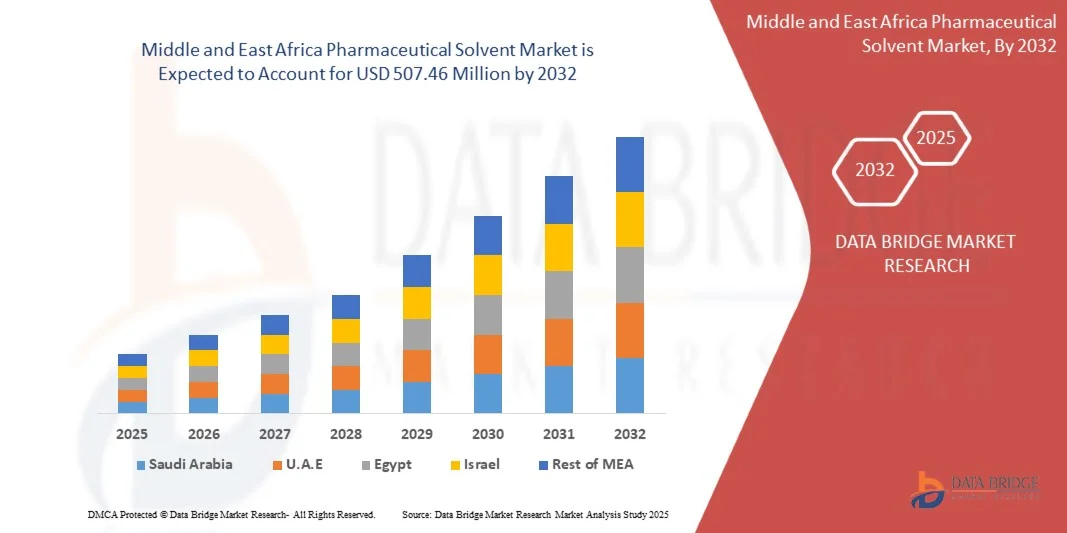
Middle and East Africa Pharmaceutical Solvent Market Size
- The Middle and East Africa Pharmaceutical Solvent Market size was valued at USD 367.96 million in 2024 and is projected to reach USD 507.46 million by 2032, growing at a CAGR of 4.10% during the forecast period
- Market expansion is primarily driven by increased pharmaceutical manufacturing, rising demand for generic medicines, and growing healthcare infrastructure across emerging economies in the region
- Additionally, regulatory support for quality drug formulation and increasing investment in R&D activities are fueling the adoption of high-purity solvents, further propelling the market's robust growth trajectory
Middle and East Africa Pharmaceutical Solvent Market Analysis
- Pharmaceutical solvents, essential for drug formulation, synthesis, and purification, are increasingly critical in the pharmaceutical manufacturing process across Middle and East Africa due to rising demand for quality medicines and the expansion of local production facilities
- The surging demand for pharmaceutical solvents is primarily driven by the region’s growing population, increasing prevalence of chronic diseases, and a rising focus on improving healthcare access and infrastructure
- U.A.E. Dominated the MEA pharmaceutical solvent market with the highest revenue share of 32.7% in 2024, owing to its advanced pharmaceutical sector, regulatory support, and well-established distribution networks, while countries like Egypt and Saudi Arabia are witnessing rapid growth due to increasing foreign investments and supportive healthcare reforms.
- Saudi Arabia countries are projected to experience the fastest growth during the forecast period, driven by government-led localization efforts, increased R&D initiatives, and the strategic expansion of regional pharmaceutical manufacturing hubs.
- The alcohol segment dominated the market with the largest revenue share of 38.5% in 2024, driven by its widespread use in drug formulation, particularly in the preparation of oral liquid medications and topical agents
Report Scope and Middle and East Africa Pharmaceutical Solvent Market Segmentation
|
Attributes |
Pharmaceutical Solvent Key Market Insights |
|
Segments Covered |
|
|
Countries Covered |
Middle East and Africa
|
|
Key Market Players |
|
|
Market Opportunities |
|
|
Value Added Data Infosets |
In addition to the insights on market scenarios such as market value, growth rate, segmentation, geographical coverage, and major players, the market reports curated by the Data Bridge Market Research also include in-depth expert analysis, pricing analysis, brand share analysis, consumer survey, demography analysis, supply chain analysis, value chain analysis, raw material/consumables overview, vendor selection criteria, PESTLE Analysis, Porter Analysis, and regulatory framework. |
Middle and East Africa Pharmaceutical Solvent Market Trends
“Rising Focus on High-Purity Solvents and Advanced Formulation Technologies”
- A significant and accelerating trend in the Middle and East Africa Pharmaceutical Solvent Market is the growing emphasis on high-purity solvents and advanced formulation technologies to meet stringent regulatory standards and improve drug safety and efficacy across the region’s expanding pharmaceutical sector.
- ForInstance, multinational suppliers such as BASF and Merck KGaA are increasingly offering pharmaceutical-grade solvents tailored to meet Good Manufacturing Practice (GMP) requirements, supporting local manufacturers in complying with both regional and international quality regulations.
- The use of high-purity solvents enables more precise drug formulation, reduces the risk of contamination, and supports the production of complex generics and specialty drugs. Advanced formulation technologies involving these solvents are also contributing to enhanced solubility and bioavailability of active pharmaceutical ingredients (APIs), a key consideration in treating widespread chronic and infectious diseases in the region.
- Moreover, pharmaceutical companies are adopting solvent recovery and recycling systems to ensure environmental sustainability and cost-efficiency, especially in countries like South Africa and Kenya where environmental regulations are becoming increasingly stringent.
- This trend is also driving innovation among regional and global players, with firms like Clariant and Eastman Chemical Company investing in R&D to develop next-generation solvents that combine performance with eco-friendly profiles.
- The demand for high-purity, specialty solvents continues to rise across both public and private sector pharmaceutical initiatives, as governments and health organizations work to expand access to safe, effective, and affordable medicines in Middle and East Africa.
Middle and East Africa Pharmaceutical Solvent Market Dynamics
Driver
“Growing Demand Driven by Expanding Pharmaceutical Manufacturing and Healthcare Needs”
- The expanding pharmaceutical manufacturing base across Middle and East Africa, coupled with rising demand for affordable and accessible healthcare solutions, is a key driver fueling the need for pharmaceutical solvents in the region.
- For instance, in March 2024, the South African government launched initiatives to increase local production of essential medicines, encouraging investment in pharmaceutical infrastructure and boosting the demand for high-quality solvents used in drug formulation.
- As more countries in the region prioritize self-sufficiency in drug production—especially for generic and essential medicines—pharmaceutical solvents are playing a vital role in ensuring consistency, quality, and regulatory compliance in local manufacturing processes.
- Additionally, the growing burden of non-communicable diseases such as diabetes and cardiovascular disorders is increasing the demand for complex drug formulations, many of which require specific solvents for solubility and stability.
- Global and regional pharmaceutical players are also investing in production facilities and R&D operations in Middle and East Africa, leveraging cost advantages and access to emerging markets. This is further supported by government incentives and partnerships with international health organizations to improve drug accessibility and quality.
- The trend toward modernization and automation in pharmaceutical manufacturing, including the use of advanced formulation and solvent recovery systems, is enhancing efficiency and driving solvent consumption across the region.
Restraint/Challenge
“Regulatory Challenges and Limited Access to High-Quality Solvents”
- One of the significant challenges facing the Middle and East Africa Pharmaceutical Solvent Market is the fragmented and evolving regulatory landscape, which can complicate market entry and lead to inconsistencies in quality standards across borders.
- For Instance, some countries in the region lack well-established pharmaceutical regulatory frameworks, resulting in difficulties in ensuring the consistent availability of pharmaceutical-grade solvents that meet international GMP standards.
- Limited local production of high-purity solvents and dependence on imports also contribute to supply chain vulnerabilities, price fluctuations, and limited access in rural or underserved areas. This can hinder consistent drug manufacturing operations and delay time-to-market for pharmaceutical products.
- Additionally, the high cost of maintaining solvent purity, storage, and safe handling infrastructure can be a financial burden for small and mid-sized pharmaceutical manufacturers, particularly in countries with less developed industrial bases.
- Addressing these issues will require coordinated regional regulatory harmonization, investment in local solvent production capabilities, and greater support for pharmaceutical companies in adopting modern manufacturing technologies and quality control systems.
- Strengthening partnerships between governments, industry stakeholders, and international health bodies will be essential to overcoming these barriers and ensuring the sustainable growth of the pharmaceutical solvent market in Middle and East Africa.
Middle and East Africa Pharmaceutical Solvent Market Scope
The Middle East and Africa pharmaceutical solvent market is segmented into two notable segments which are based on product and application.
• By Product
On the basis of product, the Middle and East Africa Pharmaceutical Solvent Market is segmented into Alcohol, Amine, Esters, Ethers, Aromatic Hydrocarbons, Chlorinated Solvents, Ketones, and Others. The Alcohol segment dominated the market with the largest revenue share of 38.5% in 2024, driven by its widespread use in drug formulation, particularly in the preparation of oral liquid medications and topical agents. Alcohols such as ethanol and isopropanol are favored for their high solvency, low toxicity, and compatibility with a range of APIs, making them ideal for both formulation and sterilization purposes.
The Ketones segment is expected to witness the fastest CAGR from 2025 to 2032, fueled by their growing application in complex formulations, particularly for poorly water-soluble drugs. Solvents like acetone and methyl ethyl ketone are gaining popularity due to their superior evaporation rates and miscibility with other solvents, enabling efficient drug processing. Increasing pharmaceutical R&D activities are further supporting the growth of high-performance solvent categories like ketones.
• By Application
On the basis of application, the Middle and East Africa Pharmaceutical Solvent Market is segmented into Pharmaceutical, Research Laboratories, Chemical, and Others. The Pharmaceutical segment accounted for the largest market revenue share of 66.3% in 2024, primarily driven by the rising demand for generic and branded drugs, growth in local pharmaceutical production, and increasing government initiatives to strengthen regional healthcare infrastructure. Solvents in this segment are used extensively in synthesis, purification, and formulation processes, making them critical components in the drug development lifecycle.
The Research Laboratories segment is expected to witness the fastest CAGR from 2025 to 2032, supported by increasing investments in drug discovery, bioscience research, and academic-industry collaborations across key countries such as South Africa, Kenya, and Nigeria. As R&D intensifies across therapeutic areas, the demand for high-purity solvents in analytical and experimental applications is growing rapidly. Moreover, international organizations and private-sector funding are playing a pivotal role in enhancing laboratory capabilities in the region, driving long-term growth.
Middle and East Africa Pharmaceutical Solvent Market Regional Analysis
- U.A.E. dominated a key segment of the emerging pharmaceutical solvent market with the largest share of 32.7% in 2024, supported by expanding pharmaceutical manufacturing, growing demand for generic drugs, and increased investments in local healthcare infrastructure
- Pharmaceutical companies in the region are increasingly prioritizing high-quality solvents for drug formulation and processing, driven by stricter regulatory standards and the need for consistent product quality across therapeutic applications
- This growth is further fueled by rising healthcare expenditure, government-backed localization strategies, and partnerships with global pharmaceutical firms, positioning pharmaceutical solvents as essential components in meeting regional medicine production goals
South Africa Pharmaceutical Solvent Market Insight
South Africa dominated the Middle and East Africa Pharmaceutical Solvent Market with the largest revenue share of 37.8% in 2024, driven by its well-established pharmaceutical manufacturing industry and supportive regulatory environment. The country’s growing focus on local drug production and export capabilities has boosted demand for high-quality pharmaceutical solvents. Investments in healthcare infrastructure and increasing adoption of advanced manufacturing technologies further fuel market expansion. South Africa’s role as a regional pharmaceutical hub also facilitates distribution and supply chain efficiency, strengthening its market position.
Saudi Arabia Pharmaceutical Solvent Market Insight
The Saudi Arabian pharmaceutical solvent market is expected to grow at a significant CAGR during the forecast period, supported by the country’s ambitious healthcare modernization plans and Vision 2030 initiatives. Increasing investments in pharmaceutical manufacturing facilities, coupled with rising demand for generic medicines, drive solvent consumption. Additionally, regulatory reforms aimed at enhancing local production and reducing import dependency are fostering market growth, particularly in specialized solvents used in drug formulation and synthesis.
UAE Pharmaceutical Solvent Market Insight
The UAE pharmaceutical solvent market is projected to witness steady growth, propelled by its strategic location as a logistics and trade hub, and increasing healthcare investments. The government’s support for pharmaceutical innovation and growing demand for contract manufacturing and research services have increased solvent usage. Moreover, the UAE’s expanding clinical research activities and efforts to attract multinational pharmaceutical companies contribute to the rising demand for high-grade solvents in the region.
Egypt Pharmaceutical Solvent Market Insight
Egypt’s pharmaceutical solvent market is anticipated to expand steadily, driven by the country’s diversified pharmaceutical sector and growing exports to Africa and the Middle East. Government initiatives to upgrade manufacturing infrastructure and harmonize regulatory standards align with increasing solvent demand for quality drug production. The rise in local pharmaceutical companies and partnerships with global players further boost market prospects.
Israel Pharmaceutical Solvent Market Insight
Israel’s pharmaceutical solvent market is characterized by rapid growth due to its strong emphasis on pharmaceutical R&D and biopharmaceutical innovation. The country’s advanced research ecosystem, coupled with increasing clinical trial activities, fosters high demand for specialized solvents. Moreover, Israel’s thriving startup scene in pharmaceutical technologies and government incentives for biotech companies contribute significantly to solvent market expansion.
Middle and East Africa Pharmaceutical Solvent Market Share
The Pharmaceutical Solvent industry is primarily led by well-established companies, including:
- DuPont (U.S.)
- Mitsui Chemicals (Japan)
- DOW (USA)
- Clariant (Switzerland)
- Brenntag SE (Germany)
- Olin Corporation (U.S.)
- Merck KGaA (Germany)
- Royal Dutch Shell Plc (U.K./Netherlands)
- SK geo centric Co., Ltd. (South Korea)
- Eastman Chemical Company (U.S.)
- LyondellBasell Industries Holdings B.V. (Netherlands)
- BASF SE (Germany)
- Exxon Mobil Corporation (U.S.)
- Avantor, Inc. (U.S.)
What are the Recent Developments in Middle and East Africa Pharmaceutical Solvent Market?
- In April 2023, Sasol Limited (South Africa), a leading integrated chemicals and energy company, launched an initiative to expand its pharmaceutical solvent production capacity to meet the rising demand across Middle and East Africa. This strategic move aims to strengthen local supply chains and reduce dependency on imports, supporting the growth of regional pharmaceutical manufacturing. By leveraging advanced refining technologies and sustainable practices, Sasol is reinforcing its commitment to delivering high-quality solvents tailored to the pharmaceutical industry’s evolving needs in the region.
- In March 2023, Sipchem (Saudi Arabia), a key player in specialty chemicals, announced the introduction of a new range of eco-friendly pharmaceutical solvents designed to comply with stringent environmental regulations. This product launch targets pharmaceutical manufacturers seeking greener alternatives without compromising performance. Sipchem’s focus on innovation and sustainability highlights its dedication to addressing both regulatory and market demands in Middle Eastern pharmaceutical sectors.
- In March 2023, Gulf Pharmaceutical Industries (Julphar) (UAE) initiated a large-scale project to enhance solvent purification processes at its manufacturing facilities, aiming to improve solvent quality and operational efficiency. This advancement supports Julphar’s mission to elevate pharmaceutical production standards and ensure regulatory compliance across the Middle East and Africa, thereby contributing to safer and more effective medicines.
- In February 2023, EIPICO (Egyptian International Pharmaceutical Industries Company) (Egypt) entered into a collaboration with international chemical suppliers to diversify its solvent portfolio, focusing on specialty solvents for complex drug formulations. This partnership is designed to improve product availability and reduce lead times for local pharmaceutical manufacturers. EIPICO’s strategic collaboration underscores its commitment to strengthening Egypt’s position as a pharmaceutical manufacturing hub in the region.
- In January 2023, Teva Pharmaceutical Industries Ltd. (Israel) unveiled a new research initiative aimed at developing novel pharmaceutical solvents optimized for biologics and advanced drug delivery systems. This initiative emphasizes Teva’s investment in R&D and its leadership in pharmaceutical innovation within the Middle East. By integrating cutting-edge solvent technologies, Teva aims to enhance drug efficacy and manufacturing efficiency, further driving growth in the regional pharmaceutical sector.
SKU-

- Interactive Data Analysis Dashboard
- Company Analysis Dashboard for high growth potential opportunities
- Research Analyst Access for customization & queries
- Competitor Analysis with Interactive dashboard
- Latest News, Updates & Trend analysis
- Harness the Power of Benchmark Analysis for Comprehensive Competitor Tracking
Middle And East Africa Pharmaceutical Solvent Market, Supply Chain Analysis and Ecosystem Framework
To support market growth and help clients navigate the impact of geopolitical shifts, DBMR has integrated in-depth supply chain analysis into its Middle And East Africa Pharmaceutical Solvent Market research reports. This addition empowers clients to respond effectively to global changes affecting their industries. The supply chain analysis section includes detailed insights such as Middle And East Africa Pharmaceutical Solvent Market consumption and production by country, price trend analysis, the impact of tariffs and geopolitical developments, and import and export trends by country and HSN code. It also highlights major suppliers with data on production capacity and company profiles, as well as key importers and exporters. In addition to research, DBMR offers specialized supply chain consulting services backed by over a decade of experience, providing solutions like supplier discovery, supplier risk assessment, price trend analysis, impact evaluation of inflation and trade route changes, and comprehensive market trend analysis.
Data collection and base year analysis are done using data collection modules with large sample sizes. The stage includes obtaining market information or related data through various sources and strategies. It includes examining and planning all the data acquired from the past in advance. It likewise envelops the examination of information inconsistencies seen across different information sources. The market data is analysed and estimated using market statistical and coherent models. Also, market share analysis and key trend analysis are the major success factors in the market report. To know more, please request an analyst call or drop down your inquiry.
The key research methodology used by DBMR research team is data triangulation which involves data mining, analysis of the impact of data variables on the market and primary (industry expert) validation. Data models include Vendor Positioning Grid, Market Time Line Analysis, Market Overview and Guide, Company Positioning Grid, Patent Analysis, Pricing Analysis, Company Market Share Analysis, Standards of Measurement, Global versus Regional and Vendor Share Analysis. To know more about the research methodology, drop in an inquiry to speak to our industry experts.
Data Bridge Market Research is a leader in advanced formative research. We take pride in servicing our existing and new customers with data and analysis that match and suits their goal. The report can be customized to include price trend analysis of target brands understanding the market for additional countries (ask for the list of countries), clinical trial results data, literature review, refurbished market and product base analysis. Market analysis of target competitors can be analyzed from technology-based analysis to market portfolio strategies. We can add as many competitors that you require data about in the format and data style you are looking for. Our team of analysts can also provide you data in crude raw excel files pivot tables (Fact book) or can assist you in creating presentations from the data sets available in the report.


