
Middle East And Africa Alpha Methylstyrene Market
Market Size in USD Million
 USD
14.50 Million
USD
18.07 Million
2024
2032
USD
14.50 Million
USD
18.07 Million
2024
2032
| 2025 - 2032 | |
| USD 14.50 Million | |
| USD 18.07 Million | |
| % | |
|
Alpha-Methylstyrene Market Size
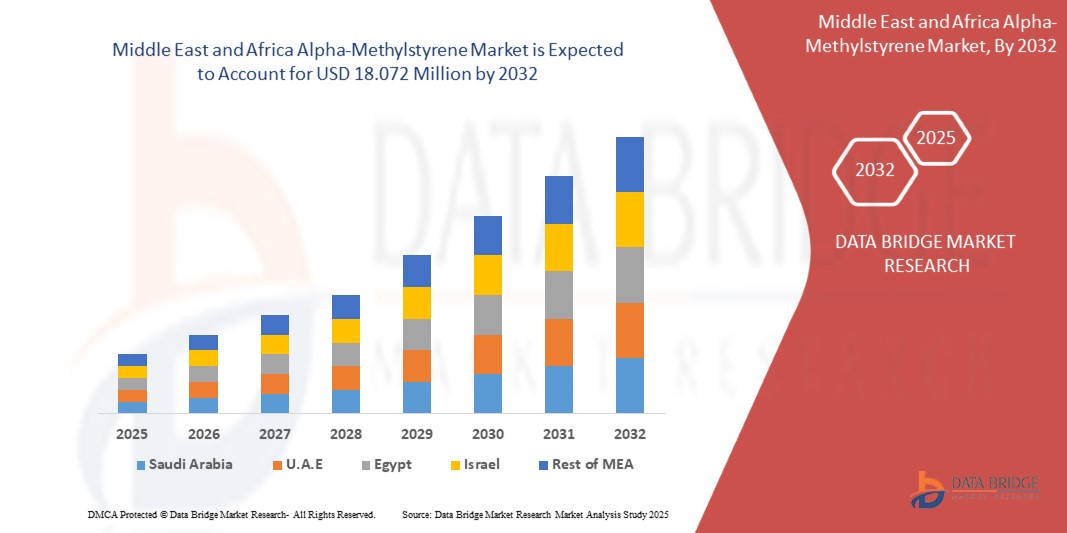
- The Middle east and africa alpha-methylstyrene market was valued at USD 14.498 million in 2024 and is expected to reach USD 18.072 million by 2032 at a CAGR of 2.85%, during the forecast period
- This growth is driven by factors such as rising demand for abs resins in automotive and consumer goods, growth in construction and coatings industries, expansion of packaging industry, technological advancements in polymer production
Alpha-Methylstyrene Market Analysis
- Rising AMS demand stems from its use in producing plastics and resins for automotive components, enhancing performance and durability
- Electronics and packaging sectors increasingly use AMS-based adhesives and coatings, driving steady market growth due to reliability and chemical resistance
- South Africa is expected to dominate the alpha-methylstyrene market with 35.76% share due to rapid industrialization, expanding manufacturing base, and strong demand from automotive, electronics, and packaging sectors
- South Africa is expected to be the fastest growing region in the Alpha-Methylstyrene and its derivatives market due to increasing industrial activities, rising consumer demand, expanding automotive and electronics sectors, and supportive government policies promoting manufacturing and infrastructure development
- The More Than 99% purity segment is expected to dominate the Alpha-Methylstyrene and its derivatives market with a 63.53% share in 2025 due to its superior performance, high stability, and growing use in high-grade resins, adhesives, and polymers required for automotive, electronics, and premium packaging applications
Report Scope and Alpha Methyl-styrene Market Segmentation
|
Attributes |
Alpha Methyl-styrene Key Market Insights |
|
Segments Covered |
|
|
Countries Covered |
Middle East and Africa
|
|
Key Market Players |
|
|
Market Opportunities |
|
|
Value Added Data Infosets |
In addition to the insights on market scenarios such as market value, growth rate, segmentation, geographical coverage, and major players, the market reports curated by the Data Bridge Market Research also include import export analysis, production capacity overview, production consumption analysis, price trend analysis, climate change scenario, supply chain analysis, value chain analysis, raw material/consumables overview, vendor selection criteria, PESTLE Analysis, Porter Analysis, and regulatory framework. |
Alpha-Methylstyrene Market Trends
“Increasing ABS Resin Production”
- Growing demand for lightweight, durable plastics in automotive and electronics sectors is driving ABS resin production, with Alpha-Methylstyrene playing a key role as a performance-enhancing intermediate in polymer formulations
- The surge in consumer electronics and home appliances manufacturing fuels ABS usage, thereby boosting Alpha-Methylstyrene consumption due to its contribution to impact strength and thermal stability in end products
- Rapid industrialization in emerging economies like India and China accelerates ABS production, increasing the need for Alpha-Methylstyrene as manufacturers seek cost-effective, high-quality plastic materials for diverse industrial applications
- Innovation in ABS resin compositions for 3D printing and sustainable packaging enhances Alpha-Methylstyrene’s relevance, aligning with global trends toward high-performance, eco-conscious materials in modern manufacturing practices
Alpha-Methylstyrene Market Dynamics
Driver
“Rising Demand for Abs Resins in Automotive and Consumer Goods”
- The increasing demand for high-performance resins, particularly in automotive and consumer goods applications, has significantly boosted the use of specific chemical compounds known for their excellent thermal stability, impact resistance, and mechanical strength
- These compounds are crucial in manufacturing durable and aesthetically appealing products, especially in industries where both functionality and visual appeal are key
- In the automotive sector, these compounds are widely utilized for creating components such as dashboards, bumpers, and interior trims. The rising focus on vehicle durability, safety, and lightweight designs is driving the adoption of these materials in various vehicle parts
- In addition, the demand for energy-efficient and environmentally friendly solutions is pushing for innovations that further improve material properties
For instance,
- A report published in Polymer-Search highlighted the increasing use of high-performance polymers in consumer electronics. Polymers' flexibility, heat resistance, and electrical insulation properties make them ideal for producing advanced gadgets. As demand for lighter, more durable, and sustainable devices grows, these materials play a crucial role in innovation
- The growing demand for high-performance resins in the automotive and consumer goods sectors is driving the use of chemical compounds with excellent thermal stability, impact resistance, and strength
Opportunity
“R&D in Eco-Friendly and High-Performance Resins”
- Growing awareness about environmental impact, manufacturers are focusing on developing AMS resins that are not only more durable and efficient but also sustainable
- These resins are being designed to meet both environmental standards and the increasing demand for stronger, lighter, and more adaptable materials across industries like packaging, automotive, and consumer goods.
- The rise in RandD investments is pushing the boundaries of what AMS resins can do. Innovations are enabling the production of resins that offer better thermal stability, chemical resistance, and recyclability
- As a result, AMS resins are becoming a popular choice for sustainable solutions that do not compromise performance
For instance,
- In October 2024, an article on Vertec Biosolvents highlighted the growing role of eco-friendly and high-performance resins in the AMS market. RandD efforts are focused on developing AMS resins that meet environmental standards while offering enhanced durability, thermal stability, and recyclability, driving growth in industries such as packaging and automotive
- A report by Knowledge Sourcing Intelligence LLP highlights advancements in RandD for biodegradable resins, focusing on high-performance materials that offer both durability and sustainability. This development is particularly impacting industries such as packaging, automotive, and consumer goods, where eco-friendly AMS applications are becoming essential in product innovation strategies
- In March 2024, Super Resin Inc. introduced its plant-based epoxy resin, presenting an environmentally sustainable alternative for the composites industry. This innovation highlights the significance of sustainable materials by reducing environmental impact while maintaining high performance. Such RandD advancements are steering the AMS market toward more eco-friendly solutions with enhanced functionality
- RandD in eco-friendly and high-performance resins is driving growth in the AMS market. Innovations are enhancing durability, thermal stability, and recyclability, making AMS resins ideal for sustainable solutions in packaging, automotive, and consumer goods
Restraint/Challenge
“Volatility In Crude Oil And Raw Material Prices”
- As AMS is derived from petroleum-based products, fluctuations in crude oil prices directly impact its production costs. When crude oil prices rise, the cost of raw materials for AMS production increases, resulting in higher production costs and, ultimately higher prices for AMS-based products
- These price fluctuations can make it difficult for manufacturers to maintain stable profit margins, especially when faced with market uncertainties
- Moreover, raw material supply disruptions due to geopolitical tensions, natural disasters, or trade barriers can exacerbate this volatility
- The uncertainty surrounding the availability and pricing of key raw materials for AMS production can hinder the ability of manufacturers to plan and operate efficiently, impacting overall market stability
For instance,
- In October 2024, a blog post published by Pearson discussed the volatility in crude oil prices and its direct impact on raw material costs. These fluctuations significantly affect the production of alpha-methylstyrene resins, creating challenges for manufacturers in maintaining stable profit margins amid unpredictable market conditions
- In November 2024, an article from The Economic Times discussed the volatility in crude oil prices and its impact on raw material costs. These fluctuations affect the production of alpha-methylstyrene resins, increasing production costs and complicating price stability, thereby challenging manufacturers in sectors such as packaging and automotive
- In November 2024, a blog by Mercatus Energy discussed how volatility in crude oil prices significantly impacts industries relying on petroleum-based products, such as alpha-methylstyrene. Fluctuating raw material costs increase AMS production costs, complicating profit margins and planning for manufacturers, especially in sectors such as automotive and packaging
- Volatility in crude oil prices and raw material costs significantly impacts the alpha-methylstyrene market. Fluctuations in crude oil prices raise production costs, affecting profit margins
- Supply disruptions from geopolitical issues or trade barriers further exacerbate this volatility, challenging manufacturers and consumers in sectors like packaging, automotive, and consumer goods
Alpha-Methylstyrene Market Scope
The market is segmented on the basis of purity, grade, packaging quantity, packaging, application, and end use.
|
Segmentation |
Sub-Segmentation |
|
By Purity |
|
|
By Grade |
|
|
By Packaging Quantity |
|
|
By Packaging
|
|
|
By Application |
|
|
By End-Use |
|
In 2025, the More Than 99% is projected to dominate the market with a largest share in purity segment
The More Than 99% segment is expected to dominate the Alpha-Methylstyrene market in 2025 due to its superior purity, which is essential for high-performance applications in plastics, adhesives, and resins, driving higher demand across industrial manufacturing sectors.
Standard Grade is expected to account for the largest share during the forecast period in Alpha methylstyrene market
In 2025, the Standard Grade segment is expected to dominate the market with a 38.12% share due to its extensive use in manufacturing resins, adhesives, and plastics, offering cost efficiency, consistent quality, and suitability for large-scale industrial applications.
Alpha Methyl-styrene Market Regional Analysis
“South Africa is the Dominant Region in the Alpha Methyl-styrene Market”
- South Africa is expected to dominate the alpha-methylstyrene market with 35.76%share due to rapid industrialization, expanding manufacturing base, and strong demand from automotive, electronics, and packaging sectors
- South Africa's AMS market is experiencing growth due to increased demand in automotive, electronics, construction, and adhesives sectors. Applications include ABS resins for automotive parts, coatings, and sealants
- The South African government's focus on encouraging investments in the chemical and petrochemical sectors is expected to open up new opportunities for AMS production, supporting market expansion
- South Africa's well-developed petrochemical and chemical industry, with numerous major companies operating in the country, is poised to meet the rising AMS demand through capacity expansions and technological advancements
“South Africa is Projected to Register the Highest Growth Rate”
- South Africa is expected to be the fastest growing region in the Alpha-Methylstyrene and its derivatives market due to increasing industrial activities, rising consumer demand, expanding automotive and electronics sectors, and supportive government policies promoting manufacturing and infrastructure development
- South Africa's expanding automotive and electronics industries are driving the demand for AMS, particularly in the production of ABS resins used in various components
- The South African government's initiatives to encourage investments in the chemical and petrochemical sectors are expected to stimulate AMS market growth through enhanced production capacities and technological advancements
Alpha Methyl-styrene Market Share
The market competitive landscape provides details by competitor. Details included are company overview, company financials, revenue generated, market potential, investment in research and development, new market initiatives, middle east and africa presence, production sites and facilities, production capacities, company strengths and weaknesses, product launch, product width and breadth, application dominance. The above data points provided are only related to the companies' focus related to market.
The Major Market Leaders Operating in the Market Are:
- INEOS Capital Limited (U.K.)
- Advansix (U.S.)
- Mitsubishi Chemical Group Corporation (Japan)
- LG Chem (South Korea)
- Solvay (Belgium)
- Kraton Corporation (U.S.)
- ROSNEFT (Russia)
- ALTIVIA (U.S.)
- Evonik Industries AG (Germany)
- Seqens (France)
- Domo Chemicals (Belgium)
- Deepak (India)
- SI Group, Inc. (U.S.)
- Prasol Chemicals Limited (India)
- TIANJIN ZHONGXIN CHEMTECH CO., LTD. (China)
- KUMHO PandB CHEMICALS., INC. (South Korea)
- Hefei TNJ Chemical Industry Co., Ltd. (China)
- Group of Companies «Titan» (Russia)
- Moeve (Germany)
- Shanghai Theorem Chemical Technology Co., Ltd. (China)
- Equilex BV (Netherlands)
- Otto Chemie Pvt. Ltd (India)
- eastindiachemicals (India)
- Tokyo Chemical Industry (India) Pvt. Ltd. (India)
- SimSon Pharma Limited (India)
- vizagchemical (India)
- rxchemical (India)
- Maha Automations (India)
Latest Developments in Middle East and Africa Alpha-Methylstyrene Market
- In April 2024, Domo Chemicals has inaugurated a new factory in China with a USD 15.02 million investment, enhancing production capacity. The facility, located south of Shanghai, will double output in the short term and potentially triple it in the future
- In April 2023, DOMO Chemicals has inaugurated a new compounding line at its Mahape, Navi Mumbai facility, expanding its capacity to meet growing demand for polyamide-based solutions. The state-of-the-art line will serve key sectors including automotive, electronics, and consumer goods
SKU-

- Interactive Data Analysis Dashboard
- Company Analysis Dashboard for high growth potential opportunities
- Research Analyst Access for customization & queries
- Competitor Analysis with Interactive dashboard
- Latest News, Updates & Trend analysis
- Harness the Power of Benchmark Analysis for Comprehensive Competitor Tracking
Table of Content
1 INTRODUCTION
1.1 OBJECTIVES OF THE STUDY
1.2 MARKET DEFINITION
1.3 OVERVIEW
1.4 LIMITATIONS
1.5 MARKETS COVERED
2 MARKET SEGMENTATION
2.1 MARKETS COVERED
2.2 GEOGRAPHICAL SCOPE
2.3 YEARS CONSIDERED FOR THE STUDY
2.4 CURRENCY AND PRICING
2.5 DBMR TRIPOD DATA VALIDATION MODEL
2.6 MULTIVARIATE MODELING
2.7 PRIMARY INTERVIEWS WITH KEY OPINION LEADERS
2.8 DBMR MARKET POSITION GRID
2.9 DBMR VENDOR SHARE ANALYSIS
2.1 MARKET APPLICATION COVERAGE GRID
2.11 SECONDARY SOURCES
2.12 ASSUMPTIONS
3 EXECUTIVE SUMMARY
4 PREMIUM INSIGHTS
4.1 PESTEL ANALYSIS
4.1.1 POLITICAL FACTORS
4.1.2 ECONOMIC FACTORS
4.1.3 SOCIAL FACTORS
4.1.4 TECHNOLOGICAL FACTORS
4.1.5 ENVIRONMENTAL FACTORS
4.1.6 LEGAL FACTORS
4.2 PORTER’S FIVE FORCES
4.2.1 THREAT OF NEW ENTRANTS
4.2.2 BARGAINING POWER OF BUYERS
4.2.3 BARGAINING POWER OF SUPPLIERS
4.2.4 THREAT OF SUBSTITUTES
4.2.5 COMPETITIVE RIVALRY
4.3 IMPORT EXPORT SCENARIO
4.4 PRODUCTION CONSUMPTION ANALYSIS
4.5 VENDOR SELECTION CRITERIA
4.5.1 QUALITY AND CONSISTENCY
4.5.2 TECHNICAL EXPERTISE
4.5.3 SUPPLY CHAIN RELIABILITY
4.5.4 COMPLIANCE AND SUSTAINABILITY
4.5.5 COST AND PRICING STRUCTURE
4.5.6 FINANCIAL STABILITY
4.5.7 FLEXIBILITY AND CUSTOMIZATION
4.5.8 RISK MANAGEMENT AND CONTINGENCY PLANS
4.6 CLIMATE CHANGE SCENARIO
4.6.1 ENVIRONMENTAL CONCERNS
4.6.2 INDUSTRY RESPONSE
4.6.3 GOVERNMENT’S ROLE
4.6.4 ANALYST RECOMMENDATIONS
4.7 RAW MATERIAL COVERAGE
4.7.1 CUMENE
4.7.2 CUMYL ALCOHOL
4.7.3 PHENOL AND ACETONE
4.7.4 ALTERNATIVE FEEDSTOCKS
4.8 SUPPLY CHAIN ANALYSIS
4.8.1 OVERVIEW
4.8.2 LOGISTIC COST SCENARIO
4.8.3 IMPORTANCE OF LOGISTICS SERVICE PROVIDERS
4.9 SUPPLY DEMAND DYNAMICS
4.9.1 SUPPLY SIDE DYNAMICS
4.9.1.1 RAW MATERIAL DEPENDENCY
4.9.1.2 PRODUCTION CAPACITY AND INTEGRATION
4.9.1.3 GEOGRAPHIC CONCENTRATION
4.9.1.4 PRICE VOLATILITY
4.9.2 DEMAND SIDE DYNAMICS
4.9.2.1 KEY END-USE APPLICATIONS
4.9.2.2 REGIONAL DEMAND TRENDS
4.9.2.3 SUBSTITUTION AND SUSTAINABILITY PRESSURES
4.9.2.4 DEMAND VOLATILITY AND ELASTICITY
4.1 TARIFFS AND THEIR IMPACT ON MARKET
4.10.1 CURRENT TARIFF RATES IN TOP 5 COUNTRY MARKETS
4.10.2 OUTLOOK: LOCAL PRODUCTION VS IMPORT RELIANCE
4.10.3 VENDOR SELECTION CRITERIA DYNAMICS
4.10.4 IMPACT ON SUPPLY CHAIN
4.10.4.1 RAW MATERIAL PROCUREMENT
4.10.4.2 MANUFACTURING AND PRODUCTION
4.10.4.3 LOGISTICS AND DISTRIBUTION:
4.10.4.4 PRICE PITCHING AND POSITIONING IN THE MARKET
4.10.5 INDUSTRY PARTICIPANTS: PROACTIVE MOVES
4.10.5.1 SUPPLY CHAIN OPTIMIZATION
4.10.5.2 JOINT VENTURE ESTABLISHMENTS
4.10.6 IMPACT ON PRICES
4.10.6.1 RAW MATERIAL DEPENDENCY
4.10.6.2 ENERGY AND LOGISTICS COSTS
4.10.6.3 REGIONAL SUPPLY-DEMAND GAPS
4.10.6.4 REGULATORY AND TRADE BARRIERS
4.10.7 REGULATORY INCLINATION
4.10.7.1 GEOPOLITICAL SITUATION
4.10.8 TRADE PARTNERSHIPS BETWEEN COUNTRIES
4.10.8.1 FREE TRADE AGREEMENTS
4.10.8.2 STATUS ACCREDITATION (INCLUDING MFN)
4.10.9 DOMESTIC COURSE OF CORRECTION
4.10.9.1 INCENTIVE SCHEMES TO BOOST PRODUCTION OUTPUTS
4.10.9.2 ESTABLISHMENT OF SPECIAL ECONOMIC ZONES / INDUSTRIAL PARKS
4.11 TECHNOLOGY ADVANCEMENT BY MANUFACTURERS
4.11.1 ADVANCED CATALYTIC PROCESSES
4.11.2 AUTOMATION AND PROCESS CONTROL
4.11.3 SUSTAINABLE PRODUCTION PRACTICES
4.11.4 PURIFICATION AND QUALITY ENHANCEMENT
4.11.5 EXPANSION OF APPLICATION AREAS
4.11.6 STRATEGIC INVESTMENTS AND COLLABORATIONS
5 REGULATORY COVERAGE
6 MARKET OVERVIEW
6.1 DRIVERS
6.1.1 RISING DEMAND FOR ABS RESINS IN AUTOMOTIVE AND CONSUMER GOODS
6.1.2 GROWTH IN CONSTRUCTION AND COATINGS INDUSTRIES
6.1.3 EXPANSION OF PACKAGING INDUSTRY
6.1.4 TECHNOLOGICAL ADVANCEMENTS IN POLYMER PRODUCTION
6.2 RESTRAINTS
6.2.1 VOLATILITY IN CRUDE OIL AND RAW MATERIAL PRICES
6.2.2 STRINGENT ENVIRONMENTAL AND HEALTH REGULATIONS
6.3 OPPORTUNITIES
6.3.1 R&D IN ECO-FRIENDLY AND HIGH-PERFORMANCE RESINS
6.3.2 RISING DEMAND FOR SPECIALTY CHEMICALS AND CUSTOM POLYMERS
6.3.3 POTENTIAL IN RECYCLABLE AND SUSTAINABLE AMS DERIVATIVES
6.4 CHALLENGES
6.4.1 SUPPLY CHAIN VULNERABILITIES DUE TO GEOPOLITICAL ISSUES
6.4.2 STIFF COMPETITION FROM BIO-BASED ALTERNATIVES
7 MIDDLE EAST AND AFRICA ALPHA-METHYLSTYRENE MARKET, BY PURITY
7.1 OVERVIEW
7.2 MORE THAN 99%
7.3 0.99
7.4 0.98
7.5 0.95
8 MIDDLE EAST AND AFRICA ALPHA-METHYLSTYRENE MARKET, BY GRADE
8.1 OVERVIEW
8.2 STANDARD GRADE
8.3 TECHNICAL GRADE
8.4 INDUSTRIAL GRADE
8.5 OTHERS
9 MIDDLE EAST AND AFRICA ALPHA-METHYLSTYRENE MARKET, BY PACKAGING QUANTITY
9.1 OVERVIEW
9.2 100-200 KG
9.3 50-100 KG
9.4 ABOVE 200 KG
9.5 25-50 KG
10 MIDDLE EAST AND AFRICA ALPHA-METHYLSTYRENE MARKET, BY PACKAGING
10.1 OVERVIEW
10.2 TANKER
10.3 DRUM
10.4 IBC
10.5 OTHERS
11 MIDDLE EAST AND AFRICA ALPHA-METHYLSTYRENE MARKET, BY APPLICATION
11.1 OVERVIEW
11.2 POLYMERS
11.3 BULK AND SPECIALTY CHEMICALS
12 MIDDLE EAST AND AFRICA ALPHA-METHYLSTYRENE MARKET, BY END-USE
12.1 OVERVIEW
12.2 AUTOMOTIVE
12.3 ELECTRONICS & ELECTRICAL
12.4 PHARMACEUTICALS
12.5 BUILDING & CONSTRUCTION
12.6 OIL & GAS
12.7 AGRICULTURE
12.8 TEXTILES
12.9 FOOD & BEVERAGES
12.1 OTHERS
13 MIDDLE EAST AND AFRICA ALPHA-METHYLSTYRENE MARKET, BY REGION
13.1 MIDDLE EAST AND AFRICA
13.1.1 SOUTH AFRICA
13.1.2 SAUDI ARABIA
13.1.3 U.A.E.
13.1.4 KUWAIT
13.1.5 ISREAL
13.1.6 OMAN
13.1.7 EGYPT
13.1.8 BAHRAIN
13.1.9 QATAR
13.1.10 REST OF MIDDLE EAST AND AFRICA
14 MIDDLE EAST AND AFRICA ALPHA-METHYLSTYRENE MARKET: COMPANY LANDSCAPE
14.1 COMPANY SHARE ANALYSIS: MIDDLE EAST AND AFRICA
15 SWOT ANALYSIS
16 COMPANY PROFILE
16.1 INEOS CAPITAL LIMITED
16.1.1 COMPANY SNAPSHOT
16.1.2 COMPANY SHARE ANALYSIS
16.1.3 PRODUCT PORTFOLIO
16.1.4 RECENT DEVELOPMENT
16.2 ADVANSIX
16.2.1 COMPANY SNAPSHOT
16.2.2 REVENUE ANALYSIS
16.2.3 COMPANY SHARE ANALYSIS
16.2.4 PRODUCT PORTFOLIO
16.2.5 RECENT DEVELOPMENT
16.3 MITSUBISHI CHEMICAL GROUP CORPORATION
16.3.1 COMPANY SNAPSHOT
16.3.2 REVENUE ANALYSIS
16.3.3 COMPANY SHARE ANALYSIS
16.3.4 PRODUCT PORTFOLIO
16.3.5 RECENT DEVELOPMENT
16.4 LG CHEM
16.4.1 COMPANY SNAPSHOT
16.4.2 REVENUE ANALYSIS
16.4.3 COMPANY SHARE ANALYSIS
16.4.4 PRODUCT PORTFOLIO
16.4.5 RECENT DEVELOPMENT
16.5 SOLVAY
16.5.1 COMPANY SNAPSHOT
16.5.2 REVENUE ANALYSIS
16.5.3 COMPANY SHARE ANALYSIS
16.5.4 PRODUCT PORTFOLIO
16.5.5 RECENT DEVELOPMENT
16.6 ALTIVIA
16.6.1 COMPANY SNAPSHOT
16.6.2 PRODUCT PORTFOLIO
16.6.3 RECENT DEVELOPMENT
16.7 DEEPAK
16.7.1 COMPANY SNAPSHOT
16.7.2 REVENUE ANALYSIS
16.7.3 PRODUCT PORTFOLIO
16.7.4 RECENT DEVELOPMENT
16.8 DOMO CHEMICALS
16.8.1 COMPANY SNAPSHOT
16.8.2 PRODUCT PORTFOLIO
16.8.3 RECENT DEVELOPMENT
16.9 EASTINDIACHEMICALS
16.9.1 COMPANY SNAPSHOT
16.9.2 PRODUCT PORTFOLIO
16.9.3 RECENT DEVELOPMENT
16.1 EQUILEX BV
16.10.1 COMPANY SNAPSHOT
16.10.2 PRODUCT PORTFOLIO
16.10.3 RECENT DEVELOPMENT
16.11 EVONIK INDUSTRIES AG
16.11.1 COMPANY SNAPSHOT
16.11.2 REVENUE ANALYSIS
16.11.3 PRODUCT PORTFOLIO
16.11.4 RECENT DEVELOPMENT
16.12 GROUP OF COMPANIES «TITAN»
16.12.1 COMPANY SNAPSHOT
16.12.2 PRODUCT PORTFOLIO
16.12.3 RECENT DEVELOPMENT
16.13 HEFEI TNJ CHEMICAL INDUSTRY CO.,LTD.
16.13.1 COMPANY SNAPSHOT
16.13.2 PRODUCT PORTFOLIO
16.13.3 RECENT DEVELOPMENT
16.14 KRATON CORPORATION
16.14.1 COMPANY SNAPSHOT
16.14.2 PRODUCT PORTFOLIO
16.14.3 RECENT DEVELOPMENT
16.15 KUMHO P&B CHEMICALS.,INC.
16.15.1 COMPANY SNAPSHOT
16.15.2 PRODUCT PORTFOLIO
16.15.3 RECENT DEVELOPMENT
16.16 MAHA AUTOMATIONS
16.16.1 COMPANY SNAPSHOT
16.16.2 PRODUCT PORTFOLIO
16.16.3 RECENT DEVELOPMENT
16.17 MOEVE
16.17.1 COMPANY SNAPSHOT
16.17.2 PRODUCT PORTFOLIO
16.17.3 RECENT DEVELOPMENT
16.18 OTTO CHEMIE PVT. LTD
16.18.1 COMPANY SNAPSHOT
16.18.2 PRODUCT PORTFOLIO
16.18.3 RECENT DEVELOPMENT
16.19 PRASOL CHEMICALS LIMITED
16.19.1 COMPANY SNAPSHOT
16.19.2 PRODUCT PORTFOLIO
16.19.3 RECENT DEVELOPMENT
16.2 ROSNEFT
16.20.1 COMPANY SNAPSHOT
16.20.2 REVENUE ANALYSIS
16.20.3 PRODUCT PORTFOLIO
16.20.4 RECENT DEVELOPMENT
16.21 RXCHEMICALS
16.21.1 COMPANY SNAPSHOT
16.21.2 PRODUCT PORTFOLIO
16.21.3 RECENT DEVELOPMENT
16.22 SEQENS
16.22.1 COMPANY SNAPSHOT
16.22.2 PRODUCT PORTFOLIO
16.22.3 RECENT DEVELOPMENT
16.23 SHANGHAI THEOREM CHEMICAL TECHNOLOGY CO., LTD.
16.23.1 COMPANY SNAPSHOT
16.23.2 PRODUCT PORTFOLIO
16.23.3 RECENT DEVELOPMENT
16.24 SI GROUP, INC.
16.24.1 COMPANY SNAPSHOT
16.24.2 PRODUCT PORTFOLIO
16.24.3 RECENT DEVELOPMENT
16.25 SIMSON PHARMA LIMITED
16.25.1 COMPANY SNAPSHOT
16.25.2 PRODUCT PORTFOLIO
16.25.3 RECENT DEVELOPMENT
16.26 TIANJIN ZHONGXIN CHEMTECH CO.,LTD.
16.26.1 COMPANY SNAPSHOT
16.26.2 PRODUCT PORTFOLIO
16.26.3 RECENT DEVELOPMENT
16.27 TOKYO CHEMICAL INDUSTRY (INDIA) PVT. LTD.
16.27.1 COMPANY SNAPSHOT
16.27.2 PRODUCT PORTFOLIO
16.27.3 RECENT DEVELOPMENT
16.28 VIZAGCHEMICAL
16.28.1 COMPANY SNAPSHOT
16.28.2 PRODUCT PORTFOLIO
16.28.3 RECENT DEVELOPMENT
17 QUESTIONNAIRE
18 RELATED REPORTS
List of Table
TABLE 1 REGULATORY COVERAGE
TABLE 2 MIDDLE EAST AND AFRICA ALPHA-METHYLSTYRENE MARKET, BY PURITY, 2018-2032 (USD)
TABLE 3 MIDDLE EAST AND AFRICA ALPHA-METHYLSTYRENE MARKET, BY PURITY, 2018-2032 (TONS)
TABLE 4 MIDDLE EAST AND AFRICA MORE THAN 99% IN ALPHA-METHYLSTYRENE MARKET, BY REGION, 2018-2032 (USD)
TABLE 5 MIDDLE EAST AND AFRICA MORE THAN 99% IN ALPHA-METHYLSTYRENE MARKET, BY REGION, 2018-2032 (TONS)
TABLE 6 MIDDLE EAST AND AFRICA 99% IN ALPHA-METHYLSTYRENE MARKET, BY REGION, 2018-2032 (USD)
TABLE 7 MIDDLE EAST AND AFRICA 99% IN ALPHA-METHYLSTYRENE MARKET, BY REGION, 2018-2032 (TONS)
TABLE 8 MIDDLE EAST AND AFRICA 98% IN ALPHA-METHYLSTYRENE MARKET, BY REGION, 2018-2032 (USD)
TABLE 9 MIDDLE EAST AND AFRICA 98% IN ALPHA-METHYLSTYRENE MARKET, BY REGION, 2018-2032 (TONS)
TABLE 10 MIDDLE EAST AND AFRICA 95% IN ALPHA-METHYLSTYRENE MARKET, BY REGION, 2018-2032 (USD)
TABLE 11 MIDDLE EAST AND AFRICA 95% IN ALPHA-METHYLSTYRENE MARKET, BY REGION, 2018-2032 (TONS)
TABLE 12 MIDDLE EAST AND AFRICA ALPHA-METHYLSTYRENE MARKET, BY GRADE, 2018-2032 (USD)
TABLE 13 MIDDLE EAST AND AFRICA STANDARD GRADE IN ALPHA-METHYLSTYRENE MARKET, BY REGION, 2018-2032 (USD)
TABLE 14 MIDDLE EAST AND AFRICA TECHNICAL GRADE IN ALPHA-METHYLSTYRENE MARKET, BY REGION, 2018-2032 (USD)
TABLE 15 MIDDLE EAST AND AFRICA INDUSTRIAL GRADE IN ALPHA-METHYLSTYRENE MARKET, BY REGION, 2018-2032 (USD)
TABLE 16 MIDDLE EAST AND AFRICA OTHERS IN ALPHA-METHYLSTYRENE MARKET, BY REGION, 2018-2032 (USD)
TABLE 17 MIDDLE EAST AND AFRICA ALPHA-METHYLSTYRENE MARKET, BY PACKAGING QUANTITY, 2018-2032 (USD)
TABLE 18 MIDDLE EAST AND AFRICA 100-200 KG IN ALPHA-METHYLSTYRENE MARKET, BY REGION, 2018-2032 (USD)
TABLE 19 MIDDLE EAST AND AFRICA 50-100 KG IN ALPHA-METHYLSTYRENE MARKET, BY REGION, 2018-2032 (USD)
TABLE 20 MIDDLE EAST AND AFRICA ABOVE 200 KG IN ALPHA-METHYLSTYRENE MARKET, BY REGION, 2018-2032 (USD)
TABLE 21 MIDDLE EAST AND AFRICA 25-50 KG IN ALPHA-METHYLSTYRENE MARKET, BY REGION, 2018-2032 (USD)
TABLE 22 MIDDLE EAST AND AFRICA ALPHA-METHYLSTYRENE MARKET, BY PACKAGING, 2018-2032 (USD)
TABLE 23 MIDDLE EAST AND AFRICA TANKER IN ALPHA-METHYLSTYRENE MARKET, BY REGION, 2018-2032 (USD)
TABLE 24 MIDDLE EAST AND AFRICA DRUM IN ALPHA-METHYLSTYRENE MARKET, BY REGION, 2018-2032 (USD)
TABLE 25 MIDDLE EAST AND AFRICA DRUM IN ALPHA-METHYLSTYRENE MARKET, BY MATERIAL, 2018-2032 (USD)
TABLE 26 MIDDLE EAST AND AFRICA IBC IN ALPHA-METHYLSTYRENE MARKET, BY REGION, 2018-2032 (USD)
TABLE 27 MIDDLE EAST AND AFRICA OTHERS IN ALPHA-METHYLSTYRENE MARKET, BY REGION, 2018-2032 (USD)
TABLE 28 MIDDLE EAST AND AFRICA ALPHA-METHYLSTYRENE MARKET, BY APPLICATION, 2018-2032 (USD)
TABLE 29 MIDDLE EAST AND AFRICA POLYMERS IN ALPHA-METHYLSTYRENE MARKET, BY REGION, 2018-2032 (USD)
TABLE 30 MIDDLE EAST AND AFRICA POLYMERS IN ALPHA-METHYLSTYRENE MARKET, BY RESIN, 2018-2032 (USD)
TABLE 31 MIDDLE EAST AND AFRICA POLYMERS IN ALPHA-METHYLSTYRENE MARKET, BY PLASTIC, 2018-2032 (USD)
TABLE 32 MIDDLE EAST AND AFRICA BULK AND SPECIALTY CHEMICALS IN ALPHA-METHYLSTYRENE MARKET, BY REGION, 2018-2032 (USD)
TABLE 33 MIDDLE EAST AND AFRICA BULK AND SPECIALTY CHEMICALS IN ALPHA-METHYLSTYRENE MARKET, BY TYPE, 2018-2032 (USD)
TABLE 34 MIDDLE EAST AND AFRICA ALPHA-METHYLSTYRENE MARKET, BY END-USE, 2018-2032 (USD)
TABLE 35 MIDDLE EAST AND AFRICA AUTOMOTIVE IN ALPHA-METHYLSTYRENE MARKET, BY REGION, 2018-2032 (USD)
TABLE 36 MIDDLE EAST AND AFRICA AUTOMOTIVE IN ALPHA-METHYLSTYRENE MARKET, BY APPLICATION, 2018-2032 (USD)
TABLE 37 MIDDLE EAST AND AFRICA ELECTRONICS & ELECTRICAL IN ALPHA-METHYLSTYRENE MARKET, BY REGION, 2018-2032 (USD)
TABLE 38 MIDDLE EAST AND AFRICA ELECTRONICS & ELECTRICAL IN ALPHA-METHYLSTYRENE MARKET, BY APPLICATION, 2018-2032 (USD)
TABLE 39 MIDDLE EAST AND AFRICA PHARMACEUTICALS IN ALPHA-METHYLSTYRENE MARKET, BY REGION, 2018-2032 (USD)
TABLE 40 MIDDLE EAST AND AFRICA PHARMACEUTICALS IN ALPHA-METHYLSTYRENE MARKET, BY APPLICATION, 2018-2032 (USD)
TABLE 41 MIDDLE EAST AND AFRICA BUILDING & CONSTRUCTION IN ALPHA-METHYLSTYRENE MARKET, BY REGION, 2018-2032 (USD)
TABLE 42 MIDDLE EAST AND AFRICA BUILDING & CONSTRUCTION IN ALPHA-METHYLSTYRENE MARKET, BY APPLICATION, 2018-2032 (USD)
TABLE 43 MIDDLE EAST AND AFRICA OIL & GAS IN ALPHA-METHYLSTYRENE MARKET, BY REGION, 2018-2032 (USD)
TABLE 44 MIDDLE EAST AND AFRICA OIL & GAS IN ALPHA-METHYLSTYRENE MARKET, BY APPLICATION, 2018-2032 (USD)
TABLE 45 MIDDLE EAST AND AFRICA AGRICULTURE IN ALPHA-METHYLSTYRENE MARKET, BY REGION, 2018-2032 (USD)
TABLE 46 MIDDLE EAST AND AFRICA AGRICULTURE IN ALPHA-METHYLSTYRENE MARKET, BY APPLICATION, 2018-2032 (USD)
TABLE 47 MIDDLE EAST AND AFRICA TEXTILES IN ALPHA-METHYLSTYRENE MARKET, BY REGION, 2018-2032 (USD)
TABLE 48 MIDDLE EAST AND AFRICA TEXTILES IN ALPHA-METHYLSTYRENE MARKET, BY APPLICATION, 2018-2032 (USD)
TABLE 49 MIDDLE EAST AND AFRICA FOOD & BEVERAGES IN ALPHA-METHYLSTYRENE MARKET, BY REGION, 2018-2032 (USD)
TABLE 50 MIDDLE EAST AND AFRICA FOOD & BEVERAGES IN ALPHA-METHYLSTYRENE MARKET, BY APPLICATION, 2018-2032 (USD)
TABLE 51 MIDDLE EAST AND AFRICA OTHERS IN ALPHA-METHYLSTYRENE MARKET, BY REGION, 2018-2032 (USD)
TABLE 52 MIDDLE EAST AND AFRICA OTHERS IN ALPHA-METHYLSTYRENE MARKET, BY APPLICATION, 2018-2032 (USD)
TABLE 53 MIDDLE EAST AND AFRICA ALPHA-METHYLSTYRENE MARKET, BY COUNTRY, 2018-2032 (USD)
TABLE 54 MIDDLE EAST AND AFRICA ALPHA-METHYLSTYRENE MARKET, BY COUNTRY, 2018-2032 (TONS)
TABLE 55 MIDDLE EAST AND AFRICA ALPHA-METHYLSTYRENE MARKET, BY PURITY, 2018-2032 (USD)
TABLE 56 MIDDLE EAST AND AFRICA ALPHA-METHYLSTYRENE MARKET, BY PURITY, 2018-2032 (TONS)
TABLE 57 MIDDLE EAST AND AFRICA ALPHA-METHYLSTYRENE MARKET, BY GRADE, 2018-2032 (USD)
TABLE 58 MIDDLE EAST AND AFRICA ALPHA-METHYLSTYRENE MARKET, BY PACKAGING QUANTITY, 2018-2032 (USD)
TABLE 59 MIDDLE EAST AND AFRICA ALPHA-METHYLSTYRENE MARKET, BY PACKAGING, 2018-2032 (USD)
TABLE 60 MIDDLE EAST AND AFRICA DRUM IN ALPHA-METHYLSTYRENE MARKET, BY MATERIAL, 2018-2032 (USD)
TABLE 61 MIDDLE EAST AND AFRICA ALPHA-METHYLSTYRENE MARKET, BY APPLICATION, 2018-2032 (USD)
TABLE 62 MIDDLE EAST AND AFRICA POLYMERS IN ALPHA-METHYLSTYRENE MARKET, BY RESIN, 2018-2032 (USD)
TABLE 63 MIDDLE EAST AND AFRICA POLYMERS IN ALPHA-METHYLSTYRENE MARKET, BY PLASTIC, 2018-2032 (USD)
TABLE 64 MIDDLE EAST AND AFRICA BULK AND SPECIALTY CHEMICALS IN ALPHA-METHYLSTYRENE MARKET, BY TYPE, 2018-2032 (USD)
TABLE 65 MIDDLE EAST AND AFRICA ALPHA-METHYLSTYRENE MARKET, BY END-USE, 2018-2032 (USD)
TABLE 66 MIDDLE EAST AND AFRICA AUTOMOTIVE IN ALPHA-METHYLSTYRENE MARKET, BY APPLICATION, 2018-2032 (USD)
TABLE 67 MIDDLE EAST AND AFRICA ELECTRONICS & ELECTRICAL IN ALPHA-METHYLSTYRENE MARKET, BY APPLICATION, 2018-2032 (USD)
TABLE 68 MIDDLE EAST AND AFRICA PHARMACEUTICALS IN ALPHA-METHYLSTYRENE MARKET, BY APPLICATION, 2018-2032 (USD)
TABLE 69 MIDDLE EAST AND AFRICA BUILDING & CONSTRUCTION IN ALPHA-METHYLSTYRENE MARKET, BY APPLICATION, 2018-2032 (USD)
TABLE 70 MIDDLE EAST AND AFRICA OIL & GAS IN ALPHA-METHYLSTYRENE MARKET, BY APPLICATION, 2018-2032 (USD)
TABLE 71 MIDDLE EAST AND AFRICA AGRICULTURE IN ALPHA-METHYLSTYRENE MARKET, BY APPLICATION, 2018-2032 (USD)
TABLE 72 MIDDLE EAST AND AFRICA TEXTILES IN ALPHA-METHYLSTYRENE MARKET, BY APPLICATION, 2018-2032 (USD)
TABLE 73 MIDDLE EAST AND AFRICA FOOD & BEVERAGES IN ALPHA-METHYLSTYRENE MARKET, BY APPLICATION, 2018-2032 (USD)
TABLE 74 MIDDLE EAST AND AFRICA OTHERS IN ALPHA-METHYLSTYRENE MARKET, BY APPLICATION, 2018-2032 (USD)
TABLE 75 SOUTH AFRICA ALPHA-METHYLSTYRENE MARKET, BY PURITY, 2018-2032 (USD)
TABLE 76 SOUTH AFRICA ALPHA-METHYLSTYRENE MARKET, BY PURITY, 2018-2032 (TONS)
TABLE 77 SOUTH AFRICA ALPHA-METHYLSTYRENE MARKET, BY GRADE, 2018-2032 (USD)
TABLE 78 SOUTH AFRICA ALPHA-METHYLSTYRENE MARKET, BY PACKAGING QUANTITY, 2018-2032 (USD)
TABLE 79 SOUTH AFRICA ALPHA-METHYLSTYRENE MARKET, BY PACKAGING, 2018-2032 (USD)
TABLE 80 SOUTH AFRICA DRUM IN ALPHA-METHYLSTYRENE MARKET, BY MATERIAL, 2018-2032 (USD)
TABLE 81 SOUTH AFRICA ALPHA-METHYLSTYRENE MARKET, BY APPLICATION, 2018-2032 (USD)
TABLE 82 SOUTH AFRICA POLYMERS IN ALPHA-METHYLSTYRENE MARKET, BY RESIN, 2018-2032 (USD)
TABLE 83 SOUTH AFRICA POLYMERS IN ALPHA-METHYLSTYRENE MARKET, BY PLASTIC, 2018-2032 (USD)
TABLE 84 SOUTH AFRICA BULK AND SPECIALTY CHEMICALS IN ALPHA-METHYLSTYRENE MARKET, BY TYPE, 2018-2032 (USD)
TABLE 85 SOUTH AFRICA ALPHA-METHYLSTYRENE MARKET, BY END-USE, 2018-2032 (USD)
TABLE 86 SOUTH AFRICA AUTOMOTIVE IN ALPHA-METHYLSTYRENE MARKET, BY APPLICATION, 2018-2032 (USD)
TABLE 87 SOUTH AFRICA ELECTRONICS & ELECTRICAL IN ALPHA-METHYLSTYRENE MARKET, BY APPLICATION, 2018-2032 (USD)
TABLE 88 SOUTH AFRICA PHARMACEUTICALS IN ALPHA-METHYLSTYRENE MARKET, BY APPLICATION, 2018-2032 (USD)
TABLE 89 SOUTH AFRICA BUILDING & CONSTRUCTION IN ALPHA-METHYLSTYRENE MARKET, BY APPLICATION, 2018-2032 (USD)
TABLE 90 SOUTH AFRICA OIL & GAS IN ALPHA-METHYLSTYRENE MARKET, BY APPLICATION, 2018-2032 (USD)
TABLE 91 SOUTH AFRICA AGRICULTURE IN ALPHA-METHYLSTYRENE MARKET, BY APPLICATION, 2018-2032 (USD)
TABLE 92 SOUTH AFRICA TEXTILES IN ALPHA-METHYLSTYRENE MARKET, BY APPLICATION, 2018-2032 (USD)
TABLE 93 SOUTH AFRICA FOOD & BEVERAGES IN ALPHA-METHYLSTYRENE MARKET, BY APPLICATION, 2018-2032 (USD)
TABLE 94 SOUTH AFRICA OTHERS IN ALPHA-METHYLSTYRENE MARKET, BY APPLICATION, 2018-2032 (USD)
TABLE 95 SAUDI ARABIA ALPHA-METHYLSTYRENE MARKET, BY PURITY, 2018-2032 (USD)
TABLE 96 SAUDI ARABIA ALPHA-METHYLSTYRENE MARKET, BY PURITY, 2018-2032 (TONS)
TABLE 97 SAUDI ARABIA ALPHA-METHYLSTYRENE MARKET, BY GRADE, 2018-2032 (USD)
TABLE 98 SAUDI ARABIA ALPHA-METHYLSTYRENE MARKET, BY PACKAGING QUANTITY, 2018-2032 (USD)
TABLE 99 SAUDI ARABIA ALPHA-METHYLSTYRENE MARKET, BY PACKAGING, 2018-2032 (USD)
TABLE 100 SAUDI ARABIA DRUM IN ALPHA-METHYLSTYRENE MARKET, BY MATERIAL, 2018-2032 (USD)
TABLE 101 SAUDI ARABIA ALPHA-METHYLSTYRENE MARKET, BY APPLICATION, 2018-2032 (USD)
TABLE 102 SAUDI ARABIA POLYMERS IN ALPHA-METHYLSTYRENE MARKET, BY RESIN, 2018-2032 (USD)
TABLE 103 SAUDI ARABIA POLYMERS IN ALPHA-METHYLSTYRENE MARKET, BY PLASTIC, 2018-2032 (USD)
TABLE 104 SAUDI ARABIA BULK AND SPECIALTY CHEMICALS IN ALPHA-METHYLSTYRENE MARKET, BY TYPE, 2018-2032 (USD)
TABLE 105 SAUDI ARABIA ALPHA-METHYLSTYRENE MARKET, BY END-USE, 2018-2032 (USD)
TABLE 106 SAUDI ARABIA AUTOMOTIVE IN ALPHA-METHYLSTYRENE MARKET, BY APPLICATION, 2018-2032 (USD)
TABLE 107 SAUDI ARABIA ELECTRONICS & ELECTRICAL IN ALPHA-METHYLSTYRENE MARKET, BY APPLICATION, 2018-2032 (USD)
TABLE 108 SAUDI ARABIA PHARMACEUTICALS IN ALPHA-METHYLSTYRENE MARKET, BY APPLICATION, 2018-2032 (USD)
TABLE 109 SAUDI ARABIA BUILDING & CONSTRUCTION IN ALPHA-METHYLSTYRENE MARKET, BY APPLICATION, 2018-2032 (USD)
TABLE 110 SAUDI ARABIA OIL & GAS IN ALPHA-METHYLSTYRENE MARKET, BY APPLICATION, 2018-2032 (USD)
TABLE 111 SAUDI ARABIA AGRICULTURE IN ALPHA-METHYLSTYRENE MARKET, BY APPLICATION, 2018-2032 (USD)
TABLE 112 SAUDI ARABIA TEXTILES IN ALPHA-METHYLSTYRENE MARKET, BY APPLICATION, 2018-2032 (USD)
TABLE 113 SAUDI ARABIA FOOD & BEVERAGES IN ALPHA-METHYLSTYRENE MARKET, BY APPLICATION, 2018-2032 (USD)
TABLE 114 SAUDI ARABIA OTHERS IN ALPHA-METHYLSTYRENE MARKET, BY APPLICATION, 2018-2032 (USD)
TABLE 115 U.A.E. ALPHA-METHYLSTYRENE MARKET, BY PURITY, 2018-2032 (USD)
TABLE 116 U.A.E. ALPHA-METHYLSTYRENE MARKET, BY PURITY, 2018-2032 (TONS)
TABLE 117 U.A.E. ALPHA-METHYLSTYRENE MARKET, BY GRADE, 2018-2032 (USD)
TABLE 118 U.A.E. ALPHA-METHYLSTYRENE MARKET, BY PACKAGING QUANTITY, 2018-2032 (USD)
TABLE 119 U.A.E. ALPHA-METHYLSTYRENE MARKET, BY PACKAGING, 2018-2032 (USD)
TABLE 120 U.A.E. DRUM IN ALPHA-METHYLSTYRENE MARKET, BY MATERIAL, 2018-2032 (USD)
TABLE 121 U.A.E. ALPHA-METHYLSTYRENE MARKET, BY APPLICATION, 2018-2032 (USD)
TABLE 122 U.A.E. POLYMERS IN ALPHA-METHYLSTYRENE MARKET, BY RESIN, 2018-2032 (USD)
TABLE 123 U.A.E. POLYMERS IN ALPHA-METHYLSTYRENE MARKET, BY PLASTIC, 2018-2032 (USD)
TABLE 124 U.A.E. BULK AND SPECIALTY CHEMICALS IN ALPHA-METHYLSTYRENE MARKET, BY TYPE, 2018-2032 (USD)
TABLE 125 U.A.E. ALPHA-METHYLSTYRENE MARKET, BY END-USE, 2018-2032 (USD)
TABLE 126 U.A.E. AUTOMOTIVE IN ALPHA-METHYLSTYRENE MARKET, BY APPLICATION, 2018-2032 (USD)
TABLE 127 U.A.E. ELECTRONICS & ELECTRICAL IN ALPHA-METHYLSTYRENE MARKET, BY APPLICATION, 2018-2032 (USD)
TABLE 128 U.A.E. PHARMACEUTICALS IN ALPHA-METHYLSTYRENE MARKET, BY APPLICATION, 2018-2032 (USD)
TABLE 129 U.A.E. BUILDING & CONSTRUCTION IN ALPHA-METHYLSTYRENE MARKET, BY APPLICATION, 2018-2032 (USD)
TABLE 130 U.A.E. OIL & GAS IN ALPHA-METHYLSTYRENE MARKET, BY APPLICATION, 2018-2032 (USD)
TABLE 131 U.A.E. AGRICULTURE IN ALPHA-METHYLSTYRENE MARKET, BY APPLICATION, 2018-2032 (USD)
TABLE 132 U.A.E. TEXTILES IN ALPHA-METHYLSTYRENE MARKET, BY APPLICATION, 2018-2032 (USD)
TABLE 133 U.A.E. FOOD & BEVERAGES IN ALPHA-METHYLSTYRENE MARKET, BY APPLICATION, 2018-2032 (USD)
TABLE 134 U.A.E. OTHERS IN ALPHA-METHYLSTYRENE MARKET, BY APPLICATION, 2018-2032 (USD)
TABLE 135 KUWAIT ALPHA-METHYLSTYRENE MARKET, BY PURITY, 2018-2032 (USD)
TABLE 136 KUWAIT ALPHA-METHYLSTYRENE MARKET, BY PURITY, 2018-2032 (TONS)
TABLE 137 KUWAIT ALPHA-METHYLSTYRENE MARKET, BY GRADE, 2018-2032 (USD)
TABLE 138 KUWAIT ALPHA-METHYLSTYRENE MARKET, BY PACKAGING QUANTITY, 2018-2032 (USD)
TABLE 139 KUWAIT ALPHA-METHYLSTYRENE MARKET, BY PACKAGING, 2018-2032 (USD)
TABLE 140 KUWAIT DRUM IN ALPHA-METHYLSTYRENE MARKET, BY MATERIAL, 2018-2032 (USD)
TABLE 141 KUWAIT ALPHA-METHYLSTYRENE MARKET, BY APPLICATION, 2018-2032 (USD)
TABLE 142 KUWAIT POLYMERS IN ALPHA-METHYLSTYRENE MARKET, BY RESIN, 2018-2032 (USD)
TABLE 143 KUWAIT POLYMERS IN ALPHA-METHYLSTYRENE MARKET, BY PLASTIC, 2018-2032 (USD)
TABLE 144 KUWAIT BULK AND SPECIALTY CHEMICALS IN ALPHA-METHYLSTYRENE MARKET, BY TYPE, 2018-2032 (USD)
TABLE 145 KUWAIT ALPHA-METHYLSTYRENE MARKET, BY END-USE, 2018-2032 (USD)
TABLE 146 KUWAIT AUTOMOTIVE IN ALPHA-METHYLSTYRENE MARKET, BY APPLICATION, 2018-2032 (USD)
TABLE 147 KUWAIT ELECTRONICS & ELECTRICAL IN ALPHA-METHYLSTYRENE MARKET, BY APPLICATION, 2018-2032 (USD)
TABLE 148 KUWAIT PHARMACEUTICALS IN ALPHA-METHYLSTYRENE MARKET, BY APPLICATION, 2018-2032 (USD)
TABLE 149 KUWAIT BUILDING & CONSTRUCTION IN ALPHA-METHYLSTYRENE MARKET, BY APPLICATION, 2018-2032 (USD)
TABLE 150 KUWAIT OIL & GAS IN ALPHA-METHYLSTYRENE MARKET, BY APPLICATION, 2018-2032 (USD)
TABLE 151 KUWAIT AGRICULTURE IN ALPHA-METHYLSTYRENE MARKET, BY APPLICATION, 2018-2032 (USD)
TABLE 152 KUWAIT TEXTILES IN ALPHA-METHYLSTYRENE MARKET, BY APPLICATION, 2018-2032 (USD)
TABLE 153 KUWAIT FOOD & BEVERAGES IN ALPHA-METHYLSTYRENE MARKET, BY APPLICATION, 2018-2032 (USD)
TABLE 154 KUWAIT OTHERS IN ALPHA-METHYLSTYRENE MARKET, BY APPLICATION, 2018-2032 (USD)
TABLE 155 ISREAL ALPHA-METHYLSTYRENE MARKET, BY PURITY, 2018-2032 (USD)
TABLE 156 ISREAL ALPHA-METHYLSTYRENE MARKET, BY PURITY, 2018-2032 (TONS)
TABLE 157 ISREAL ALPHA-METHYLSTYRENE MARKET, BY GRADE, 2018-2032 (USD)
TABLE 158 ISREAL ALPHA-METHYLSTYRENE MARKET, BY PACKAGING QUANTITY, 2018-2032 (USD)
TABLE 159 ISREAL ALPHA-METHYLSTYRENE MARKET, BY PACKAGING, 2018-2032 (USD)
TABLE 160 ISREAL DRUM IN ALPHA-METHYLSTYRENE MARKET, BY MATERIAL, 2018-2032 (USD)
TABLE 161 ISREAL ALPHA-METHYLSTYRENE MARKET, BY APPLICATION, 2018-2032 (USD)
TABLE 162 ISREAL POLYMERS IN ALPHA-METHYLSTYRENE MARKET, BY RESIN, 2018-2032 (USD)
TABLE 163 ISREAL POLYMERS IN ALPHA-METHYLSTYRENE MARKET, BY PLASTIC, 2018-2032 (USD)
TABLE 164 ISREAL BULK AND SPECIALTY CHEMICALS IN ALPHA-METHYLSTYRENE MARKET, BY TYPE, 2018-2032 (USD)
TABLE 165 ISREAL ALPHA-METHYLSTYRENE MARKET, BY END-USE, 2018-2032 (USD)
TABLE 166 ISREAL AUTOMOTIVE IN ALPHA-METHYLSTYRENE MARKET, BY APPLICATION, 2018-2032 (USD)
TABLE 167 ISREAL ELECTRONICS & ELECTRICAL IN ALPHA-METHYLSTYRENE MARKET, BY APPLICATION, 2018-2032 (USD)
TABLE 168 ISREAL PHARMACEUTICALS IN ALPHA-METHYLSTYRENE MARKET, BY APPLICATION, 2018-2032 (USD)
TABLE 169 ISREAL BUILDING & CONSTRUCTION IN ALPHA-METHYLSTYRENE MARKET, BY APPLICATION, 2018-2032 (USD)
TABLE 170 ISREAL OIL & GAS IN ALPHA-METHYLSTYRENE MARKET, BY APPLICATION, 2018-2032 (USD)
TABLE 171 ISREAL AGRICULTURE IN ALPHA-METHYLSTYRENE MARKET, BY APPLICATION, 2018-2032 (USD)
TABLE 172 ISREAL TEXTILES IN ALPHA-METHYLSTYRENE MARKET, BY APPLICATION, 2018-2032 (USD)
TABLE 173 ISREAL FOOD & BEVERAGES IN ALPHA-METHYLSTYRENE MARKET, BY APPLICATION, 2018-2032 (USD)
TABLE 174 ISREAL OTHERS IN ALPHA-METHYLSTYRENE MARKET, BY APPLICATION, 2018-2032 (USD)
TABLE 175 OMAN ALPHA-METHYLSTYRENE MARKET, BY PURITY, 2018-2032 (USD)
TABLE 176 OMAN ALPHA-METHYLSTYRENE MARKET, BY PURITY, 2018-2032 (TONS)
TABLE 177 OMAN ALPHA-METHYLSTYRENE MARKET, BY GRADE, 2018-2032 (USD)
TABLE 178 OMAN ALPHA-METHYLSTYRENE MARKET, BY PACKAGING QUANTITY, 2018-2032 (USD)
TABLE 179 OMAN ALPHA-METHYLSTYRENE MARKET, BY PACKAGING, 2018-2032 (USD)
TABLE 180 OMAN DRUM IN ALPHA-METHYLSTYRENE MARKET, BY MATERIAL, 2018-2032 (USD)
TABLE 181 OMAN ALPHA-METHYLSTYRENE MARKET, BY APPLICATION, 2018-2032 (USD)
TABLE 182 OMAN POLYMERS IN ALPHA-METHYLSTYRENE MARKET, BY RESIN, 2018-2032 (USD)
TABLE 183 OMAN POLYMERS IN ALPHA-METHYLSTYRENE MARKET, BY PLASTIC, 2018-2032 (USD)
TABLE 184 OMAN BULK AND SPECIALTY CHEMICALS IN ALPHA-METHYLSTYRENE MARKET, BY TYPE, 2018-2032 (USD)
TABLE 185 OMAN ALPHA-METHYLSTYRENE MARKET, BY END-USE, 2018-2032 (USD)
TABLE 186 OMAN AUTOMOTIVE IN ALPHA-METHYLSTYRENE MARKET, BY APPLICATION, 2018-2032 (USD)
TABLE 187 OMAN ELECTRONICS & ELECTRICAL IN ALPHA-METHYLSTYRENE MARKET, BY APPLICATION, 2018-2032 (USD)
TABLE 188 OMAN PHARMACEUTICALS IN ALPHA-METHYLSTYRENE MARKET, BY APPLICATION, 2018-2032 (USD)
TABLE 189 OMAN BUILDING & CONSTRUCTION IN ALPHA-METHYLSTYRENE MARKET, BY APPLICATION, 2018-2032 (USD)
TABLE 190 OMAN OIL & GAS IN ALPHA-METHYLSTYRENE MARKET, BY APPLICATION, 2018-2032 (USD)
TABLE 191 OMAN AGRICULTURE IN ALPHA-METHYLSTYRENE MARKET, BY APPLICATION, 2018-2032 (USD)
TABLE 192 OMAN TEXTILES IN ALPHA-METHYLSTYRENE MARKET, BY APPLICATION, 2018-2032 (USD)
TABLE 193 OMAN FOOD & BEVERAGES IN ALPHA-METHYLSTYRENE MARKET, BY APPLICATION, 2018-2032 (USD)
TABLE 194 OMAN OTHERS IN ALPHA-METHYLSTYRENE MARKET, BY APPLICATION, 2018-2032 (USD)
TABLE 195 EGYPT ALPHA-METHYLSTYRENE MARKET, BY PURITY, 2018-2032 (USD)
TABLE 196 EGYPT ALPHA-METHYLSTYRENE MARKET, BY PURITY, 2018-2032 (TONS)
TABLE 197 EGYPT ALPHA-METHYLSTYRENE MARKET, BY GRADE, 2018-2032 (USD)
TABLE 198 EGYPT ALPHA-METHYLSTYRENE MARKET, BY PACKAGING QUANTITY, 2018-2032 (USD)
TABLE 199 EGYPT ALPHA-METHYLSTYRENE MARKET, BY PACKAGING, 2018-2032 (USD)
TABLE 200 EGYPT DRUM IN ALPHA-METHYLSTYRENE MARKET, BY MATERIAL, 2018-2032 (USD)
TABLE 201 EGYPT ALPHA-METHYLSTYRENE MARKET, BY APPLICATION, 2018-2032 (USD)
TABLE 202 EGYPT POLYMERS IN ALPHA-METHYLSTYRENE MARKET, BY RESIN, 2018-2032 (USD)
TABLE 203 EGYPT POLYMERS IN ALPHA-METHYLSTYRENE MARKET, BY PLASTIC, 2018-2032 (USD)
TABLE 204 EGYPT BULK AND SPECIALTY CHEMICALS IN ALPHA-METHYLSTYRENE MARKET, BY TYPE, 2018-2032 (USD)
TABLE 205 EGYPT ALPHA-METHYLSTYRENE MARKET, BY END-USE, 2018-2032 (USD)
TABLE 206 EGYPT AUTOMOTIVE IN ALPHA-METHYLSTYRENE MARKET, BY APPLICATION, 2018-2032 (USD)
TABLE 207 EGYPT ELECTRONICS & ELECTRICAL IN ALPHA-METHYLSTYRENE MARKET, BY APPLICATION, 2018-2032 (USD)
TABLE 208 EGYPT PHARMACEUTICALS IN ALPHA-METHYLSTYRENE MARKET, BY APPLICATION, 2018-2032 (USD)
TABLE 209 EGYPT BUILDING & CONSTRUCTION IN ALPHA-METHYLSTYRENE MARKET, BY APPLICATION, 2018-2032 (USD)
TABLE 210 EGYPT OIL & GAS IN ALPHA-METHYLSTYRENE MARKET, BY APPLICATION, 2018-2032 (USD)
TABLE 211 EGYPT AGRICULTURE IN ALPHA-METHYLSTYRENE MARKET, BY APPLICATION, 2018-2032 (USD)
TABLE 212 EGYPT TEXTILES IN ALPHA-METHYLSTYRENE MARKET, BY APPLICATION, 2018-2032 (USD)
TABLE 213 EGYPT FOOD & BEVERAGES IN ALPHA-METHYLSTYRENE MARKET, BY APPLICATION, 2018-2032 (USD)
TABLE 214 EGYPT OTHERS IN ALPHA-METHYLSTYRENE MARKET, BY APPLICATION, 2018-2032 (USD)
TABLE 215 BAHRAIN ALPHA-METHYLSTYRENE MARKET, BY PURITY, 2018-2032 (USD)
TABLE 216 BAHRAIN ALPHA-METHYLSTYRENE MARKET, BY PURITY, 2018-2032 (TONS)
TABLE 217 BAHRAIN ALPHA-METHYLSTYRENE MARKET, BY GRADE, 2018-2032 (USD)
TABLE 218 BAHRAIN ALPHA-METHYLSTYRENE MARKET, BY PACKAGING QUANTITY, 2018-2032 (USD)
TABLE 219 BAHRAIN ALPHA-METHYLSTYRENE MARKET, BY PACKAGING, 2018-2032 (USD)
TABLE 220 BAHRAIN DRUM IN ALPHA-METHYLSTYRENE MARKET, BY MATERIAL, 2018-2032 (USD)
TABLE 221 BAHRAIN ALPHA-METHYLSTYRENE MARKET, BY APPLICATION, 2018-2032 (USD)
TABLE 222 BAHRAIN POLYMERS IN ALPHA-METHYLSTYRENE MARKET, BY RESIN, 2018-2032 (USD)
TABLE 223 BAHRAIN POLYMERS IN ALPHA-METHYLSTYRENE MARKET, BY PLASTIC, 2018-2032 (USD)
TABLE 224 BAHRAIN BULK AND SPECIALTY CHEMICALS IN ALPHA-METHYLSTYRENE MARKET, BY TYPE, 2018-2032 (USD)
TABLE 225 BAHRAIN ALPHA-METHYLSTYRENE MARKET, BY END-USE, 2018-2032 (USD)
TABLE 226 BAHRAIN AUTOMOTIVE IN ALPHA-METHYLSTYRENE MARKET, BY APPLICATION, 2018-2032 (USD)
TABLE 227 BAHRAIN ELECTRONICS & ELECTRICAL IN ALPHA-METHYLSTYRENE MARKET, BY APPLICATION, 2018-2032 (USD)
TABLE 228 BAHRAIN PHARMACEUTICALS IN ALPHA-METHYLSTYRENE MARKET, BY APPLICATION, 2018-2032 (USD)
TABLE 229 BAHRAIN BUILDING & CONSTRUCTION IN ALPHA-METHYLSTYRENE MARKET, BY APPLICATION, 2018-2032 (USD)
TABLE 230 BAHRAIN OIL & GAS IN ALPHA-METHYLSTYRENE MARKET, BY APPLICATION, 2018-2032 (USD)
TABLE 231 BAHRAIN AGRICULTURE IN ALPHA-METHYLSTYRENE MARKET, BY APPLICATION, 2018-2032 (USD)
TABLE 232 BAHRAIN TEXTILES IN ALPHA-METHYLSTYRENE MARKET, BY APPLICATION, 2018-2032 (USD)
TABLE 233 BAHRAIN FOOD & BEVERAGES IN ALPHA-METHYLSTYRENE MARKET, BY APPLICATION, 2018-2032 (USD)
TABLE 234 BAHRAIN OTHERS IN ALPHA-METHYLSTYRENE MARKET, BY APPLICATION, 2018-2032 (USD)
TABLE 235 QATAR ALPHA-METHYLSTYRENE MARKET, BY PURITY, 2018-2032 (USD)
TABLE 236 QATAR ALPHA-METHYLSTYRENE MARKET, BY PURITY, 2018-2032 (TONS)
TABLE 237 QATAR ALPHA-METHYLSTYRENE MARKET, BY GRADE, 2018-2032 (USD)
TABLE 238 QATAR ALPHA-METHYLSTYRENE MARKET, BY PACKAGING QUANTITY, 2018-2032 (USD)
TABLE 239 QATAR ALPHA-METHYLSTYRENE MARKET, BY PACKAGING, 2018-2032 (USD)
TABLE 240 QATAR DRUM IN ALPHA-METHYLSTYRENE MARKET, BY MATERIAL, 2018-2032 (USD)
TABLE 241 QATAR ALPHA-METHYLSTYRENE MARKET, BY APPLICATION, 2018-2032 (USD)
TABLE 242 QATAR POLYMERS IN ALPHA-METHYLSTYRENE MARKET, BY RESIN, 2018-2032 (USD)
TABLE 243 QATAR POLYMERS IN ALPHA-METHYLSTYRENE MARKET, BY PLASTIC, 2018-2032 (USD)
TABLE 244 QATAR BULK AND SPECIALTY CHEMICALS IN ALPHA-METHYLSTYRENE MARKET, BY TYPE, 2018-2032 (USD)
TABLE 245 QATAR ALPHA-METHYLSTYRENE MARKET, BY END-USE, 2018-2032 (USD)
TABLE 246 QATAR AUTOMOTIVE IN ALPHA-METHYLSTYRENE MARKET, BY APPLICATION, 2018-2032 (USD)
TABLE 247 QATAR ELECTRONICS & ELECTRICAL IN ALPHA-METHYLSTYRENE MARKET, BY APPLICATION, 2018-2032 (USD)
TABLE 248 QATAR PHARMACEUTICALS IN ALPHA-METHYLSTYRENE MARKET, BY APPLICATION, 2018-2032 (USD)
TABLE 249 QATAR BUILDING & CONSTRUCTION IN ALPHA-METHYLSTYRENE MARKET, BY APPLICATION, 2018-2032 (USD)
TABLE 250 QATAR OIL & GAS IN ALPHA-METHYLSTYRENE MARKET, BY APPLICATION, 2018-2032 (USD)
TABLE 251 QATAR AGRICULTURE IN ALPHA-METHYLSTYRENE MARKET, BY APPLICATION, 2018-2032 (USD)
TABLE 252 QATAR TEXTILES IN ALPHA-METHYLSTYRENE MARKET, BY APPLICATION, 2018-2032 (USD)
TABLE 253 QATAR FOOD & BEVERAGES IN ALPHA-METHYLSTYRENE MARKET, BY APPLICATION, 2018-2032 (USD)
TABLE 254 QATAR OTHERS IN ALPHA-METHYLSTYRENE MARKET, BY APPLICATION, 2018-2032 (USD)
TABLE 255 REST OF MIDDLE EAST AND AFRICA ALPHA-METHYLSTYRENE MARKET, BY PURITY, 2018-2032 (USD)
TABLE 256 REST OF MIDDLE EAST AND AFRICA ALPHA-METHYLSTYRENE MARKET, BY PURITY, 2018-2032 (TONS)
List of Figure
FIGURE 1 MIDDLE EAST AND AFRICA ALPHA-METHYLSTYRENE MARKET
FIGURE 2 MIDDLE EAST AND AFRICA ALPHA-METHYLSTYRENE MARKET: DATA TRIANGULATION
FIGURE 3 MIDDLE EAST AND AFRICA ALPHA-METHYLSTYRENE MARKET: DROC ANALYSIS
FIGURE 4 MIDDLE EAST AND AFRICA ALPHA-METHYLSTYRENE MARKET: MIDDLE EAST AND AFRICA VS REGIONAL MARKET ANALYSIS
FIGURE 5 MIDDLE EAST AND AFRICA ALPHA-METHYLSTYRENE MARKET: COMPANY RESEARCH ANALYSIS
FIGURE 6 MIDDLE EAST AND AFRICA ALPHA-METHYLSTYRENE MARKET: MULTIVARIATE MODELLING
FIGURE 7 MIDDLE EAST AND AFRICA ALPHA-METHYLSTYRENE MARKET: INTERVIEW DEMOGRAPHICS
FIGURE 8 MIDDLE EAST AND AFRICA ALPHA-METHYLSTYRENE MARKET: DBMR MARKET POSITION GRID
FIGURE 9 MIDDLE EAST AND AFRICA ALPHA-METHYLSTYRENE MARKET: VENDOR SHARE ANALYSIS
FIGURE 10 MARKET APPLICATION COVERAGE GRID: MIDDLE EAST AND AFRICA ALPHA-METHYLSTYRENE MARKET
FIGURE 11 EXECUTIVE SUMMARY
FIGURE 12 FOUR SEGMENTS COMPRISE THE MIDDLE EAST AND AFRICA ALPHA-METHYLSTYRENE MARKET, BY PURITY (2024)
FIGURE 13 STRATEGIC DECISIONS
FIGURE 14 MIDDLE EAST AND AFRICA ALPHA-METHYLSTYRENE MARKET: SEGMENTATION
FIGURE 15 RISING DEMAND FOR ABS RESINS IN THE AUTOMOTIVE AND CONSUMER GOODS IS EXPECTED TO DRIVE THE MIDDLE EAST AND AFRICA ALPHA-METHYLSTYRENE MARKET IN THE FORECAST PERIOD
FIGURE 16 THE MORE THAN 99% SEGMENT IS EXPECTED TO ACCOUNT FOR THE LARGEST SHARE OF THE MIDDLE EAST AND AFRICA ALPHA-METHYLSTYRENE MARKET IN 2025 AND 2032
FIGURE 17 PESTEL ANALYSIS
FIGURE 18 PORTER’S FIVE FORCES
FIGURE 19 IMPORT EXPORT SCENARIO (USD THOUSAND)
FIGURE 20 PRODUCTION CONSUMPTION ANALYSIS: MIDDLE EAST AND AFRICA ALPHA-METHYLSTYRENE MARKET
FIGURE 21 VENDOR SELECTION CRITERIA
FIGURE 22 DRIVERS, RESTRAINTS, OPPORTUNITIES, AND CHALLENGES FOR MIDDLE EAST AND AFRICA ALPHA-METHYLSTYRENE MARKET
FIGURE 23 MIDDLE EAST AND AFRICA ALPHA-METHYLSTYRENE MARKET: BY PURITY, 2024
FIGURE 24 MIDDLE EAST AND AFRICA ALPHA-METHYLSTYRENE MARKET: BY GRADE, 2024
FIGURE 25 MIDDLE EAST AND AFRICA ALPHA-METHYLSTYRENE MARKET: BY PACKAGING QUANTITY, 2024
FIGURE 26 MIDDLE EAST AND AFRICA ALPHA-METHYLSTYRENE MARKET: BY PACKAGING, 2024
FIGURE 27 MIDDLE EAST AND AFRICA ALPHA-METHYLSTYRENE MARKET: BY APPLICATION, 2024
FIGURE 28 MIDDLE EAST AND AFRICA ALPHA-METHYLSTYRENE MARKET: BY END-USE, 2024
FIGURE 29 MIDDLE EAST AND AFRICA ALPHA-METHYLSTYRENE MARKET: SNAPSHOT (2024)
FIGURE 30 MIDDLE EAST AND AFRICA ALPHA-METHYLSTYRENE MARKET: COMPANY SHARE 2024 (%)
Middle East And Africa Alpha Methylstyrene Market, Supply Chain Analysis and Ecosystem Framework
To support market growth and help clients navigate the impact of geopolitical shifts, DBMR has integrated in-depth supply chain analysis into its Middle East And Africa Alpha Methylstyrene Market research reports. This addition empowers clients to respond effectively to global changes affecting their industries. The supply chain analysis section includes detailed insights such as Middle East And Africa Alpha Methylstyrene Market consumption and production by country, price trend analysis, the impact of tariffs and geopolitical developments, and import and export trends by country and HSN code. It also highlights major suppliers with data on production capacity and company profiles, as well as key importers and exporters. In addition to research, DBMR offers specialized supply chain consulting services backed by over a decade of experience, providing solutions like supplier discovery, supplier risk assessment, price trend analysis, impact evaluation of inflation and trade route changes, and comprehensive market trend analysis.
Data collection and base year analysis are done using data collection modules with large sample sizes. The stage includes obtaining market information or related data through various sources and strategies. It includes examining and planning all the data acquired from the past in advance. It likewise envelops the examination of information inconsistencies seen across different information sources. The market data is analysed and estimated using market statistical and coherent models. Also, market share analysis and key trend analysis are the major success factors in the market report. To know more, please request an analyst call or drop down your inquiry.
The key research methodology used by DBMR research team is data triangulation which involves data mining, analysis of the impact of data variables on the market and primary (industry expert) validation. Data models include Vendor Positioning Grid, Market Time Line Analysis, Market Overview and Guide, Company Positioning Grid, Patent Analysis, Pricing Analysis, Company Market Share Analysis, Standards of Measurement, Global versus Regional and Vendor Share Analysis. To know more about the research methodology, drop in an inquiry to speak to our industry experts.
Data Bridge Market Research is a leader in advanced formative research. We take pride in servicing our existing and new customers with data and analysis that match and suits their goal. The report can be customized to include price trend analysis of target brands understanding the market for additional countries (ask for the list of countries), clinical trial results data, literature review, refurbished market and product base analysis. Market analysis of target competitors can be analyzed from technology-based analysis to market portfolio strategies. We can add as many competitors that you require data about in the format and data style you are looking for. Our team of analysts can also provide you data in crude raw excel files pivot tables (Fact book) or can assist you in creating presentations from the data sets available in the report.


