
Middle East And Africa Alternative Proteins Market
Market Size in USD Million
 USD
1,034.02 Million
USD
2,710.20 Million
2021
2029
USD
1,034.02 Million
USD
2,710.20 Million
2021
2029
| 2022 - 2029 | |
| USD 1,034.02 Million | |
| USD 2,710.20 Million | |
| % | |
|
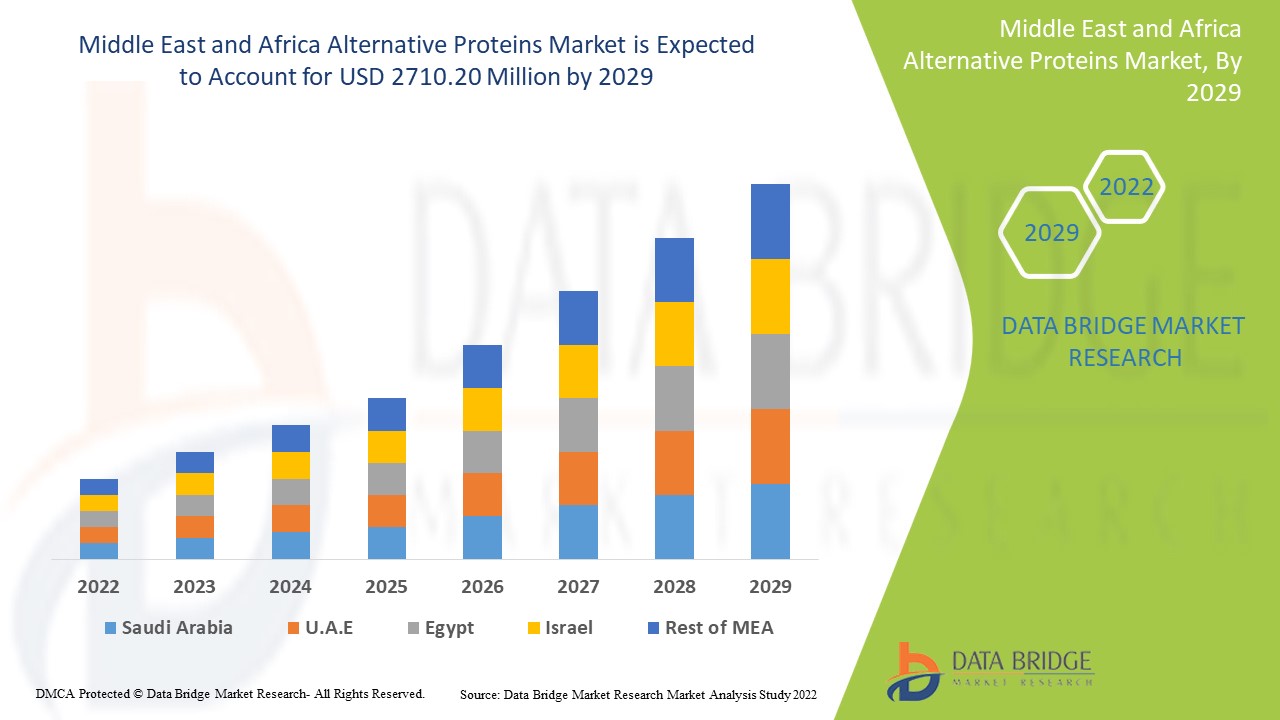
Middle East and Africa Alternative Proteins Market Analysis and Size
Consumers' dietary preferences are changing Middle East and Africa, and there is a low preference for meat and meat-based products among Middle East and Africa consumers. The growing number of flexitarian or vegan consumers has created numerous opportunities for manufacturers to introduce and innovate in the Alternative proteins segment. Health concerns, climate action, and growing awareness of ethical issues in factory farming are all driving demand for alternative proteins. Alternative protein companies are expanding rapidly today. To gain a competitive advantage in the market, new entrants are employing disruptive technologies such as synthetic biology, big data, AI, machine learning, robotics, and the Internet of Things.
Data Bridge Market Research analyses that the alternative proteins market was valued at USD 1034.02 million in 2021 and is expected to reach the value of USD 2710.20 million by 2029, at a CAGR of 12.8% during the forecast period of 2022-2029.
Market Definition
Proteins derived from algae, plants, and insects are referred to as alternative proteins. They provide a significant amount of protein while requiring fewer natural inputs than traditional protein sources such as fish and meat. Protein is primarily responsible for the formation of lean body tissue and the supply of elements required by digestive enzymes.
Middle East and Africa Alternative Proteins Market Size and Segmentation
|
Report Metric |
Details |
|
Forecast Period |
2022 to 2029 |
|
Base Year |
2021 |
|
Historic Years |
2020 (Customizable to 2014 - 2019) |
|
Quantitative Units |
Revenue in USD Million, Volumes in Units, Pricing in USD |
|
Segments Covered |
Category (Organic and Inorganic), Product Type (Alternative Proteins, Insect Protein, Mycoprotein, Cultured Meat and Others), Form (Dry and Liquid), Application (Food and Beverages, Animal Feed, Pharmaceuticals, Personal Care & Cosmetics and Others), |
|
Countries Covered |
South Africa, Saudi Arabia, UAE, Kuwait and Rest of Middle East and Africa |
|
Market Players Covered |
Glanbia plc. (Ireland), Now Health Group, Inc. (U.S.), Nutiva Inc (U.S.), The Simply Good Food Co (U.S.), Iovate Health Sciences International Inc. (Canada), MusclePharm Corporation (U.S.), Kerry Group Plc (Ireland), CytoSport, Inc. (U.S.), The Nature's Bounty Co. (U.S.), Reliance Vitamin Company, Inc. (U.S.), Herbalife Nutrition, Inc. (U.S.), Danone SA (France), GNC Holdings, LLC. (U.S.), Orgain Inc. (U.S.), True Nutrition (U.S.) |
|
Opportunities |
|
Alternative Proteins Market Dynamics
Drivers
- Rising cases of obesity as well as increasing public awareness
Alternative proteins market growth is being aided by a modified high moisture extrusion process and a new compositional research process. Consumers who do not consume dairy products, for example, are turning to plant-based milk options, which have seen significant growth in recent years. This innovative product line or ready-to-eat products with no compromise on texture and taste is also boosting the growth of the alternative proteins market.
- Constant efforts by market players ethical and sustainable alternative to animal-derived products
Civil society groups and new food business players are constantly putting pressure on established meat and dairy companies, making plant-based products an ethical and sustainable alternative to animal-derived products. The growing trend of millennials adopting flexitarian and meat-free diets indicates a significant shift in purchasing habits from previous generations. Companies from the producers to the retailers are already investing in these opportunities. Some companies invest in other companies that produce alternatives to hedge against or prepare for a decline in demand for animal products.
Opportunity
The growing number of fitness centres and increased female participation are expected to fuel the market's growth. Alternative proteins are environmentally friendly. As consumers become more aware of the properties of alternative proteins, they are also adopting environmentally friendly and allergen-free products. Increase growth demand in allergen-free market will create growth opportunities in the forecast period.
Restraints
The availability of low-cost substitutes, negative publicity, and side effects will impede the growth of the alternative proteins supplements market during the forecast period. Vegetarians consume alternative proteins, but allergies in consumers, such as lactose intolerance, will act as a restraint, further challenging the growth of the in the green alternative proteins market in the forecast period.
This alternative proteins market report provides details of new recent developments, trade regulations, import-export analysis, production analysis, value chain optimization, market share, impact of domestic and localized market players, analyses opportunities in terms of emerging revenue pockets, changes in market regulations, strategic market growth analysis, market size, category market growths, application niches and dominance, product approvals, product launches, geographic expansions, technological innovations in the market. To gain more info on the alternative proteins market contact Data Bridge Market Research for an Analyst Brief, our team will help you take an informed market decision to achieve market growth.
COVID-19 Impact on Alternative Proteins Market
The COVID-19 pandemic boosted the alternative protein industry significantly. The pandemic raised public awareness of zoonotic viral infections, the risk of which can also be linked to livestock. Because of the abundance of macronutrients, micronutrients, and antioxidants in alternative protein can help reduce the effects of viral infections. In terms of manufacturing and distribution, this industry has seen unprecedented demand from manufacturers and consumers, particularly for certain products such as meat analogue and plant-based milk. The pandemic of COVID-19 also resulted in some best practise models for the alternative protein industry. Governments announced relaxations of some competition law requirements imposed on alternative Protein, primarily on plant-based protein products and insect protein.
Recent Development
- Protix (Netherlands) raised €50 million in equity for international expansion in February 2022.
- Calysta (U.S.) raised USD 39 million in investment in September 2021 to support the Middle East and Africa scale-up of Calysta's FeedKind protein production.
- Entomo Farms (Canada) raised Canadian Dollar (C$) 3.7 million (USD 2.9 million) in a funding round led by Asian and Canadian investors in January 2021 to support the company's growth and expansion.
- MycoTechnology (U.S.) raised USD 120.69 million in a Series D financing round from investors until June 2020.
- In 2020, Mitsubishi Corporation, Blue Horizon Ventures, Target Middle East and Africa, ArcTern Ventures, and Rubio Impact Ventures will invest USD 75 million in Mosa Meat, a Dutch food technology firm.
- Cricket Lab, a Thailand-based insect protein manufacturer, raised USD 2.1 million in funding in 2020.
Middle East and Africa Alternative Proteins Market Scope
The alternative proteins market is segmented on the basis of category, product type, form and application. The growth amongst these segments will help you analyze meagre growth segments in the industries and provide the users with a valuable market overview and market insights to help them make strategic decisions for identifying core market applications.
Category
- Organic
- Inorganic
Product type
- Alternative Proteins
- Insect Protein
- Mycoprotein
- Cultured Meat
- Others
Form
- Dry
- Liquid
Application
- Food and Beverages
- Animal Feed
- Pharmaceuticals
- Personal Care
- Cosmetics
- Others
Alternative Proteins Market Regional Analysis/Insights
The alternative proteins market is analysed and market size insights and trends are provided by country, category, product type, form and application as referenced above.
The countries covered in the alternative proteins market report are South Africa, Saudi Arabia, UAE, Kuwait and Rest of Middle East and Africa.
South Africa is dominating the awareness and demand for the alternative protein is high in different sector such as food & beverages, feed and various others. People are highly consuming plant based meat and avoiding meat consumption, due to which the market growth is high.
The country section of the report also provides individual market impacting factors and changes in market regulation that impact the current and future trends of the market. Data points like down-stream and upstream value chain analysis, technical trends and porter's five forces analysis, case studies are some of the pointers used to forecast the market scenario for individual countries. Also, the presence and availability of Middle East and Africa brands and their challenges faced due to large or scarce competition from local and domestic brands, impact of domestic tariffs and trade routes are considered while providing forecast analysis of the country data.
Competitive Landscape and Alternative Proteins Market Share Analysis
The alternative proteins market competitive landscape provides details by competitor. Details included are company overview, company financials, revenue generated, market potential, investment in research and development, new market initiatives, Middle East and Africa presence, production sites and facilities, production capacities, company strengths and weaknesses, product launch, product width and breadth, application dominance. The above data points provided are only related to the companies' focus related to alternative proteins market.
Some of the major players operating in the alternative proteins market are:
- Glanbia plc. (Ireland)
- Now Health Group, Inc. (U.S.)
- Nutiva Inc (U.S.)
- The Simply Good Food Co (U.S.)
- Iovate Health Sciences International Inc. (Canada)
- MusclePharm Corporation (U.S.)
- Kerry Group Plc (Ireland)
- CytoSport, Inc. (U.S.)
- The Nature's Bounty Co. (U.S.)
- Reliance Vitamin Company, Inc. (U.S.)
- Herbalife Nutrition, Inc. (U.S.)
- Danone SA (France)
- GNC Holdings, LLC. (U.S.)
- Orgain Inc. (U.S.)
- True Nutrition (U.S.)
SKU-

- Interactive Data Analysis Dashboard
- Company Analysis Dashboard for high growth potential opportunities
- Research Analyst Access for customization & queries
- Competitor Analysis with Interactive dashboard
- Latest News, Updates & Trend analysis
- Harness the Power of Benchmark Analysis for Comprehensive Competitor Tracking
Table of Content
1 INTRODUCTION
1.1 OBJECTIVES OF THE STUDY
1.2 MARKET DEFINITION
1.3 OVERVIEW OF MIDDLE EAST AND AFRICA ALTERNATIVE PROTEINS MARKET
1.4 LIMITATIONS
1.5 MARKETS COVERED
2 MARKET SEGMENTATION
2.1 MARKETS COVERED
2.2 GEOGRAPHICAL SCOPE
2.3 YEARS CONSIDERED FOR THE STUDY
2.4 CURRENCY AND PRICING
2.5 DBMR TRIPOD DATA VALIDATION MODEL
2.6 MULTIVARIATE MODELLING
2.7 CATEGORY LIFELINE CURVE
2.8 PRIMARY INTERVIEWS WITH KEY OPINION LEADERS
2.9 DBMR MARKET POSITION GRID
2.1 VENDOR SHARE ANALYSIS
2.11 MARKET APPLICATION COVERAGE GRID
2.12 SECONDARY SOURCES
2.13 ASSUMPTIONS
3 EXECUTIVE SUMMARY
4 PREMIUM INSIGHTS
5 REGULATORY FRAMEWORK AND GOVERNMENT INITIATIVES: MIDDLE EAST AND AFRICA ALTERNATIVE PROTEIN MARKET
6 MARKET OVERVIEW
6.1 DRIVERS
6.1.1 INCREASING NUMBER OF HEALTH CONSCIOUS CONSUMERS
6.1.2 EASY AVAILABILITY OF EDIBLE INSECTS
6.1.3 RISING AWARENESS ABOUT THE BENEFITS OF ALTERNATIVE PROTEINS
6.1.4 RISE IN POPULATION WITH LACTOSE INTOLERANT CONSUMERS
6.1.5 GROWTH IN INVESTMENTS & COLLABORATIONS IN ALTERNATIVE PROTEIN BUSINESS
6.1.6 INCREASING USAGE OF ALTERNATIVE PROTEINS IN VARIOUS APPLICATIONS
6.2 RESTRAINTS
6.2.1 LACK OF AUTOMATED FARMING METHODS
6.2.2 STRINGENT REGULATIONS ON ALTERNATIVE PROTEINS
6.2.3 HIGHER COSTS OF PROTEINS
6.3 OPPORTUNITIES
6.3.1 LESS ENVIRONMENTAL IMPACTS OF ALTERNATIVE PROTEINS
6.3.2 NEW PRODUCT INNOVATION RELATED TO ALTERNATIVE PROTEINS
6.3.3 RISE IN DEMAND FOR ORGANIC INGREDIENTS
6.3.4 NEW AND EMERGING SOURCES OF PROTEINS
6.4 CHALLENGES
6.4.1 MICROBIAL AND TOXICITY RISKS ASSOCIATED WITH INSECTS
6.4.2 USE OF GMO PRODUCTS
6.4.3 ECONOMIC CONSTRAINTS RELATED TO PROCESSING CAPACITY
7 COVID-19 IMPACT ON ALTERNATIVE PROTEIN MARKET IN FOOD & BEVERAGE INDUSTRY
7.1 INITIATIVES
7.2 CONCLUSION
8 MIDDLE EAST AND AFRICA ALTERNATIVE PROTEINSMARKET, BY CATEGORY
8.1 OVERVIEW
8.2 INORGANIC
8.3 ORGANIC
9 MIDDLE EAST AND AFRICA ALTERNATIVE PROTEINS MARKET, BY PRODUCT TYPE
9.1 OVERVIEW
9.2 PLANT PROTEIN
9.2.1 SOY
9.2.2 WHEAT
9.2.3 PEA
9.2.4 RICE
9.2.5 OAT
9.2.6 POTATO
9.2.7 CANOLA
9.2.8 OTHERS
9.3 INSECT PROTEIN
9.3.1 CRICKETS
9.3.2 BLACK SOLDIER FLIES
9.3.3 MEALWORMS
9.3.4 BEETLES
9.3.5 CATERPILLARS
9.3.6 BEES, WASPS, ANTS
9.3.7 GRASSHOPPERS
9.3.8 OTHERS
9.4 MYCOPROTEIN
9.5 CULTURED MEAT
9.5.1 POULTRY
9.5.2 BEEF
9.5.3 PORK
9.5.4 FISH
9.5.5 OTHERS
9.6 OTHERS
10 MIDDLE EAST AND AFRICA ALTERNATIVE PROTEINS MARKET, BY FORM
10.1 OVERVIEW
10.2 LIQUID
10.3 DRY
11 MIDDLE EAST AND AFRICA ALTERNATIVE PROTEINS MARKET, BY APPLICATION
11.1 OVERVIEW
11.2 FOOD & BEVERAGES
11.2.1 BAKERY & CONFECTIONERY PRODUCTS
11.2.1.1 BREADS
11.2.1.2 CHOCOLATE
11.2.1.3 CANDIES
11.2.1.4 CAKES, MUFFINS & DOUGHNUTS
11.2.1.5 COOKIES, CRACKERS
11.2.1.6 PIE CRUSTS & PIZZA DOUGH
11.2.1.7 CHEWING GUMS
11.2.1.8 OTHERS
11.2.2 BAKERY & CONFECTIONERY PRODUCTS, BY PRODUCT TYPE
11.2.2.1 PLANT PROTEIN
11.2.2.2 INSECT PROTEIN
11.2.2.3 MYCOPROTEIN
11.2.2.4 CULTURED MEAT
11.2.2.5 OTHERS
11.2.3 CONVENIENCE FOOD
11.2.3.1 READY TO EAT MEALS
11.2.3.2 DRESSINGS & CONDIMENTS
11.2.3.3 SOUPS & SAUCES
11.2.3.4 NOODLES & PASTA
11.2.3.5 SNACKS & EXTRUDED SNACKS
11.2.3.6 OTHERS
11.2.4 CONVENIENCE FOOD, BY PRODUCT TYPE
11.2.4.1 PLANT PROTEIN
11.2.4.2 INSECT PROTEIN
11.2.4.3 MYCOPROTEIN
11.2.4.4 OTHERS
11.2.5 DAIRY PRODUCTS
11.2.5.1 DAIRY DESSERTS
11.2.5.1.1 ICE CREAM
11.2.5.1.2 PUDDING
11.2.5.1.3 SORBET
11.2.5.1.4 OTHERS
11.2.5.2 YOGURTS
11.2.5.3 CREAMER
11.2.5.4 CHEESE
11.2.5.5 TOFU
11.2.5.6 OTHERS
11.2.6 DAIRY PRODUCTS, BY PRODUCT TYPE
11.2.6.1 PLANT PROTEIN
11.2.6.2 INSECT PROTEIN
11.2.6.3 MYCOPROTEIN
11.2.6.4 OTHERS
11.2.7 DAIRY ALTERNATIVES
11.2.7.1 MILK
11.2.7.2 YOGURTS
11.2.7.3 CREAMER
11.2.7.4 OTHERS
11.2.8 DAIRY ALTERNATIVES, BY PRODUCT TYPE
11.2.8.1 PLANT PROTEIN
11.2.8.2 INSECT PROTEIN
11.2.8.3 MYCOPROTEIN
11.2.8.4 OTHERS
11.2.9 MEAT & POULTRY PRODUCTS
11.2.9.1 SAUSAGE
11.2.9.2 BURGER PATTY
11.2.9.3 NUGGETS
11.2.9.4 MINCE
11.2.9.5 SALAMI
11.2.9.6 OTHERS
11.2.10 MEAT & POULTRY PRODUCTS, BY PRODUCT TYPE
11.2.10.1 PLANT PROTEIN
11.2.10.2 INSECT PROTEIN
11.2.10.3 MYCOPROTEIN
11.2.10.4 OTHERS
11.2.11 NUTRITIONAL BARS
11.2.11.1 PLANT PROTEIN
11.2.11.2 INSECT PROTEIN
11.2.11.3 MYCOPROTEIN
11.2.11.4 OTHERS
11.2.12 INFANT FORMULA
11.2.12.1 PLANT PROTEIN
11.2.12.2 INSECT PROTEIN
11.2.12.3 MYCOPROTEIN
11.2.12.4 OTHERS
11.2.13 BEVERAGES
11.2.13.1 DAIRY DRINKS
11.2.13.2 FRUIT JUICES
11.2.13.3 NUTRITIONAL DRINKS
11.2.13.4 FRUIT SMOOTHIE
11.2.13.5 SPORTS AND ENERGY DRINKS
11.2.13.6 OTHERS
11.2.14 BEVERAGES, BY PRODUCT TYPE
11.2.14.1 PLANT PROTEIN
11.2.14.2 INSECT PROTEIN
11.2.14.3 MYCOPROTEIN
11.2.14.4 OTHERS
11.3 ANIMAL FEED
11.3.1 RUMINANT
11.3.1.1 DAIRY CATTLE
11.3.1.2 BEEF CATTLE
11.3.1.3 CALVES
11.3.1.4 OTHERS
11.3.2 SWINE
11.3.2.1 SOW
11.3.2.2 GROWER
11.3.2.3 STARTER
11.3.3 POULTRY
11.3.3.1 BROILERS
11.3.3.2 LAYERS
11.3.3.3 BREEDERS
11.3.4 AQUATIC ANIMAL
11.3.4.1 FISH FEED
11.3.4.2 MOLLUSK FEED
11.3.4.3 CRUSTACEANS
11.3.5 PETS
11.3.5.1 DOGS
11.3.5.2 CATS
11.3.5.3 RABBITS
11.3.5.4 OTHERS
11.4 ANIMAL FEED, BY PRODUCT TYPE
11.4.1 PLANT PROTEIN
11.4.2 INSECT PROTEIN
11.4.3 MYCOPROTEIN
11.4.4 OTHERS
11.5 PERSONAL CARE & COSMETICS
11.5.1 SKIN CARE
11.5.2 HAIR CARE
11.5.3 ORAL CARE
11.5.4 OTHERS
11.6 PERSONAL CARE & COSMETICS, BY PRODUCT TYPE
11.6.1 PLANT PROTEIN
11.6.2 INSECT PROTEIN
11.6.3 MYCOPROTEIN
11.6.4 OTHERS
11.7 PHARMACEUTICALS
11.7.1 PLANT PROTEIN
11.7.2 INSECT PROTEIN
11.7.3 MYCOPROTEIN
11.7.4 OTHERS
11.8 OTHERS
12 MIDDLE EAST AND AFRICA ALTERNATIVE PROTEINS MARKET, BY REGION
12.1 MIDDLE EAST & AFRICA
12.1.1 SOUTH AFRICA
12.1.2 SAUDI ARABIA
12.1.3 UAE
12.1.4 KUWAIT
12.1.5 REST OF MIDDLE EAST & AFRICA
13 MIDDLE EAST AND AFRICA ALTERNATIVE PROTEINS MARKET: COMPANY LANDSCAPE
13.1 COMPANY SHARE ANALYSIS: MIDDLE EAST AND AFRICA
14 SWOT ANALYSIS
15 COMPANY PROFILES
15.1 CARGILL, INCORPORATED
15.1.1 COMPANY SNAPSHOT
15.1.2 REVENUE ANALYSIS
15.1.3 COMPANY SHARE ANALYSIS
15.1.4 PRODUCT PORTFOLIO
15.1.5 RECENT DEVELOPMENTS
15.2 DUPONT
15.2.1 COMPANY SNAPSHOT
15.2.2 REVENUE ANALYSIS
15.2.3 COMPANY SHARE ANALYSIS
15.2.4 PRODUCT PORTFOLIO
15.2.5 RECENT DEVELOPMENTS
15.3 BENEO
15.3.1 COMPANY SNAPSHOT
15.3.2 COMPANY SHARE ANALYSIS
15.3.3 PRODUCT PORTFOLIO
15.3.4 RECENT DEVELOPMENT
15.4 ADM
15.4.1 COMPANY SNAPSHOT
15.4.2 REVENUE ANALYSIS
15.4.3 COMPANY SHARE ANALYSIS
15.4.4 PRODUCT PORTFOLIO
15.4.5 RECENT DEVELOPMENTS
15.5 AXIOM FOODS, INC.
15.5.1 COMPANY SNAPSHOT
15.5.2 PRODUCT PORTFOLIO
15.5.3 RECENT DEVELOPMENTS
15.6 CHS INC.
15.6.1 COMPANY SNAPSHOT
15.6.2 REVENUE ANALYSIS
15.6.3 COMPANY SHARE ANALYSIS
15.6.4 PRODUCT PORTFOLIO
15.6.5 RECENT DEVELOPMENT
15.7 ENTERRA FEED CORPORATION
15.7.1 COMPANY SNAPSHOT
15.7.2 PRODUCT PORTFOLIO
15.7.3 RECENT DEVELOPMENTS
15.8 ENTOMOFARMS
15.8.1 COMPANY SNAPSHOT
15.8.2 PRODUCT PORTFOLIO
15.8.3 RECENT DEVELOPMENT
15.9 FARBEST BRANDS
15.9.1 COMPANY SNAPSHOT
15.9.2 PRODUCT PORTFOLIO
15.9.3 RECENT DEVELOPMENT
15.1 GLANBIA PLC
15.10.1 COMPANY SNAPSHOT
15.10.2 REVENUE ANALYSIS
15.10.3 SOLUTION PORTFOLIO
15.10.4 RECENT DEVELOPMENTS
15.11 INGREDION INCORPORATED
15.11.1 COMPANY SNAPSHOT
15.11.2 REVENUE ANALYSIS
15.11.3 PRODUCT PORTFOLIO
15.11.4 RECENT DEVELOPMENTS
15.12 AGRIPROTEIN
15.12.1 COMPANY SNAPSHOT
15.12.2 PRODUCT PORTFOLIO
15.12.3 RECENT DEVELOPMENTS
15.13 KERRY GROUP PLC
15.13.1 COMPANY SNAPSHOT
15.13.2 REVENUE ANALYSIS
15.13.3 PRODUCT PORTFOLIO
15.13.4 RECENT DEVELOPMENTS
15.14 NOW FOODS
15.14.1 COMPANY SNAPSHOT
15.14.2 PRODUCT PORTFOLIO
15.14.3 RECENT DEVELOPMENTS
15.15 PARABEL
15.15.1 COMPANY SNAPSHOT
15.15.2 PRODUCT PORTFOLIO
15.15.3 RECENT DEVELOPMENT
15.16 PROTIFARM
15.16.1 COMPANY SNAPSHOT
15.16.2 PRODUCT PORTFOLIO
15.16.3 RECENT DEVELOPMENT
15.17 PROTIX B.V.
15.17.1 COMPANY SNAPSHOT
15.17.2 PRODUCT PORTFOLIO
15.17.3 RECENT DEVELOPMENT
15.18 ROQUETTE FRÈRES
15.18.1 COMPANY SNAPSHOT
15.18.2 REVENUE ANALYSIS
15.18.3 PRODUCT PORTFOLIO
15.18.4 RECENT DEVELOPMENTS
15.19 TIANJIN NORLAND BIOTECH CO.,LTD
15.19.1 COMPANY SNAPSHOT
15.19.2 PRODUCT PORTFOLIO
15.19.3 RECENT DEVELOPMENTS
15.2 ŸNSECT
15.20.1 COMPANY SNAPSHOT
15.20.2 PRODUCT PORTFOLIO
15.20.3 RECENT DEVELOPMENT
16 QUESTIONNAIRE
17 RELATED REPORTS
List of Table
LIST OF TABLES
TABLE 1 FAT, PROTEIN, AND LACTOSE CONTENT IN MILK OF DIFFERENT MAMMALIAN SPECIES
TABLE 2 LACTOSE INTOLERANCE IN DIFFERENT HUMAN GROUPS
TABLE 3 MIDDLE EAST AND AFRICA ALTERNATIVE PROTEINSMARKET, BY CATEGORY, 2018– 2027 (USD THOUSAND )
TABLE 4 MIDDLE EAST AND AFRICA INORGANIC IN ALTERNATIVE PROTEINS MARKET, BY REGION, 2018-2027 (USD THOUSANDS)
TABLE 5 MIDDLE EAST AND AFRICA ORGANIC IN ALTERNATIVE PROTEINS MARKET, BY REGION, 2018-2027 (USD THOUSANDS)
TABLE 6 MIDDLE EAST AND AFRICA ALTERNATIVE PROTEINS MARKET, BY PRDUCT TYPE, 2018-2027 (USD THOUSAND)
TABLE 7 MIDDLE EAST AND AFRICA ALTERNATIVE PLANT PROTEINS MARKET, BY REGION, 2018-2027 (USD THOUSAND)
TABLE 8 MIDDLE EAST AND AFRICA ALTERNATIVE PLANT PROTEINS MARKET, BY PRDUCT TYPE, 2018-2027 (USD THOUSAND)
TABLE 9 MIDDLE EAST AND AFRICA ALTERNATIVE INSECT PROTEINS MARKET, BY REGION, 2018-2027 (USD THOUSAND)
TABLE 10 MIDDLE EAST AND AFRICA ALTERNATIVE INSECT PROTEINS MARKET, BY PRDUCT TYPE, 2018-2027 (USD THOUSAND)
TABLE 11 MIDDLE EAST AND AFRICA MYCOPROTEIN ALTERNATIVE PROTEINS MARKET, BY REGION, 2018-2027 (USD THOUSAND)
TABLE 12 MIDDLE EAST AND AFRICA CULTURED MEAT ALTERNATIVE PROTEINS MARKET, BY REGION, 2018-2027 (USD THOUSAND)
TABLE 13 MIDDLE EAST AND AFRICA CULTURED MEAT ALTERNATIVE PROTEINS MARKET, BY PRDUCT TYPE, 2018-2027 (USD THOUSAND)
TABLE 14 MIDDLE EAST AND AFRICA OTHERS ALTERNATIVE PROTEINS MARKET, BY REGION, 2018-2027 (USD THOUSAND)
TABLE 15 MIDDLE EAST AND AFRICA ALTERNATIVE PROTEINS MARKET, BY FORM, 2018-2027 (USD THOUSAND)
TABLE 16 MIDDLE EAST AND AFRICA LIQUID IN ALTERNATIVE PROTEINS MARKET, BY REGION, 2018-2027 (USD THOUSAND)
TABLE 17 MIDDLE EAST AND AFRICA DRY IN ALTERNATIVE PROTEINS MARKET, BY REGION, 2018-2027 (USD THOUSANDS)
TABLE 18 MIDDLE EAST AND AFRICA ALTERNATIVE PROTEINS MARKET , BY GRADE, 2018– 2027 (USD THOUSANDS )
TABLE 19 MIDDLE EAST AND AFRICA FOOD & BEVERAGES IN ALTERNATIVE PROTEINS MARKET, BY REGION, 2018-2027 (USD THOUSANDS)
TABLE 20 MIDDLE EAST AND AFRICA FOOD & BEVERAGES IN ALTERNATIVE PROTEINS MARKET, BY APPLICATION, 2018-2027 (USD THOUSANDS)
TABLE 21 MIDDLE EAST AND AFRICA BAKERY & CONFECTIONERY PRODUCTS IN ALTERNATIVE PROTEINS MARKET, BY APPLICATION, 2018-2027 (USD THOUSANDS)
TABLE 22 MIDDLE EAST AND AFRICA BAKERY & CONFECTIONERY PRODUCTS IN ALTERNATIVE PROTEINS MARKET, BY PRODUCT TYPE, 2018-2027 (USD THOUSANDS)
TABLE 23 MIDDLE EAST AND AFRICA CONVENIENCE FOOD IN ALTERNATIVE PROTEINS MARKET, BY APPLICATION, 2018-2027 (USD THOUSANDS)
TABLE 24 MIDDLE EAST AND AFRICA CONVENIENCE FOOD IN ALTERNATIVE PROTEINS MARKET, BY PRODUCT TYPE, 2018-2027 (USD THOUSANDS)
TABLE 25 MIDDLE EAST AND AFRICA DAIRY PRODUCTS IN ALTERNATIVE PROTEINS MARKET, BY APPLICATION, 2018-2027 (USD THOUSANDS)
TABLE 26 MIDDLE EAST AND AFRICA DAIRY DESSERTS IN ALTERNATIVE PROTEINS MARKET, BY APPLICATION, 2018-2027 (USD THOUSANDS)
TABLE 27 MIDDLE EAST AND AFRICA DAIRY PRODUCTS IN ALTERNATIVE PROTEINS MARKET, BY PRODUCT TYPE, 2018-2027 (USD THOUSANDS)
TABLE 28 MIDDLE EAST AND AFRICA DAIRY ALTERNATIVES IN ALTERNATIVE PROTEINS MARKET, BY APPLICATION, 2018-2027 (USD THOUSANDS)
TABLE 29 MIDDLE EAST AND AFRICA DAIRY ALTERNATIVES IN ALTERNATIVE PROTEINS MARKET, BY PRODUCT TYPE, 2018-2027 (USD THOUSANDS)
TABLE 30 MIDDLE EAST AND AFRICA MEAT & POULTRY PRODUCTS IN ALTERNATIVE PROTEINS MARKET, BY APPLICATION, 2018-2027 (USD THOUSANDS)
TABLE 31 MIDDLE EAST AND AFRICA MEAT & POULTRY PRODUCTS IN ALTERNATIVE PROTEINS MARKET, BY PRODUCT TYPE, 2018-2027 (USD THOUSANDS)
TABLE 32 MIDDLE EAST AND AFRICA NUTRITIONAL BARS IN ALTERNATIVE PROTEINS MARKET, BY PRODUCT TYPE, 2018-2027 (USD THOUSANDS)
TABLE 33 MIDDLE EAST AND AFRICA INFANT FORMULA IN ALTERNATIVE PROTEINS MARKET, BY PRODUCT TYPE, 2018-2027 (USD THOUSANDS)
TABLE 34 MIDDLE EAST AND AFRICA BEVERAGES IN ALTERNATIVE PROTEINS MARKET, BY APPLICATION, 2018-2027 (USD THOUSANDS)
TABLE 35 MIDDLE EAST AND AFRICA BEVERAGES IN ALTERNATIVE PROTEINS MARKET, BY PRODUCT TYPE, 2018-2027 (USD THOUSANDS)
TABLE 36 MIDDLE EAST AND AFRICA ANIMAL FEED IN ALTERNATIVE PROTEINS MARKET, BY REGION, 2018-2027 (USD THOUSANDS)
TABLE 37 MIDDLE EAST AND AFRICA ANIMAL FEED IN ALTERNATIVE PROTEINS MARKET, BY ANIMALS, 2018-2027 (USD THOUSANDS)
TABLE 38 MIDDLE EAST AND AFRICA ANIMAL FEED IN ALTERNATIVE PROTEINS MARKET, BY ANIMALS, 2018-2027 (USD THOUSANDS)
TABLE 39 MIDDLE EAST AND AFRICA SWINE IN ALTERNATIVE PROTEINS MARKET, BY TYPE, 2018-2027 (USD THOUSANDS)
TABLE 40 MIDDLE EAST AND AFRICA POULTRY IN ALTERNATIVE PROTEINS MARKET, BY TYPE, 2018-2027 (USD THOUSANDS)
TABLE 41 MIDDLE EAST AND AFRICA AQUATIC ANIMAL IN ALTERNATIVE PROTEINS, BY TYPE, 2018-2027 (USD THOUSANDS)
TABLE 42 MIDDLE EAST AND AFRICA PETS IN ALTERNATIVE PROTEINS MARKET, BY TYPE, 2018-2027 (USD THOUSANDS)
TABLE 43 MIDDLE EAST AND AFRICA ANIMAL FEED IN ALTERNATIVE PROTEINS MARKET, BY PRODUCT TYPE, 2018-2027 (USD THOUSANDS)
TABLE 44 MIDDLE EAST AND AFRICA PERSONAL CARE & COSMETICS IN ALTERNATIVE PROTEINS MARKET, BY REGION, 2018-2027 (USD THOUSANDS)
TABLE 45 MIDDLE EAST AND AFRICA PERSONAL CARE & COSMETICS IN ALTERNATIVE PROTEINS MARKET, BY APPLICATION, 2018-2027 (USD THOUSANDS))
TABLE 46 MIDDLE EAST AND AFRICA PERSONAL CARE & COSMETICS IN ALTERNATIVE PROTEINS MARKET, BY PRODUCT TYPE, 2018-2027 (USD THOUSANDS)
TABLE 47 MIDDLE EAST AND AFRICA PERSONAL CARE & COSMETICS IN ALTERNATIVE PROTEINS MARKET, BY REGION, 2018-2027 (USD THOUSANDS)
TABLE 48 MIDDLE EAST AND AFRICA PHARMACEUTICALS IN ALTERNATIVE PROTEINS MARKET, BY REGION, 2018-2027 (USD THOUSANDS)
TABLE 49 MIDDLE EAST AND AFRICA OTHERS IN ALTERNATIVE PROTEINS MARKET, BY REGION, 2018-2027 (USD THOUSANDS)
TABLE 50 MIDDLE EAST & AFRICA ALTERNATIVE PROTEINS MARKET, BY COUNTRY, 2018-2027 (USD THOUSANDS)
TABLE 51 MIDDLE EAST & AFRICA ALTERNATIVE PROTEINS MARKET, BY CATEGORY, 2018-2027 (USD THOUSANDS)
TABLE 52 MIDDLE EAST & AFRICA ALTERNATIVE PROTEINS MARKET, BY PRODUCT TYPE, 2018-2027 (USD THOUSANDS)
TABLE 53 MIDDLE EAST & AFRICA PLANT PROTEIN IN ALTERNATIVE PROTEINS MARKET, BY TYPE, 2018-2027 (USD THOUSANDS)
TABLE 54 MIDDLE EAST & AFRICA INSECT PROTEIN IN ALTERNATIVE PROTEINS MARKET, BY TYPE, 2018-2027 (USD THOUSANDS)
TABLE 55 MIDDLE EAST & AFRICA CULTURED MEAT IN ALTERNATIVE PROTEINS MARKET, BY TYPE, 2018-2027 (USD THOUSANDS)
TABLE 56 MIDDLE EAST & AFRICA ALTERNATIVE PROTEINS MARKET, BY FORM, 2018-2027 (USD THOUSANDS)
TABLE 57 MIDDLE EAST & AFRICA ALTERNATIVE PROTEINS MARKET, BY APPLICATION, 2018-2027 (USD THOUSANDS)
TABLE 58 MIDDLE EAST & AFRICA FOOD & BEVERAGES IN ALTERNATIVE PROTEINS MARKET, BY APPLICATION, 2018-2027 (USD THOUSANDS)
TABLE 59 MIDDLE EAST & AFRICA BAKERY & CONFECTIONERY PRODUCTS IN ALTERNATIVE PROTEINS MARKET, BY APPLICATION, 2018-2027 (USD THOUSANDS)
TABLE 60 MIDDLE EAST & AFRICA BAKERY & CONFECTIONERY PRODUCTS IN ALTERNATIVE PROTEINS MARKET, BY PRODUCT TYPE, 2018-2027 (USD THOUSANDS)
TABLE 61 MIDDLE EAST & AFRICA CONVENIENCE FOOD IN ALTERNATIVE PROTEINS MARKET, BY APPLICATION, 2018-2027 (USD THOUSANDS)
TABLE 62 MIDDLE EAST & AFRICA CONVENIENCE FOOD IN ALTERNATIVE PROTEINS MARKET, BY PRODUCT TYPE, 2018-2027 (USD THOUSANDS)
TABLE 63 MIDDLE EAST & AFRICA DAIRY PRODUCTS IN ALTERNATIVE PROTEINS MARKET, BY APPLICATION, 2018-2027 (USD THOUSANDS)
TABLE 64 MIDDLE EAST & AFRICA DAIRY DESSERTS IN ALTERNATIVE PROTEINS MARKET, BY APPLICATION, 2018-2027 (USD THOUSANDS)
TABLE 65 MIDDLE EAST & AFRICA DAIRY PRODUCTS IN ALTERNATIVE PROTEINS MARKET, BY PRODUCT TYPE, 2018-2027 (USD THOUSANDS)
TABLE 66 MIDDLE EAST & AFRICA DAIRY ALTERNATIVES IN ALTERNATIVE PROTEINS MARKET, BY APPLICATION, 2018-2027 (USD THOUSANDS)
TABLE 67 MIDDLE EAST & AFRICA DAIRY ALTERNATIVES IN ALTERNATIVE PROTEINS MARKET, BY PRODUCT TYPE, 2018-2027 (USD THOUSANDS)
TABLE 68 MIDDLE EAST & AFRICA MEAT & POULTRY PRODUCTS IN ALTERNATIVE PROTEINS MARKET, BY APPLICATION, 2018-2027 (USD THOUSANDS)
TABLE 69 MIDDLE EAST & AFRICA MEAT & POULTRY PRODUCTS IN ALTERNATIVE PROTEINS MARKET, BY PRODUCT TYPE, 2018-2027 (USD THOUSANDS)
TABLE 70 MIDDLE EAST & AFRICA NUTRITIONAL BARS IN ALTERNATIVE PROTEINS MARKET, BY PRODUCT TYPE, 2018-2027 (USD THOUSANDS)
TABLE 71 MIDDLE EAST & AFRICA INFANT FORMULA IN ALTERNATIVE PROTEINS MARKET, BY PRODUCT TYPE, 2018-2027 (USD THOUSANDS)
TABLE 72 MIDDLE EAST & AFRICA BEVERAGES IN ALTERNATIVE PROTEINS MARKET, BY APPLICATION, 2018-2027 (USD THOUSANDS)
TABLE 73 MIDDLE EAST & AFRICA BEVERAGES IN ALTERNATIVE PROTEINS MARKET, BY PRODUCT TYPE, 2018-2027 (USD THOUSANDS)
TABLE 74 MIDDLE EAST & AFRICA ANIMAL FEED IN ALTERNATIVE PROTEINS MARKET, BY ANIMALS, 2018-2027 (USD THOUSANDS)
TABLE 75 MIDDLE EAST & AFRICA RUMINANTS IN ALTERNATIVE PROTEINS MARKET, BY TYPE, 2018-2027 (USD THOUSANDS)
TABLE 76 MIDDLE EAST & AFRICA SWINE IN ALTERNATIVE PROTEINS MARKET, BY TYPE, 2018-2027 (USD THOUSANDS)
TABLE 77 MIDDLE EAST & AFRICA POULTRY IN ALTERNATIVE PROTEINS MARKET, BY TYPE, 2018-2027 (USD THOUSANDS)
TABLE 78 MIDDLE EAST & AFRICA AQUATIC ANIMAL IN ALTERNATIVE PROTEINS MARKET, BY TYPE, 2018-2027 (USD THOUSANDS)
TABLE 79 MIDDLE EAST & AFRICA PETS IN ALTERNATIVE PROTEINS MARKET, BY TYPE, 2018-2027 (USD THOUSANDS)
TABLE 80 MIDDLE EAST & AFRICA ANIMAL FEED IN ALTERNATIVE PROTEINS MARKET, BY PRODUCT TYPE, 2018-2027 (USD THOUSANDS)
TABLE 81 MIDDLE EAST & AFRICA PERSONAL CARE & COSMETICS IN ALTERNATIVE PROTEINS MARKET, BY TYPE, 2018-2027 (USD THOUSANDS)
TABLE 82 MIDDLE EAST & AFRICA PERSONAL CARE & COSMETICS IN ALTERNATIVE PROTEINS MARKET, BY PRODUCT TYPE, 2018-2027 (USD THOUSANDS)
TABLE 83 MIDDLE EAST & AFRICA PHARMACEUTICALS IN ALTERNATIVE PROTEINS MARKET, BY PRODUCT TYPE, 2018-2027 (USD THOUSANDS)
TABLE 84 SOUTH AFRICA ALTERNATIVE PROTEINS MARKET, BY CATEGORY, 2018-2027 (USD THOUSANDS)
TABLE 85 SOUTH AFRICA ALTERNATIVE PROTEINS MARKET, BY PRODUCT TYPE, 2018-2027 (USD THOUSANDS)
TABLE 86 SOUTH AFRICA PLANT PROTEIN IN ALTERNATIVE PROTEINS MARKET, BY TYPE, 2018-2027 (USD THOUSANDS)
TABLE 87 SOUTH AFRICA INSECT PROTEIN IN ALTERNATIVE PROTEINS MARKET, BY TYPE, 2018-2027 (USD THOUSANDS)
TABLE 88 SOUTH AFRICA CULTURED MEAT IN ALTERNATIVE PROTEINS MARKET, BY TYPE, 2018-2027 (USD THOUSANDS)
TABLE 89 SOUTH AFRICA ALTERNATIVE PROTEINS MARKET, BY FORM, 2018-2027 (USD THOUSANDS)
TABLE 90 SOUTH AFRICA ALTERNATIVE PROTEINS MARKET, BY APPLICATION, 2018-2027 (USD THOUSANDS)
TABLE 91 SOUTH AFRICA FOOD & BEVERAGES IN ALTERNATIVE PROTEINS MARKET, BY APPLICATION, 2018-2027 (USD THOUSANDS)
TABLE 92 SOUTH AFRICA BAKERY & CONFECTIONERY PRODUCTS IN ALTERNATIVE PROTEINS MARKET, BY APPLICATION, 2018-2027 (USD THOUSANDS)
TABLE 93 SOUTH AFRICA BAKERY & CONFECTIONERY PRODUCTS IN ALTERNATIVE PROTEINS MARKET, BY PRODUCT TYPE, 2018-2027 (USD THOUSANDS)
TABLE 94 SOUTH AFRICA CONVENIENCE FOOD IN ALTERNATIVE PROTEINS MARKET, BY APPLICATION, 2018-2027 (USD THOUSANDS)
TABLE 95 SOUTH AFRICA CONVENIENCE FOOD IN ALTERNATIVE PROTEINS MARKET, BY PRODUCT TYPE, 2018-2027 (USD THOUSANDS)
TABLE 96 SOUTH AFRICA DAIRY PRODUCTS IN ALTERNATIVE PROTEINS MARKET, BY APPLICATION, 2018-2027 (USD THOUSANDS)
TABLE 97 SOUTH AFRICA DAIRY DESSERTS IN ALTERNATIVE PROTEINS MARKET, BY APPLICATION, 2018-2027 (USD THOUSANDS)
TABLE 98 SOUTH AFRICA DAIRY PRODUCTS IN ALTERNATIVE PROTEINS MARKET, BY PRODUCT TYPE, 2018-2027 (USD THOUSANDS)
TABLE 99 SOUTH AFRICA DAIRY ALTERNATIVES IN ALTERNATIVE PROTEINS MARKET, BY APPLICATION, 2018-2027 (USD THOUSANDS)
TABLE 100 SOUTH AFRICA DAIRY ALTERNATIVES IN ALTERNATIVE PROTEINS MARKET, BY PRODUCT TYPE, 2018-2027 (USD THOUSANDS)
TABLE 101 SOUTH AFRICA MEAT & POULTRY PRODUCTS IN ALTERNATIVE PROTEINS MARKET, BY APPLICATION, 2018-2027 (USD THOUSANDS)
TABLE 102 SOUTH AFRICA MEAT & POULTRY PRODUCTS IN ALTERNATIVE PROTEINS MARKET, BY PRODUCT TYPE, 2018-2027 (USD THOUSANDS)
TABLE 103 SOUTH AFRICA NUTRITIONAL BARS IN ALTERNATIVE PROTEINS MARKET, BY PRODUCT TYPE, 2018-2027 (USD THOUSANDS)
TABLE 104 SOUTH AFRICA INFANT FORMULA IN ALTERNATIVE PROTEINS MARKET, BY PRODUCT TYPE, 2018-2027 (USD THOUSANDS)
TABLE 105 SOUTH AFRICA BEVERAGES IN ALTERNATIVE PROTEINS MARKET, BY APPLICATION, 2018-2027 (USD THOUSANDS)
TABLE 106 SOUTH AFRICA BEVERAGES IN ALTERNATIVE PROTEINS MARKET, BY PRODUCT TYPE, 2018-2027 (USD THOUSANDS)
TABLE 107 SOUTH AFRICA ANIMAL FEED IN ALTERNATIVE PROTEINS MARKET, BY ANIMALS, 2018-2027 (USD THOUSANDS)
TABLE 108 SOUTH AFRICA RUMINANTS IN ALTERNATIVE PROTEINS MARKET, BY TYPE, 2018-2027 (USD THOUSANDS)
TABLE 109 SOUTH AFRICA SWINE IN ALTERNATIVE PROTEINS MARKET, BY TYPE, 2018-2027 (USD THOUSANDS)
TABLE 110 SOUTH AFRICA POULTRY IN ALTERNATIVE PROTEINS MARKET, BY TYPE, 2018-2027 (USD THOUSANDS)
TABLE 111 SOUTH AFRICA AQUATIC ANIMAL IN ALTERNATIVE PROTEINS MARKET, BY TYPE, 2018-2027 (USD THOUSANDS)
TABLE 112 SOUTH AFRICA PETS IN ALTERNATIVE PROTEINS MARKET, BY TYPE, 2018-2027 (USD THOUSANDS)
TABLE 113 SOUTH AFRICA ANIMAL FEED IN ALTERNATIVE PROTEINS MARKET, BY PRODUCT TYPE, 2018-2027 (USD THOUSANDS)
TABLE 114 SOUTH AFRICA PERSONAL CARE & COSMETICS IN ALTERNATIVE PROTEINS MARKET, BY TYPE, 2018-2027 (USD THOUSANDS)
TABLE 115 SOUTH AFRICA PERSONAL CARE & COSMETICS IN ALTERNATIVE PROTEINS MARKET, BY PRODUCT TYPE, 2018-2027 (USD THOUSANDS)
TABLE 116 SOUTH AFRICA PHARMACEUTICALS IN ALTERNATIVE PROTEINS MARKET, BY PRODUCT TYPE, 2018-2027 (USD THOUSANDS)
TABLE 117 SAUDI ARABIA ALTERNATIVE PROTEINS MARKET, BY CATEGORY, 2018-2027 (USD THOUSANDS)
TABLE 118 SAUDI ARABIA ALTERNATIVE PROTEINS MARKET, BY PRODUCT TYPE, 2018-2027 (USD THOUSANDS)
TABLE 119 SAUDI ARABIA PLANT PROTEIN IN ALTERNATIVE PROTEINS MARKET, BY TYPE, 2018-2027 (USD THOUSANDS)
TABLE 120 SAUDI ARABIA INSECT PROTEIN IN ALTERNATIVE PROTEINS MARKET, BY TYPE, 2018-2027 (USD THOUSANDS)
TABLE 121 SAUDI ARABIA CULTURED MEAT IN ALTERNATIVE PROTEINS MARKET, BY TYPE, 2018-2027 (USD THOUSANDS)
TABLE 122 SAUDI ARABIA ALTERNATIVE PROTEINS MARKET, BY FORM, 2018-2027 (USD THOUSANDS)
TABLE 123 SAUDI ARABIA ALTERNATIVE PROTEINS MARKET, BY APPLICATION, 2018-2027 (USD THOUSANDS)
TABLE 124 SAUDI ARABIA FOOD & BEVERAGES IN ALTERNATIVE PROTEINS MARKET, BY APPLICATION, 2018-2027 (USD THOUSANDS)
TABLE 125 SAUDI ARABIA BAKERY & CONFECTIONERY PRODUCTS IN ALTERNATIVE PROTEINS MARKET, BY APPLICATION, 2018-2027 (USD THOUSANDS)
TABLE 126 SAUDI ARABIA BAKERY & CONFECTIONERY PRODUCTS IN ALTERNATIVE PROTEINS MARKET, BY PRODUCT TYPE, 2018-2027 (USD THOUSANDS)
TABLE 127 SAUDI ARABIA CONVENIENCE FOOD IN ALTERNATIVE PROTEINS MARKET, BY APPLICATION, 2018-2027 (USD THOUSANDS)
TABLE 128 SAUDI ARABIA CONVENIENCE FOOD IN ALTERNATIVE PROTEINS MARKET, BY PRODUCT TYPE, 2018-2027 (USD THOUSANDS)
TABLE 129 SAUDI ARABIA DAIRY PRODUCTS IN ALTERNATIVE PROTEINS MARKET, BY APPLICATION, 2018-2027 (USD THOUSANDS)
TABLE 130 SAUDI ARABIA DAIRY DESSERTS IN ALTERNATIVE PROTEINS MARKET, BY APPLICATION, 2018-2027 (USD THOUSANDS)
TABLE 131 SAUDI ARABIA DAIRY PRODUCTS IN ALTERNATIVE PROTEINS MARKET, BY PRODUCT TYPE, 2018-2027 (USD THOUSANDS)
TABLE 132 SAUDI ARABIA DAIRY ALTERNATIVES IN ALTERNATIVE PROTEINS MARKET, BY APPLICATION, 2018-2027 (USD THOUSANDS)
TABLE 133 SAUDI ARABIA DAIRY ALTERNATIVES IN ALTERNATIVE PROTEINS MARKET, BY PRODUCT TYPE, 2018-2027 (USD THOUSANDS)
TABLE 134 SAUDI ARABIA MEAT & POULTRY PRODUCTS IN ALTERNATIVE PROTEINS MARKET, BY APPLICATION, 2018-2027 (USD THOUSANDS)
TABLE 135 SAUDI ARABIA MEAT & POULTRY PRODUCTS IN ALTERNATIVE PROTEINS MARKET, BY PRODUCT TYPE, 2018-2027 (USD THOUSANDS)
TABLE 136 SAUDI ARABIA NUTRITIONAL BARS IN ALTERNATIVE PROTEINS MARKET, BY PRODUCT TYPE, 2018-2027 (USD THOUSANDS)
TABLE 137 SAUDI ARABIA INFANT FORMULA IN ALTERNATIVE PROTEINS MARKET, BY PRODUCT TYPE, 2018-2027 (USD THOUSANDS)
TABLE 138 SAUDI ARABIA BEVERAGES IN ALTERNATIVE PROTEINS MARKET, BY APPLICATION, 2018-2027 (USD THOUSANDS)
TABLE 139 SAUDI ARABIA BEVERAGES IN ALTERNATIVE PROTEINS MARKET, BY PRODUCT TYPE, 2018-2027 (USD THOUSANDS)
TABLE 140 SAUDI ARABIA ANIMAL FEED IN ALTERNATIVE PROTEINS MARKET, BY ANIMALS, 2018-2027 (USD THOUSANDS)
TABLE 141 SAUDI ARABIA RUMINANTS IN ALTERNATIVE PROTEINS MARKET, BY TYPE, 2018-2027 (USD THOUSANDS)
TABLE 142 SAUDI ARABIA SWINE IN ALTERNATIVE PROTEINS MARKET, BY TYPE, 2018-2027 (USD THOUSANDS)
TABLE 143 SAUDI ARABIA POULTRY IN ALTERNATIVE PROTEINS MARKET, BY TYPE, 2018-2027 (USD THOUSANDS)
TABLE 144 SAUDI ARABIA AQUATIC ANIMAL IN ALTERNATIVE PROTEINS MARKET, BY TYPE, 2018-2027 (USD THOUSANDS)
TABLE 145 SAUDI ARABIA PETS IN ALTERNATIVE PROTEINS MARKET, BY TYPE, 2018-2027 (USD THOUSANDS)
TABLE 146 SAUDI ARABIA ANIMAL FEED IN ALTERNATIVE PROTEINS MARKET, BY PRODUCT TYPE, 2018-2027 (USD THOUSANDS)
TABLE 147 SAUDI ARABIA PERSONAL CARE & COSMETICS IN ALTERNATIVE PROTEINS MARKET, BY TYPE, 2018-2027 (USD THOUSANDS)
TABLE 148 SAUDI ARABIA PERSONAL CARE & COSMETICS IN ALTERNATIVE PROTEINS MARKET, BY PRODUCT TYPE, 2018-2027 (USD THOUSANDS)
TABLE 149 SAUDI ARABIA PHARMACEUTICALS IN ALTERNATIVE PROTEINS MARKET, BY PRODUCT TYPE, 2018-2027 (USD THOUSANDS)
TABLE 150 UAE ALTERNATIVE PROTEINS MARKET, BY CATEGORY, 2018-2027 (USD THOUSANDS)
TABLE 151 UAE ALTERNATIVE PROTEINS MARKET, BY PRODUCT TYPE, 2018-2027 (USD THOUSANDS)
TABLE 152 UAE PLANT PROTEIN IN ALTERNATIVE PROTEINS MARKET, BY TYPE, 2018-2027 (USD THOUSANDS)
TABLE 153 UAE INSECT PROTEIN IN ALTERNATIVE PROTEINS MARKET, BY TYPE, 2018-2027 (USD THOUSANDS)
TABLE 154 UAE CULTURED MEAT IN ALTERNATIVE PROTEINS MARKET, BY TYPE, 2018-2027 (USD THOUSANDS)
TABLE 155 UAE ALTERNATIVE PROTEINS MARKET, BY FORM, 2018-2027 (USD THOUSANDS)
TABLE 156 UAE ALTERNATIVE PROTEINS MARKET, BY APPLICATION, 2018-2027 (USD THOUSANDS)
TABLE 157 UAE FOOD & BEVERAGES IN ALTERNATIVE PROTEINS MARKET, BY APPLICATION, 2018-2027 (USD THOUSANDS)
TABLE 158 UAE BAKERY & CONFECTIONERY PRODUCTS IN ALTERNATIVE PROTEINS MARKET, BY APPLICATION, 2018-2027 (USD THOUSANDS)
TABLE 159 UAE BAKERY & CONFECTIONERY PRODUCTS IN ALTERNATIVE PROTEINS MARKET, BY PRODUCT TYPE, 2018-2027 (USD THOUSANDS)
TABLE 160 UAE CONVENIENCE FOOD IN ALTERNATIVE PROTEINS MARKET, BY APPLICATION, 2018-2027 (USD THOUSANDS)
TABLE 161 UAE CONVENIENCE FOOD IN ALTERNATIVE PROTEINS MARKET, BY PRODUCT TYPE, 2018-2027 (USD THOUSANDS)
TABLE 162 UAE DAIRY PRODUCTS IN ALTERNATIVE PROTEINS MARKET, BY APPLICATION, 2018-2027 (USD THOUSANDS)
TABLE 163 UAE DAIRY DESSERTS IN ALTERNATIVE PROTEINS MARKET, BY APPLICATION, 2018-2027 (USD THOUSANDS)
TABLE 164 UAE DAIRY PRODUCTS IN ALTERNATIVE PROTEINS MARKET, BY PRODUCT TYPE, 2018-2027 (USD THOUSANDS)
TABLE 165 UAE DAIRY ALTERNATIVES IN ALTERNATIVE PROTEINS MARKET, BY APPLICATION, 2018-2027 (USD THOUSANDS)
TABLE 166 UAE DAIRY ALTERNATIVES IN ALTERNATIVE PROTEINS MARKET, BY PRODUCT TYPE, 2018-2027 (USD THOUSANDS)
TABLE 167 UAE MEAT & POULTRY PRODUCTS IN ALTERNATIVE PROTEINS MARKET, BY APPLICATION, 2018-2027 (USD THOUSANDS)
TABLE 168 UAE MEAT & POULTRY PRODUCTS IN ALTERNATIVE PROTEINS MARKET, BY PRODUCT TYPE, 2018-2027 (USD THOUSANDS)
TABLE 169 UAE NUTRITIONAL BARS IN ALTERNATIVE PROTEINS MARKET, BY PRODUCT TYPE, 2018-2027 (USD THOUSANDS)
TABLE 170 UAE INFANT FORMULA IN ALTERNATIVE PROTEINS MARKET, BY PRODUCT TYPE, 2018-2027 (USD THOUSANDS)
TABLE 171 UAE BEVERAGES IN ALTERNATIVE PROTEINS MARKET, BY APPLICATION, 2018-2027 (USD THOUSANDS)
TABLE 172 UAE BEVERAGES IN ALTERNATIVE PROTEINS MARKET, BY PRODUCT TYPE, 2018-2027 (USD THOUSANDS)
TABLE 173 UAE ANIMAL FEED IN ALTERNATIVE PROTEINS MARKET, BY ANIMALS, 2018-2027 (USD THOUSANDS)
TABLE 174 UAE RUMINANTS IN ALTERNATIVE PROTEINS MARKET, BY TYPE, 2018-2027 (USD THOUSANDS)
TABLE 175 UAE SWINE IN ALTERNATIVE PROTEINS MARKET, BY TYPE, 2018-2027 (USD THOUSANDS)
TABLE 176 UAE POULTRY IN ALTERNATIVE PROTEINS MARKET, BY TYPE, 2018-2027 (USD THOUSANDS)
TABLE 177 UAE AQUATIC ANIMAL IN ALTERNATIVE PROTEINS MARKET, BY TYPE, 2018-2027 (USD THOUSANDS)
TABLE 178 UAE PETS IN ALTERNATIVE PROTEINS MARKET, BY TYPE, 2018-2027 (USD THOUSANDS)
TABLE 179 UAE ANIMAL FEED IN ALTERNATIVE PROTEINS MARKET, BY PRODUCT TYPE, 2018-2027 (USD THOUSANDS)
TABLE 180 UAE PERSONAL CARE & COSMETICS IN ALTERNATIVE PROTEINS MARKET, BY TYPE, 2018-2027 (USD THOUSANDS)
TABLE 181 UAE PERSONAL CARE & COSMETICS IN ALTERNATIVE PROTEINS MARKET, BY PRODUCT TYPE, 2018-2027 (USD THOUSANDS)
TABLE 182 UAE PHARMACEUTICALS IN ALTERNATIVE PROTEINS MARKET, BY PRODUCT TYPE, 2018-2027 (USD THOUSANDS)
TABLE 183 KUWAIT ALTERNATIVE PROTEINS MARKET, BY CATEGORY, 2018-2027 (USD THOUSANDS)
TABLE 184 KUWAIT ALTERNATIVE PROTEINS MARKET, BY PRODUCT TYPE, 2018-2027 (USD THOUSANDS)
TABLE 185 KUWAIT PLANT PROTEIN IN ALTERNATIVE PROTEINS MARKET, BY TYPE, 2018-2027 (USD THOUSANDS)
TABLE 186 KUWAIT INSECT PROTEIN IN ALTERNATIVE PROTEINS MARKET, BY TYPE, 2018-2027 (USD THOUSANDS)
TABLE 187 KUWAIT CULTURED MEAT IN ALTERNATIVE PROTEINS MARKET, BY TYPE, 2018-2027 (USD THOUSANDS)
TABLE 188 KUWAIT ALTERNATIVE PROTEINS MARKET, BY FORM, 2018-2027 (USD THOUSANDS)
TABLE 189 KUWAIT ALTERNATIVE PROTEINS MARKET, BY APPLICATION, 2018-2027 (USD THOUSANDS)
TABLE 190 KUWAIT FOOD & BEVERAGES IN ALTERNATIVE PROTEINS MARKET, BY APPLICATION, 2018-2027 (USD THOUSANDS)
TABLE 191 KUWAIT BAKERY & CONFECTIONERY PRODUCTS IN ALTERNATIVE PROTEINS MARKET, BY APPLICATION, 2018-2027 (USD THOUSANDS)
TABLE 192 KUWAIT BAKERY & CONFECTIONERY PRODUCTS IN ALTERNATIVE PROTEINS MARKET, BY PRODUCT TYPE, 2018-2027 (USD THOUSANDS)
TABLE 193 KUWAIT CONVENIENCE FOOD IN ALTERNATIVE PROTEINS MARKET, BY APPLICATION, 2018-2027 (USD THOUSANDS)
TABLE 194 KUWAIT CONVENIENCE FOOD IN ALTERNATIVE PROTEINS MARKET, BY PRODUCT TYPE, 2018-2027 (USD THOUSANDS)
TABLE 195 KUWAIT DAIRY PRODUCTS IN ALTERNATIVE PROTEINS MARKET, BY APPLICATION, 2018-2027 (USD THOUSANDS)
TABLE 196 KUWAIT DAIRY DESSERTS IN ALTERNATIVE PROTEINS MARKET, BY APPLICATION, 2018-2027 (USD THOUSANDS)
TABLE 197 KUWAIT DAIRY PRODUCTS IN ALTERNATIVE PROTEINS MARKET, BY PRODUCT TYPE, 2018-2027 (USD THOUSANDS)
TABLE 198 KUWAIT DAIRY ALTERNATIVES IN ALTERNATIVE PROTEINS MARKET, BY APPLICATION, 2018-2027 (USD THOUSANDS)
TABLE 199 KUWAIT DAIRY ALTERNATIVES IN ALTERNATIVE PROTEINS MARKET, BY PRODUCT TYPE, 2018-2027 (USD THOUSANDS)
TABLE 200 KUWAIT MEAT & POULTRY PRODUCTS IN ALTERNATIVE PROTEINS MARKET, BY APPLICATION, 2018-2027 (USD THOUSANDS)
TABLE 201 KUWAIT MEAT & POULTRY PRODUCTS IN ALTERNATIVE PROTEINS MARKET, BY PRODUCT TYPE, 2018-2027 (USD THOUSANDS)
TABLE 202 KUWAIT NUTRITIONAL BARS IN ALTERNATIVE PROTEINS MARKET, BY PRODUCT TYPE, 2018-2027 (USD THOUSANDS)
TABLE 203 KUWAIT INFANT FORMULA IN ALTERNATIVE PROTEINS MARKET, BY PRODUCT TYPE, 2018-2027 (USD THOUSANDS)
TABLE 204 KUWAIT BEVERAGES IN ALTERNATIVE PROTEINS MARKET, BY APPLICATION, 2018-2027 (USD THOUSANDS)
TABLE 205 KUWAIT BEVERAGES IN ALTERNATIVE PROTEINS MARKET, BY PRODUCT TYPE, 2018-2027 (USD THOUSANDS)
TABLE 206 KUWAIT ANIMAL FEED IN ALTERNATIVE PROTEINS MARKET, BY ANIMALS, 2018-2027 (USD THOUSANDS)
TABLE 207 KUWAIT RUMINANTS IN ALTERNATIVE PROTEINS MARKET, BY TYPE, 2018-2027 (USD THOUSANDS)
TABLE 208 KUWAIT SWINE IN ALTERNATIVE PROTEINS MARKET, BY TYPE, 2018-2027 (USD THOUSANDS)
TABLE 209 KUWAIT POULTRY IN ALTERNATIVE PROTEINS MARKET, BY TYPE, 2018-2027 (USD THOUSANDS)
TABLE 210 KUWAIT AQUATIC ANIMAL IN ALTERNATIVE PROTEINS MARKET, BY TYPE, 2018-2027 (USD THOUSANDS)
TABLE 211 KUWAIT PETS IN ALTERNATIVE PROTEINS MARKET, BY TYPE, 2018-2027 (USD THOUSANDS)
TABLE 212 KUWAIT ANIMAL FEED IN ALTERNATIVE PROTEINS MARKET, BY PRODUCT TYPE, 2018-2027 (USD THOUSANDS)
TABLE 213 KUWAIT PERSONAL CARE & COSMETICS IN ALTERNATIVE PROTEINS MARKET, BY TYPE, 2018-2027 (USD THOUSANDS)
TABLE 214 KUWAIT PERSONAL CARE & COSMETICS IN ALTERNATIVE PROTEINS MARKET, BY PRODUCT TYPE, 2018-2027 (USD THOUSANDS)
TABLE 215 KUWAIT PHARMACEUTICALS IN ALTERNATIVE PROTEINS MARKET, BY PRODUCT TYPE, 2018-2027 (USD THOUSANDS)
TABLE 216 REST OF MIDDLE EAST & AFRICA ALTERNATIVE PROTEINS MARKET, BY CATEGORY, 2018-2027 (USD THOUSANDS)
List of Figure
LIST OF FIGURES
FIGURE 1 MIDDLE EAST AND AFRICA ALTERNATIVE PROTEINS MARKET : SEGMENTATION
FIGURE 2 MIDDLE EAST AND AFRICA ALTERNATIVE PROTEINS MARKET : DATA TRIANGULATION
FIGURE 3 MIDDLE EAST AND AFRICA ALTERNATIVE PROTEINS MARKET : DROC ANALYSIS
FIGURE 4 MIDDLE EAST AND AFRICA ALTERNATIVE PROTEINS MARKET : MIDDLE EAST AND AFRICA VS REGIONAL MARKET ANALYSIS
FIGURE 5 MIDDLE EAST AND AFRICA ALTERNATIVE PROTEINS MARKET : COMPANY RESEARCH ANALYSIS
FIGURE 6 MIDDLE EAST AND AFRICA ALTERNATIVE PROTEINS MARKET : INTERVIEW DEMOGRAPHICS
FIGURE 7 MIDDLE EAST AND AFRICA ALTERNATIVE PROTEINS MARKET : DBMR MARKET POSITION GRID
FIGURE 8 MIDDLE EAST AND AFRICA ALTERNATIVE PROTEINS MARKET : VENDOR SHARE ANALYSIS
FIGURE 9 MIDDLE EAST AND AFRICA ALTERNATIVE PROTEINS MARKET: MARKET APPLICATION COVERAGE GRID
FIGURE 10 MIDDLE EAST AND AFRICA ALTERNATIVE PROTEINS MARKET : SEGMENTATION
FIGURE 11 INCREASING NUMBER OF HEALTH CONSCIOUS CONSUMERS AND EASY AVAILABILITY OF EDIBLE INSECTS ARE LEADING THE GROWTH OF THE MIDDLE EAST AND AFRICA ALTERNATIVE PROTEINS MARKET IN THE FORECAST PERIOD OF 2020 TO 2027
FIGURE 12 INORGANIC SEGMENT IS EXPECTED TO ACCOUNT FOR THE LARGEST SHARE OF THE MIDDLE EAST AND AFRICA ALTERNATIVE PROTEINS MARKET IN 2020 & 2027
FIGURE 13 DRIVERS, RESTRAINTS, OPPORTUNITIES AND CHALLENGES OF MIDDLE EAST AND AFRICA ALTERNATIVE PROTEINS MARKET
FIGURE 14 MIDDLE EAST AND AFRICA ALTERNATIVE PROTEINS MARKET, BY CATEGORY, 2019
FIGURE 15 MIDDLE EAST AND AFRICA ALTERNATIVE PROTEINS MARKET, BY PRODUCT TYPE
FIGURE 16 MIDDLE EAST AND AFRICA ALTERNATIVE PROTEINS MARKET, BY FORM
FIGURE 17 FIGURE 1 MIDDLE EAST AND AFRICA ALTERNATIVE PROTEINS MARKET , BY APPLICATIONS, 2019
FIGURE 18 MIDDLE EAST & AFRICA ALTERNATIVE PROTEINS MARKET: SNAPSHOT (2019)
FIGURE 19 MIDDLE EAST & AFRICA ALTERNATIVE PROTEINS MARKET: BY COUNTRY (2019)
FIGURE 20 MIDDLE EAST & AFRICA ALTERNATIVE PROTEINS MARKET: BY COUNTRY (2020 & 2027)
FIGURE 21 MIDDLE EAST & AFRICA ALTERNATIVE PROTEINS MARKET: BY COUNTRY (2019 & 2027)
FIGURE 22 MIDDLE EAST & AFRICA ALTERNATIVE PROTEINS MARKET: BY TYPE (2020-2027)
FIGURE 23 MIDDLE EAST AND AFRICA ALTERNATIVE PROTEINS MARKET: COMPANY SHARE 2019 (%)
Middle East And Africa Alternative Proteins Market, Supply Chain Analysis and Ecosystem Framework
To support market growth and help clients navigate the impact of geopolitical shifts, DBMR has integrated in-depth supply chain analysis into its Middle East And Africa Alternative Proteins Market research reports. This addition empowers clients to respond effectively to global changes affecting their industries. The supply chain analysis section includes detailed insights such as Middle East And Africa Alternative Proteins Market consumption and production by country, price trend analysis, the impact of tariffs and geopolitical developments, and import and export trends by country and HSN code. It also highlights major suppliers with data on production capacity and company profiles, as well as key importers and exporters. In addition to research, DBMR offers specialized supply chain consulting services backed by over a decade of experience, providing solutions like supplier discovery, supplier risk assessment, price trend analysis, impact evaluation of inflation and trade route changes, and comprehensive market trend analysis.
Data collection and base year analysis are done using data collection modules with large sample sizes. The stage includes obtaining market information or related data through various sources and strategies. It includes examining and planning all the data acquired from the past in advance. It likewise envelops the examination of information inconsistencies seen across different information sources. The market data is analysed and estimated using market statistical and coherent models. Also, market share analysis and key trend analysis are the major success factors in the market report. To know more, please request an analyst call or drop down your inquiry.
The key research methodology used by DBMR research team is data triangulation which involves data mining, analysis of the impact of data variables on the market and primary (industry expert) validation. Data models include Vendor Positioning Grid, Market Time Line Analysis, Market Overview and Guide, Company Positioning Grid, Patent Analysis, Pricing Analysis, Company Market Share Analysis, Standards of Measurement, Global versus Regional and Vendor Share Analysis. To know more about the research methodology, drop in an inquiry to speak to our industry experts.
Data Bridge Market Research is a leader in advanced formative research. We take pride in servicing our existing and new customers with data and analysis that match and suits their goal. The report can be customized to include price trend analysis of target brands understanding the market for additional countries (ask for the list of countries), clinical trial results data, literature review, refurbished market and product base analysis. Market analysis of target competitors can be analyzed from technology-based analysis to market portfolio strategies. We can add as many competitors that you require data about in the format and data style you are looking for. Our team of analysts can also provide you data in crude raw excel files pivot tables (Fact book) or can assist you in creating presentations from the data sets available in the report.


