
Middle East And Africa Anti Money Laundering Market
Market Size in USD Million
 USD
455.77 Million
USD
1,255.20 Million
2024
2032
USD
455.77 Million
USD
1,255.20 Million
2024
2032
| 2025 - 2032 | |
| USD 455.77 Million | |
| USD 1,255.20 Million | |
| % | |
|
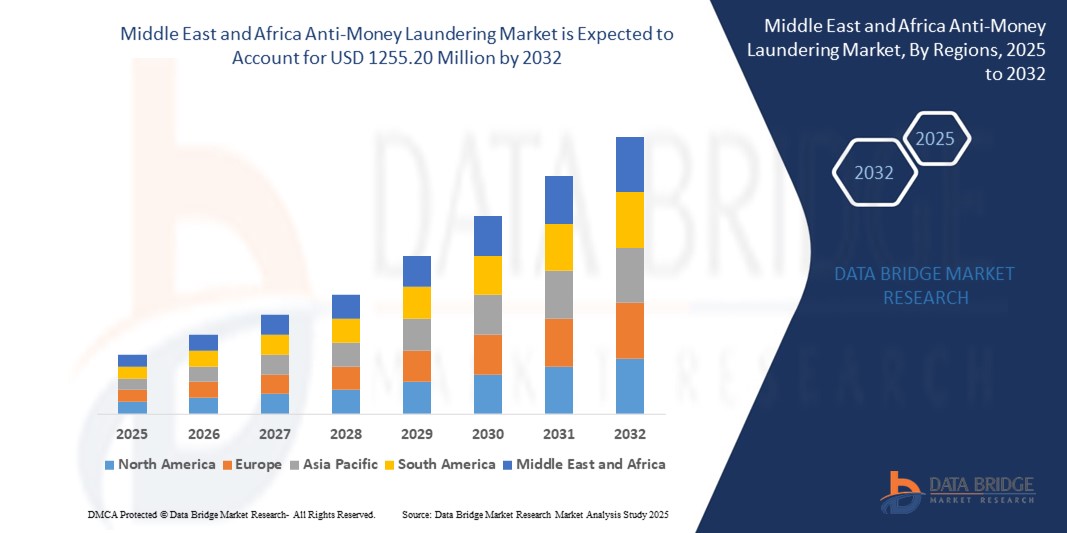
Anti-Money Laundering Market Size
- The Middle East and Africa anti-money laundering market size was valued at USD 455.77 million in 2024 and is expected to reach USD 1255.20 million by 2032, at a CAGR of 13.5% during the forecast period
- The market growth is driven by increasing regulatory requirements, rising financial crimes, and the adoption of advanced technologies such as artificial intelligence and machine learning for enhanced compliance and monitoring solutions
- The growing need for robust, scalable, and integrated anti-money laundering (AML) solutions to combat financial crimes is positioning anti-money laundering systems as critical tools for financial institutions and other regulated sectors, accelerating market expansion
Anti-Money Laundering Market Analysis
- Anti-money laundering solutions, encompassing software and services for detecting and preventing financial crimes, are increasingly vital in ensuring regulatory compliance and safeguarding financial systems across banks, insurance providers, and other sectors
- The demand for anti-money laundering solutions is fueled by stricter government regulations, heightened awareness of money laundering risks, and the need for automated systems to monitor transactions and verify customer identities
- South Africa dominated the Middle East and Africa anti-money laundering market with the largest revenue share of 38.5% in 2024, driven by a well-established financial sector, stringent regulatory frameworks, and significant investments in compliance technologies
- The U.A.E. is expected to be the fastest-growing region during the forecast period, propelled by rapid digital transformation, increasing financial hub status, and government initiatives to strengthen anti-money laundering regulations
- The solutions segment held the largest market revenue share of 60.2% in 2024, driven by the increasing demand for advanced anti-money laundering software that enables real-time transaction monitoring, compliance management, and customer identity verification
Report Scope and Anti-Money Laundering Market Segmentation
|
Attributes |
Anti-Money Laundering Key Market Insights |
|
Segments Covered |
|
|
Countries Covered |
Middle East and Africa
|
|
Key Market Players |
|
|
Market Opportunities |
|
|
Value Added Data Infosets |
In addition to the market insights such as market value, growth rate, market segments, geographical coverage, market players, and market scenario, the market report curated by the Data Bridge Market Research team includes in-depth expert analysis, import/export analysis, pricing analysis, production consumption analysis, and pestle analysis. |
Anti-Money Laundering Market Trends
“Increasing Integration of AI and Machine Learning in AML Solutions”
- The Middle East and Africa (MEA) Anti-Money Laundering (AML) market is experiencing a significant trend toward the integration of Artificial Intelligence (AI) and Machine Learning (ML) technologies
- These technologies enable advanced data processing and analysis, providing deeper insights into financial transactions, customer behaviors, and potential money laundering risks
- AI-powered anti-money laundering solutions allow for proactive identification of suspicious activities, reducing false positives and enhancing compliance efficiency
- For instance, companies are developing AI-driven platforms that analyze transaction patterns to detect anomalies, optimize compliance processes, and provide real-time alerts for potential financial crimes such as terrorist financing, fraud, and bribery
- This trend is increasing the effectiveness of anti-money laundering systems, making them more appealing to financial institutions, governments, and other regulated entities across the MEA region
- AI and ML algorithms can analyze vast datasets, including transaction histories, customer profiles, and cross-border activities, to identify complex money laundering patterns and improve regulatory compliance
Anti-Money Laundering Market Dynamics
Driver
“Rising Demand for Robust Compliance and Financial Crime Prevention”
- The increasing need for stringent regulatory compliance and combating financial crimes, such as money laundering, terrorist financing, and fraud, is a major driver for the MEA anti-money laundering market
- Anti-money laundering solutions enhance financial security by offering features such as real-time transaction monitoring, customer due diligence (KYC/CDD), and automated reporting of suspicious activities
- Government regulations, particularly in countries such as South Africa and the U.A.E., are mandating stricter anti-money laundering frameworks to align with global standards set by bodies such as the Financial Action Task Force (FATF)
- The proliferation of digital banking, online payment systems, and cryptocurrency adoption in the MEA region is further driving the need for advanced anti-money laundering solutions to ensure secure and transparent financial transactions
- Financial institutions are increasingly adopting anti-money laundering systems as standard or optional features to meet regulatory expectations and enhance operational integrity
Restraint/Challenge
“High Implementation Costs and Data Privacy Concerns”
- The significant initial investment required for anti-money laundering hardware, software, and system integration can be a barrier to adoption, particularly for small and medium enterprises (SMEs) in emerging markets within the MEA region
- Integrating anti-money laundering solutions into existing financial systems can be complex and costly, especially for institutions with legacy infrastructure
- Data security and privacy concerns are a major challenge, as anti-money laundering systems collect and process large volumes of sensitive financial and personal data, raising risks of breaches or misuse
- The diverse regulatory landscape across MEA countries regarding data protection and anti-money laundering compliance complicates operations for multinational providers and financial institutions
- These factors may deter adoption, particularly in regions with high cost sensitivity or heightened awareness of data privacy issues, limiting market growth in certain areas
Anti-Money Laundering market Scope
The market is segmented on the basis of offering, function, deployment, enterprise size, and end use.
- By Offering
On the basis of offering, the Middle East and Africa anti-money laundering market is segmented into solutions and services. The solutions segment held the largest market revenue share of 60.2% in 2024, driven by the increasing demand for advanced anti-money laundering software that enables real-time transaction monitoring, compliance management, and customer identity verification. These solutions leverage AI and machine learning to enhance detection of financial crimes such as money laundering and terrorist financing.
The services segment is expected to witness the fastest growth rate of 15.8% from 2025 to 2032, driven by the rising need for expert guidance and managed services to navigate complex anti-money laundering regulations. Financial institutions are increasingly outsourcing compliance tasks to ensure cost-effective regulatory adherence and reduce operational risks.
- By Function
On the basis of function, the Middle East and Africa anti-money laundering market is segmented into compliance management, customer identity management, transaction monitoring, currency transaction reporting, and others. The compliance management segment dominated the market with a 32.6% revenue share in 2024, owing to stringent regulations and the need for financial institutions to strengthen their AML frameworks to avoid penalties and ensure regulatory compliance.
The transaction monitoring segment is anticipated to experience the fastest growth rate of 16.4% from 2025 to 2032, driven by the increasing adoption of AI-driven systems that enhance the detection of suspicious transactions and reduce false positives, improving efficiency in combating financial crimes.
- By Deployment
On the basis of deployment, the Middle East and Africa anti-money laundering market is segmented into cloud and on-premise. The cloud segment held the largest market revenue share of 54.4% in 2024, attributed to its flexibility, scalability, and cost-effectiveness, enabling financial institutions to integrate advanced technologies such as AI and real-time analytics without significant infrastructure investments.
The on-premise segment is expected to witness significant growth from 2025 to 2032, driven by organizations prioritizing control and security over their compliance systems. On-premise solutions offer customization and integration with existing IT infrastructure, which is crucial for large enterprises with complex regulatory needs.
- By Enterprise Size
On the basis of enterprise size, the Middle East and Africa anti-money laundering market is segmented into large enterprises and small & medium enterprises (SMEs). The large enterprises segment dominated the market with a 56.8% revenue share in 2024, driven by their focus on digital payment systems and the need for robust AML solutions to address transaction monitoring and compliance requirements in high-volume financial operations.
The SMEs segment is anticipated to grow rapidly at a CAGR of 17.2% from 2025 to 2032, fueled by increasing awareness of anti-money laundering regulations and the adoption of cost-effective cloud-based solutions that cater to smaller organizations with limited resources.
- By End Use
On the basis of end use, the Middle East and Africa anti-money laundering market is segmented into banks & financial institutions, insurance providers, government, gaming & gambling, and others. The banks & financial institutions segment held the largest market revenue share of 45.3% in 2024, driven by the critical need for anti-money laundering solutions to combat financial crimes such as fraud, terrorist financing, and money laundering in the banking sector.
The gaming & gambling segment is expected to witness the fastest growth rate of 18.1% from 2025 to 2032, fueled by the rising adoption of anti-money laundering solutions to monitor high-risk transactions and ensure compliance with regulations, particularly in online gambling platforms where illicit financial flows are a concern.
Anti-Money Laundering Market Regional Analysis
- South Africa dominated the Middle East and Africa anti-money laundering market with the largest revenue share of 38.5% in 2024, driven by a well-established financial sector, stringent regulatory frameworks, and significant investments in compliance technologies
- The demand for advanced AML solutions, such as transaction monitoring and customer identity management systems, is driven by increasing financial crime detection efforts. The adoption of both cloud and on-premise solutions, coupled with compliance with Financial Action Task Force (FATF) standards, supports sustained market growth
U.A.E. Anti-Money Laundering Market Insight
The U.A.E. market for anti-money laundering solutions is expected to witness the fastest growth rate, driven by rapid financial sector expansion and increasing regulatory scrutiny to combat money laundering and terrorist financing. Financial institutions seek advanced anti-money laundering technologies, including AI-powered compliance and transaction monitoring systems, to enhance efficiency and meet global standards. The growing adoption of cloud-based solutions and the U.A.E.’s position as a financial hub further accelerate market expansion.
Saudi Arabia Anti-Money Laundering Market Insight
Saudi Arabia’s anti-money laundering market is expected to witness significant growth, attributed to its large financial sector and government initiatives to strengthen anti-money laundering and counter-terrorism financing (CFT) frameworks. Financial institutions prioritize solutions offering compliance management and real-time transaction monitoring to address rising financial crime risks. The integration of AML solutions in banks and financial institutions, along with increasing awareness of regulatory compliance, supports sustained market growth.
Anti-Money Laundering Market Share
The anti-money laundering industry is primarily led by well-established companies, including:
- NICE (Israel)
- IBM (U.S.)
- sanctions.io (U.S.)
- Intel Corporation (U.S.)
- Oracle (U.S.)
- SAP SE (Germany)
- Accenture (U.S.)
- Experian Information Solution
- Inc. (Ireland)
- Open Text Corporation (Canada)
- BAE Systems (U.K.)
- SAS Institute Inc (U.S.)
- ACI Worldwide (U.S.)
- Cognizant (U.S.)
- Trulioo (Canada)
- Temenos Headquarters SA (Switzerland)
- WorkFusion, Inc, (U.S.)
- Vixio Regulatory Intelligence (England)
What are the Recent Developments in Middle East and Africa Anti-Money Laundering Market?
- In August 2024, Israeli fintech firm ThetaRay acquired Belgian startup Screena, integrating its AI-powered AML screening solution into ThetaRay’s cloud-based financial crime detection platform. Screena’s technology enhances customer and transaction screening, enabling financial institutions to detect threats such as money laundering, terrorist financing, and gambling-related illegal activities with greater precision. The acquisition marks ThetaRay’s strategic shift toward a comprehensive, end-to-end compliance suite, combining Transaction Monitoring, Customer Risk Assessment, and Sanctions Screening. With over 100 financial institutions across 40+ countries, ThetaRay continues to expand its global footprint and bolster its fight against financial crime
- In February 2023, the Executive Office of Anti-Money Laundering and Counter-Terrorism Financing (EO AML/CTF) of the United Arab Emirates signed a Memorandum of Understanding (MoU) with Egypt’s Money Laundering and Terrorist Financing Combating Unit (EMLCU) to strengthen bilateral cooperation in combating money laundering, terrorist financing, and proliferation financing. The MoU formalizes the exchange of expertise, risk typologies, and best practices, and promotes joint efforts in training, legislative development, and inter-agency coordination. This partnership reflects a growing regional commitment to unified financial crime prevention and aligns with UNODC and FATF standards for cross-border collaboration
- In February 2023, Saudi telecom provider Mobily expanded its Mobily Pay services through a strategic partnership with Ericsson, deploying the Ericsson Wallet Platform to deliver secure, personalized mobile financial services. Users gained access to features such as contactless payments, money transfers, international remittances, digital card payments, bill payments, and mobile top-ups. This rollout supports Saudi Vision 2030 by advancing digital transformation and reducing reliance on cash. While not AML-specific, the expansion of mobile payment ecosystems such as Mobily Pay underscores the need for robust AML frameworks to mitigate risks associated with digital financial transactions
- In January 2023, the Central Bank of the United Arab Emirates (CBUAE) issued updated AML/CFT guidelines for licensed financial institutions (LFIs), including banks, finance companies, exchange houses, and insurance providers. The guidance emphasizes the use of digital ID systems to enhance customer due diligence (CDD), identity proofing, and authentication. LFIs must implement technology best practices, robust governance, and risk mitigation protocols to detect suspicious activity—especially involving sanctioned or high-risk jurisdictions. The guidelines align with FATF standards and require LFIs to demonstrate full compliance, including when relying on third-party onboarding services
- In January 2023, First Abu Dhabi Bank (FAB), in collaboration with Magnati and PayRow Net, launched a digital payment platform aimed at transforming consumer payment experiences across Dubai’s Ports, Customs, and Free Zone Corporation (PCFC). The platform streamlines revenue collection, enables multi-channel payments (POS, cards, e-wallets), and supports co-branded prepaid cards for secure transactions. This initiative aligns with Dubai’s smart city vision and its shift toward a cashless economy. As digital ecosystems expand, such platforms underscore the need for integrated AML
SKU-

- Interactive Data Analysis Dashboard
- Company Analysis Dashboard for high growth potential opportunities
- Research Analyst Access for customization & queries
- Competitor Analysis with Interactive dashboard
- Latest News, Updates & Trend analysis
- Harness the Power of Benchmark Analysis for Comprehensive Competitor Tracking
Data collection and base year analysis are done using data collection modules with large sample sizes. The stage includes obtaining market information or related data through various sources and strategies. It includes examining and planning all the data acquired from the past in advance. It likewise envelops the examination of information inconsistencies seen across different information sources. The market data is analysed and estimated using market statistical and coherent models. Also, market share analysis and key trend analysis are the major success factors in the market report. To know more, please request an analyst call or drop down your inquiry.
The key research methodology used by DBMR research team is data triangulation which involves data mining, analysis of the impact of data variables on the market and primary (industry expert) validation. Data models include Vendor Positioning Grid, Market Time Line Analysis, Market Overview and Guide, Company Positioning Grid, Patent Analysis, Pricing Analysis, Company Market Share Analysis, Standards of Measurement, Global versus Regional and Vendor Share Analysis. To know more about the research methodology, drop in an inquiry to speak to our industry experts.
Data Bridge Market Research is a leader in advanced formative research. We take pride in servicing our existing and new customers with data and analysis that match and suits their goal. The report can be customized to include price trend analysis of target brands understanding the market for additional countries (ask for the list of countries), clinical trial results data, literature review, refurbished market and product base analysis. Market analysis of target competitors can be analyzed from technology-based analysis to market portfolio strategies. We can add as many competitors that you require data about in the format and data style you are looking for. Our team of analysts can also provide you data in crude raw excel files pivot tables (Fact book) or can assist you in creating presentations from the data sets available in the report.


