
Middle East And Africa Antiblock Additive Market
Market Size in USD Million
 USD
409.69 Million
USD
620.06 Million
2024
2032
USD
409.69 Million
USD
620.06 Million
2024
2032
| 2025 - 2032 | |
| USD 409.69 Million | |
| USD 620.06 Million | |
| % | |
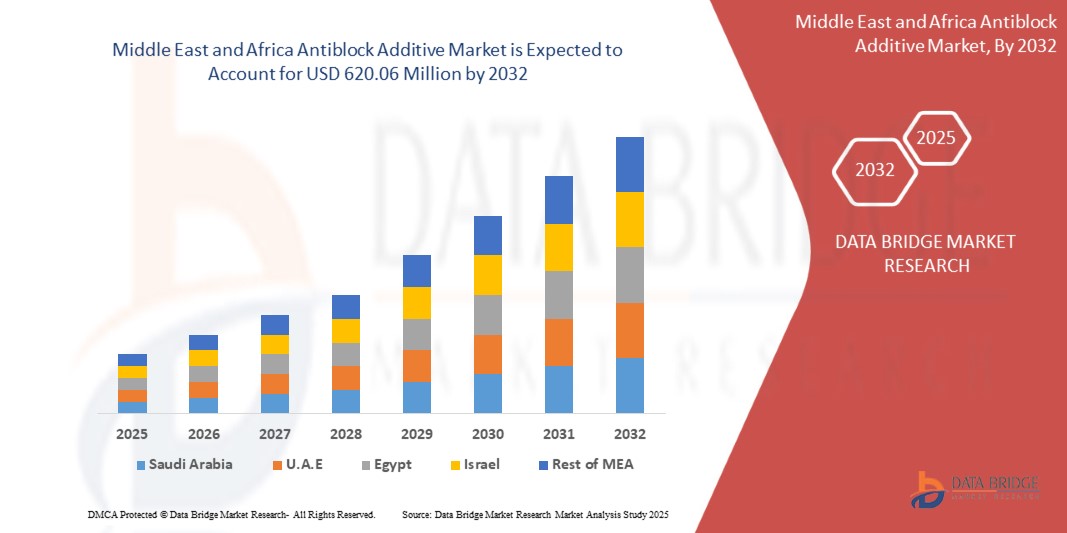
Middle East and Africa Antiblock Additive Market Analysis
The Middle East and Africa antiblock additive market is experiencing robust growth, driven by growing demand for plastic packaging. As the global antiblock additive industry continues to expand, the surge in innovations and advancements in polymer packaging has increased. Growing demand for development of bio-based antiblock additives are creating opportunities for the market. Market dynamics are also influenced by fluctuating raw material prices. Overall, the market is expected to continue expanding, with a focus on innovation and sustainability to meet evolving industrial demands.
Middle East and Africa Antiblock Additive Market Size
Middle East and Africa antiblock additive market size was valued at USD 409.69 million in 2024 and is projected to reach USD 620.06 million by 2032, with a CAGR of 5.33% during the forecast period of 2025 to 2032. In addition to the insights on market scenarios such as market value, growth rate, segmentation, geographical coverage, and major players, the market reports curated by the Data Bridge Market Research also include in-depth expert analysis, pricing analysis, brand share analysis, consumer survey, demography analysis, supply chain analysis, value chain analysis, raw material/consumables overview, vendor selection criteria, PESTLE Analysis, Porter Analysis, and regulatory framework.
Middle East and Africa Antiblock Additive Market Trends
“Growing Demand for Plastic Packaging”
The growing demand for plastic packaging is a significant driver for the global antiblock additive market. As industries such as food and beverage, pharmaceuticals, consumer goods, and e-commerce expand, the need for efficient, durable, and functional packaging solutions increases. Plastic packaging, being lightweight, cost-effective, and versatile, has become the preferred choice across various sectors. This increased reliance on plastic packaging drives the demand for additives that enhance the performance of plastic materials. Antiblock additives play a critical role in improving the processing and performance of plastic films used in packaging. These additives prevent the layers of plastic films from sticking together during manufacturing, handling, and storage. Without antiblock agents, plastic films would adhere to one another, leading to production issues, compromised packaging integrity, and inefficiencies. By reducing such problems, antiblock additives ensure smooth production processes, higher quality products, and more efficient packaging systems.
The surge in demand for flexible plastic packaging, especially in the food industry, further propels the growth of the antiblock additive market. With consumers demanding longer shelf lives, better product preservation, and user-friendly packaging, antiblock additives contribute to improving the functionality and appeal of plastic packaging. In addition, as sustainability becomes a growing concern, the development of environmentally friendly antiblock additives further supports this trend, providing opportunities for innovation in the packaging sector.
Report Scope and Market Segmentation
|
Attributes |
Middle East and Africa Antiblock Additive Key Market Insights |
|
Segments Covered |
|
|
Countries Covered |
Saudi Arabia, U.A.E., South Africa, Egypt, Israel, and Rest of Middle East and Africa |
|
Key Market Players |
Imerys (France), Ampacet CORPORATION (U.S.), ALTANA (Germany), Dow (U.S.), Lyondellbasell Industries Holdings B.V. (Netherlands), Astra Polymers (Saudi Arabia), Avient Corporation (U.S.), BASF (Germany), Cargill, Incorporated (U.S.), Covia Holdings LLC. (U.S.), Evonik (Germany), Fine Organic Industries Limited (India), Honeywell International Inc (U.S.), Inerals Technologies Inc. (U.S.), Momentive Performance Materials (U.S.), National Plastics Color, Inc. (U.S.), plasmix pvt ltd (India), SABIC (Saudi Arabia), Sukano AG (Switzerland), W. R. Grace & Co.-Conn (U.S.), and Wells Plastics (U.K.) |
|
Market Opportunities |
|
|
Value Added Data Infosets |
In addition to the insights on market scenarios such as market value, growth rate, segmentation, geographical coverage, and major players, the market reports curated by the Data Bridge Market Research also include in-depth expert analysis, pricing analysis, brand share analysis, consumer survey, demography analysis, supply chain analysis, value chain analysis, raw material/consumables overview, vendor selection criteria, PESTLE Analysis, Porter Analysis, and regulatory framework. |
Middle East and Africa Antiblock Additive Market Definition
Antiblock additives are chemical compounds used in polymer films, particularly in polyethylene and polypropylene, to reduce the adhesion between film layers. These additives work by creating microscopic rough surfaces that minimize the contact area between layers, preventing them from sticking together. Common antiblock agents include silica, talc, and synthetic silicates. They are widely used in packaging films, agricultural films, and industrial applications to improve handling, processing, and machinability. By reducing blocking, these additives enhance productivity, facilitate film separation, and ensure efficient packaging operations without compromising transparency, mechanical properties, or printability of the final plastic film product.
Middle East and Africa Antiblock Additive Market Dynamics
Drivers
- Booming Automotive and Industrial Sectors
Antiblock additives, which are primarily used in plastic films to prevent them from sticking together during processing, are increasingly vital as industries such as automotive and manufacturing expand. In the automotive sector, there is a growing demand for lightweight, durable, and cost-effective materials for packaging, interiors, and automotive components. Antiblock additives are used in the production of plastic films, which find applications in automotive packaging, protective coatings, and composite materials. With the increasing production of vehicles globally, manufacturers are focusing on improving the performance and appearance of automotive plastics, further boosting the need for antiblock additives. The automotive industry's demand for more efficient, recyclable, and functional materials directly contributes to the market's growth.
Similarly, the industrial sector, which encompasses a wide range of applications, including packaging, construction, and machinery, is a significant driver. As industries demand high-quality plastic films for packaging and machinery, the need for antiblock additives has surged. In the packaging industry, antiblock additives are essential for preventing film layers from sticking together, enhancing the ease of processing, and improving the end product's quality. Furthermore, antiblock additives are integral to industrial packaging solutions, especially in sectors dealing with bulk goods and sensitive materials.
For instance,
- In May 2022, according to an article published by Squarespace, The blog explores the use of plastics in automotive applications, highlighting both the benefits and environmental challenges. Plastics make vehicles lightweight, fuel-efficient, and customizable, but issues such as toxic PVC and poor recyclability can harm the environment. The article calls for more sustainable polymers to address these concerns.
- In May 2023, according to an article published by American Chemistry Council, Inc. A 2023 report from the American Chemistry Council highlights how plastics in automobiles have increased by 16% from 2012 to 2021. Plastics improve fuel efficiency, safety, and performance, especially in Electric Vehicles (EVs), by offsetting the weight of batteries. The report emphasizes plastics' role in sustainability and recycling efforts.
Both sectors' emphasis on reducing costs, improving material properties, and ensuring sustainability leads to increased adoption of antiblock additives. As global automotive and industrial production continues to rise, the demand for these additives is expected to follow suit, reinforcing the positive growth trajectory for the antiblock additive market in the coming years.
- Innovations and Advancements in Polymer Packaging
Innovations in polymer packaging have significantly influenced the growth of the antilock additives market, driving new developments in packaging materials and enhancing product performance. Antilock additives, primarily used in packaging to improve the durability, stability, and performance of polymers, are seeing increased demand due to the evolving needs of the packaging industry. As packaging requirements shift towards more sustainable, efficient, and high-performance materials, antilock additives are playing a key role in enhancing polymer formulations. One of the primary drivers is the growing demand for polymers that are more resistant to friction and wear. Antilock additives help reduce friction between polymer surfaces, minimizing the risk of damage during the packaging process, particularly in industries such as food and pharmaceuticals, where product integrity is crucial. These additives also improve the processing characteristics of polymers, allowing for smoother production processes and extending the life of packaging materials.
As sustainability becomes a critical focus, there is a rise in demand for biodegradable or recyclable packaging materials. Antilock additives are helping make these eco-friendly polymers more effective and durable, ensuring they perform well without compromising the environment. This shift towards greener packaging solutions has led to innovations in the formulation of antilock additives that are not only efficient in reducing friction but also safe for the environment. In addition, the rise of e-commerce has heightened the need for robust packaging solutions that can withstand the rigors of global shipping. Antilock additives contribute to this by improving the performance of polymer packaging, ensuring that products remain intact during transit while reducing the risk of packaging failure.
For instance,
- According to an article published by CarePac., The Packaging Polymers Guide provides detailed insights into various types of polymer packaging materials, including synthetic and biodegradable plastics. It explores common polymers such as polyethylene, PET, and bioplastics, their applications, benefits, risks, and environmental impacts while emphasizing the shift towards sustainable, eco-friendly alternatives in the packaging industry.
- In 2020, according to an article published by Elsevier B.V., This chapter explores food packaging materials, focusing on conventional polymers, bioplastics, and nanopolymers. It highlights the advantages of bioplastics—such as renewability and biodegradability—while addressing challenges such as nonrenewability in traditional polymers. The research aims to improve packaging solutions through technological advancements such as nanotechnology to enhance material performance.
- In February 2024, according to an article published by Michigan State University, This article from Michigan State University examines plastic and polymer-based packaging, highlighting its benefits such as protection, cost-effectiveness, and versatility. It addresses concerns about potential health risks, microplastics, and environmental impact while emphasizing ongoing research to improve packaging materials, sustainability, and consumer safety.
- In January 2024, according to an article published by Polymart, PolyMart provides a comprehensive overview of polymers used in food packaging, highlighting their types, properties, and benefits, such as protecting food, extending shelf life, and being cost-effective. The platform offers seamless procurement options through its Buyer App, connecting buyers with trusted suppliers and providing real-time price trends.
Innovations in polymer packaging, driven by advances in antilock additives, are meeting the growing demand for high-performance, sustainable, and durable packaging solutions, thus fostering the expansion of the antilock additives market.
Opportunities
- Advancements in Bio-Based Antiblock Additives
The development of bio-based antiblock additives represents a significant advancement in the field of polymer processing, particularly in addressing the challenges associated with film adhesion. Traditionally, inorganic antiblock additives such as silica or talc have been employed to mitigate blocking—the undesirable sticking together of polymer film layers. While effective, these inorganic additives can compromise the optical clarity of films, especially at higher concentrations. In contrast, bio-based antiblock additives offer a sustainable and efficient alternative, enhancing film performance without sacrificing clarity.
Bio-based antiblock additives, such as those derived from natural amides, function by migrating to the polymer surface, forming a lubricating layer that reduces the coefficient of friction between film layers. This mechanism not only prevents blocking but also maintains the transparency of the film, which is crucial for applications such as food packaging where product visibility is important.
The shift towards bio-based solutions is also driven by environmental considerations. As industries seek to reduce their ecological footprint, the demand for sustainable additives has increased. Bio-based antiblock additives, being derived from renewable resources, align with these sustainability goals. Companies such as Fine Organics have developed products such as Finawax B, a refined vegetable-based behenamide that offers optimal antiblocking properties in polyolefin-based films. When used in combination with inorganic antiblock agents at suitable dosages, it effectively balances performance with environmental responsibility.
For instance,
- According to a blog published by Cargill, Incorporated, Optislip™ BR (behenamide) is a bio-based antiblock additive designed for polymer films. It reduces blocking by forming a lubricating surface layer while maintaining film clarity. Suitable for various polymers, it offers a sustainable alternative to inorganic additives, aligning with industry demands for high-performance and eco-friendly packaging solutions.
- According to Fine Organic Industries Limited, Finawax B, a vegetable-based behenamide, is an effective bio-based antiblock additive for polyolefin films. It minimizes film adhesion while maintaining transparency, reducing reliance on inorganic antiblock agents. This sustainable solution enhances packaging performance and aligns with the industry's shift toward eco-friendly polymer additives.
The development of bio-based antiblock additives marks a pivotal shift in polymer additive technology. By providing effective antiblocking solutions that do not compromise film clarity and support sustainability initiatives, these additives are poised to play a crucial role in the future of packaging and other industries reliant on polymer films.
- Surge in Online Shopping and Growth in E-Commerce Packaging
The rapid expansion of e-commerce has significantly transformed consumer purchasing behaviors, leading to a substantial increase in online shopping. This surge necessitates efficient and reliable packaging solutions to ensure products are delivered intact and presentable. Consequently, there is a heightened demand for high-quality packaging films that prevent issues such as blocking, where film layers stick together, hindering packaging processes and compromising product integrity.
Anti-block additives play a crucial role in addressing these challenges by reducing the adhesion between film layers, thereby enhancing the efficiency of packaging operations. These additives are incorporated into polymer films to create a micro-rough surface, minimizing contact points between layers and facilitating smoother handling during manufacturing and product packaging.
This growth is attributed to the rising consumption of packaged goods, particularly in the food, beverage, and pharmaceutical industries, which are integral components of the e-commerce ecosystem. As consumers increasingly rely on online platforms for their purchases, the demand for packaging films that maintain product quality and safety during transit has become paramount.
For instance,
- According to Plastiblends, Polyaddit Anti-Block Masterbatches prevent film adhesion by introducing fine particles that create a micro-rough surface, reducing contact between layers. This enhances handling efficiency during manufacturing and packaging, ensuring smoother processing and improved product performance in industries such as food packaging, pharmaceuticals, and consumer goods.
- In March 2024, according to an article by Flex-Pack Engineering, Inc., the surge in online shopping and the growth of e-commerce have significantly increased the demand for efficient and reliable packaging solutions. Flexible plastic films are commonly used in packaging due to their lightweight and protective properties. However, these films can stick together—a phenomenon known as "blocking"—which can hinder packaging processes and affect product quality. To address this issue, anti-block additives are incorporated into plastic films to create a micro-rough surface, reducing adhesion between film layers and facilitating smoother handling and processing. This enhancement is crucial for maintaining efficiency in high-speed packaging operations, which are typical in e-commerce.
- In November 2019, according to an article published by Furion Analytics Research & Consulting LLP, the growing demand for packaging films across sectors such as food & beverage, pharmaceuticals, and consumer goods has been a major driver of the packaging film market's expansion. This growth has particularly increased the demand for anti-block additives, which are crucial for the handling and performance of films—especially polyolefin films such as Polyethylene (PE) and Polypropylene (PP), which are prone to blocking issues.
In conclusion, the surge in online shopping and the consequent growth in e-commerce packaging are pivotal opportunities for the anti-block additives market. As the e-commerce sector continues to expand, the importance of effective packaging solutions that ensure product integrity and customer satisfaction will only intensify, underscoring the critical role of anti-block additives in the packaging industry.
Restraints/Challenges
- Availability of Alternative Additives and Solutions
The availability of alternative additives and solutions serves as a significant restraint in the global antilock additives market. As new technologies and materials emerge, manufacturers are increasingly exploring alternatives to traditional antilock additives, often driven by the desire for cost efficiency, sustainability, and performance improvements. These alternative additives, which may offer similar or enhanced properties, challenge the demand for conventional antilock solutions, leading to increased competition and reduced market share for traditional products.
One key restraint posed by the availability of alternatives is the shifting preference towards eco-friendly or biodegradable additives. As sustainability becomes a growing concern in many industries, manufacturers are seeking solutions that minimize environmental impact. While traditional antilock additives are effective, alternatives such as natural-based or bio-derived additives are gaining traction, creating a potential shift in market demand. These alternatives are often perceived as more environmentally responsible, driving a preference for them over conventional chemical additives. Moreover, advancements in material science have led to the development of innovative polymer-based solutions that provide enhanced friction-reducing properties without the need for traditional antilock additives. These new solutions may offer superior performance, reducing the reliance on additives and, in turn, affecting the demand for antilock products.
In addition, cost considerations also play a role. Manufacturers may opt for alternative additives if they are more cost-effective, particularly in regions where price sensitivity is high. This price-driven shift could be exacerbated if alternative solutions demonstrate comparable or superior performance at a lower cost.
For instance,
- In May 2019, according to an article published by Plastics Technology, DuPont launched the Dow Corning AMB-12235 masterbatch, combining anti-block and slip additives to improve PE film processing. This silicone-based formulation provides a low coefficient of friction, prevents film blocking, and reduces migration, all at low loadings (4-6%), streamlining production, reducing complexity, and saving space in the supply chain.
- According to an article published by ChemPoint., Momentive Tospearl silicone beads are advanced antiblock and slip additives for polyolefin films, designed to prevent adhesion between layers and reduce the coefficient of friction during extrusion. These additives improve film clarity, and processing efficiency, and reduce downtime while being FDA-approved for food contact applications and thermally stable up to 400°C.
Overall, the availability of alternative additives and solutions poses a challenge to the growth of the antilock additives market, as manufacturers may prioritize newer, more sustainable, or cost-efficient options, limiting the market potential for traditional antilock products.
- Regulatory Compliance and Testing Standards
The antiblock additive market is subject to stringent regulatory compliance and testing standards to ensure product safety and environmental protection. In the United States, the Food and Drug Administration (FDA) oversees substances intended for food contact, including antiblock additives used in packaging materials. Manufacturers must demonstrate that these additives are safe for their intended use, which involves thorough evaluations of raw materials and potential migration into food products.
In Europe, the European Chemicals Agency (ECHA) and the European Food Safety Authority (EFSA) play pivotal roles in assessing the safety of chemical substances, including antiblock additives. The REACH regulation mandates that manufacturers and importers register chemicals, including their intended uses and safety data. This rigorous regulatory environment ensures that all materials in contact with food are safe and do not jeopardize public health.
The regulatory framework surrounding antiblock additives is crucial for ensuring product safety, environmental protection, and compliance with industry standards. Antiblock additives are typically used in packaging materials, particularly in polyethylene films, to prevent sheets from sticking together, which can greatly enhance usability and product quality. However, their widespread usage has necessitated the development of comprehensive regulatory guidelines to govern their use.
Different countries and regions have established their regulatory guidelines. In the United States, for example, the Food and Drug Administration (FDA) oversees the use of substances intended to come into contact with food, including additives used in food packaging. The FDA requires that all food contact substances be safe for their intended use, which includes a thorough review of the raw materials and potential migration of additives into food products.
For instance,
- In January 2025, according to a blog published by the European Food Safety Authority, EFSA provided in-depth information on food additives, focusing on safety evaluations and regulatory frameworks in the European Union. Their assessments help ensure that additives used in food packaging, such as antiblock agents, are safe for consumers and comply with stringent environmental and health standards to protect public well-being.
- The European Chemicals Agency (ECHA) provides a comprehensive overview of legislation for active and intelligent materials intended for food contact. This includes regulations ensuring the safety of materials, such as antiblock agents, used in packaging. ECHA's framework helps safeguard consumer health and ensures compliance with EU standards for food safety.
Adherence to regulatory compliance and testing standards is essential for the antiblock additive market to ensure product safety, environmental sustainability, and consumer health. Strict oversight by authorities such as the FDA, ECHA, and EFSA helps maintain industry integrity, fostering safer and more effective use of additives in packaging materials.
Impact and Current Market Scenario of Raw Material Shortage and Shipping Delays
Data Bridge Market Research offers a high-level analysis of the market and delivers information by keeping in account the impact and current market environment of raw material shortage and shipping delays. This translates into assessing strategic possibilities, creating effective action plans, and assisting businesses in making important decisions.
Apart from the standard report, we also offer in-depth analysis of the procurement level from forecasted shipping delays, distributor mapping by region, commodity analysis, production analysis, price mapping trends, sourcing, category performance analysis, supply chain risk management solutions, advanced benchmarking, and other services for procurement and strategic support.
Expected Impact of Economic Slowdown on the Pricing and Availability of Products
When economic activity slows, industries begin to suffer. The forecasted effects of the economic downturn on the pricing and accessibility of the products are taken into account in the market insight reports and intelligence services provided by DBMR. With this, our clients can typically keep one step ahead of their competitors, project their sales and revenue, and estimate their profit and loss expenditures.
Middle East and Africa Antiblock Additive Market Scope
The market is segmented on the basis of type, target polymer, and end-use industry. The growth amongst these segments will help you analyze meagre growth segments in the industries and provide the users with a valuable market overview and market insights to help them make strategic decisions for identifying core market applications.
Form
- Inorganic
- Organic
Target Polymer
- Polyethylene (PE)
- Polyvinyl Chloride (PVC)
- Biaxially-Oriented Polypropylene (BOPP)
- Polyethylene Terephthalate (PET)
- Polystyrene (PS)
- Others
End-Use Industry
- Packaging
- Industrial
- Agriculture
- Medical and Healthcare
- Electronics and Solar
- Printing and Optics
- Others
Middle East and Africa Antiblock Additive Market Regional Analysis
The market is analyzed and market size insights and trends are provided by country, type, target polymer, and end-use industry as referenced above.
The countries covered in the market are Saudi Arabia, U.A.E., South Africa, Egypt, Israel, and Rest of Middle East and Africa.
Saudi Arabia is poised to dominate the market due to its rapidly expanding agricultural sector and increasing demand for high-performance films. Government initiatives, water conservation efforts, and advanced farming technologies drive growth, ensuring improved crop yield, sustainability, and enhanced agricultural efficiency.
Saudi Arabia is the fastest-growing country in the region due to large-scale investments in agriculture, infrastructure, and industrial sectors. Government initiatives such as Vision 2030, technological advancements, and increasing demand for high-performance materials drive market expansion, fostering innovation and economic diversification.
The country section of the report also provides individual market impacting factors and changes in regulation in the market domestically that impacts the current and future trends of the market. Data points such as down-stream and upstream value chain analysis, technical trends and porter's five forces analysis, case studies are some of the pointers used to forecast the market scenario for individual countries. Also, the presence and availability of global brands and their challenges faced due to large or scarce competition from local and domestic brands, impact of domestic tariffs and trade routes are considered while providing forecast analysis of the country data.
Middle East and Africa Antiblock Additive Market Share
The market competitive landscape provides details by competitors. Details included are company overview, company financials, revenue generated, market potential, investment in research and development, new market initiatives, global presence, production sites and facilities, production capacities, company strengths and weaknesses, product launch, product width and breadth, application dominance. The above data points provided are only related to the companies' focus related to market.
Middle East and Africa Antiblock Additive Market Leaders Operating in the Market Are:
- Imerys (France)
- Ampacet CORPORATION (U.S.)
- ALTANA (Germany)
- Dow (U.S.)
- Lyondellbasell Industries Holdings B.V. (Netherlands)
- Astra Polymers (Saudi Arabia)
- Avient Corporation (U.S.)
- BASF (Germany)
- Cargill, Incorporated (U.S.)
- Covia Holdings LLC. (U.S.)
- Evonik (Germany)
- Fine Organic Industries Limited (India)
- Honeywell International Inc (U.S.)
- Inerals Technologies Inc. (U.S.)
- Momentive Performance Materials (U.S.)
- National Plastics Color, Inc. (U.S.)
- plasmix pvt ltd (India)
- SABIC (Saudi Arabia)
- Sukano AG (Switzerland)
- W. R. Grace & Co.-Conn (U.S.)
- Wells Plastics (U.K.)
Latest Developments in Middle East and Africa Antiblock Additive Market
- In December 2024, SABIC introduced LNP ELCRES CXL polycarbonate copolymer resins, offering exceptional chemical resistance, ideal for mobility, electronics, industrial, and infrastructure applications. These materials provide improved durability, weatherability, and low-temperature impact resistance. Available in bio-renewable versions under SABIC's TRUCIRCLE program, they contribute to sustainability and enhance part performance, even under harsh chemical exposure
- In November2024, SABIC has renewed its honorary strategic partnership with the Boao Forum for Asia (BFA), marking 17 consecutive years of sponsorship. This partnership highlights SABIC's commitment to sustainable development through cross-regional collaboration. The company continues to leverage BFA as a platform for enhancing influence and driving inclusive development globally
- In January 2025, Evonik Industries AG and Fuhua Tongda Chemicals Companyhave established a joint venture in Leshan, China, to produce specialty hydrogen peroxide (H2O2) for applications such as solar panels, semiconductors, and food packaging. With Evonik holding 51% and Fuhua 49%, the venture will start supplying the market in 2026. This partnership strengthens Evonik's presence in the Asia Pacific region
- On June 2024, Covia Holdings LLC finalized the separation of its Energy and Industrial businesses into two independent entities: Covia Energy, LLC, headquartered in The Woodlands, Texas, and Covia Solutions, based in Independence, Ohio. This strategic move allows each company to focus on its respective market opportunities
SKU-

- Interactive Data Analysis Dashboard
- Company Analysis Dashboard for high growth potential opportunities
- Research Analyst Access for customization & queries
- Competitor Analysis with Interactive dashboard
- Latest News, Updates & Trend analysis
- Harness the Power of Benchmark Analysis for Comprehensive Competitor Tracking
Table of Content
1 INTRODUCTION
1.1 OBJECTIVES OF THE STUDY
1.2 MARKET DEFINITION
1.3 OVERVIEW
1.4 LIMITATIONS
1.5 MARKETS COVERED
2 MARKET SEGMENTATION
2.1 MARKETS COVERED
2.2 GEOGRAPHICAL SCOPE
2.3 YEARS CONSIDERED FOR THE STUDY
2.4 CURRENCY AND PRICING
2.5 DBMR TRIPOD DATA VALIDATION MODEL
2.6 MULTIVARIATE MODELING
2.7 PRIMARY INTERVIEWS WITH KEY OPINION LEADERS
2.8 DBMR MARKET POSITION GRID
2.9 DBMR VENDOR SHARE ANALYSIS
2.1 MARKET APPLICATION COVERAGE GRID
2.11 SECONDARY SOURCES
2.12 ASSUMPTIONS
3 EXECUTIVE SUMMARY
4 PREMIUM INSIGHTS
4.1 PESTEL ANALYSIS
4.1.1 POLITICAL FACTORS
4.1.2 ECONOMIC FACTORS
4.1.3 SOCIAL FACTORS
4.1.4 TECHNOLOGICAL FACTORS
4.1.5 ENVIRONMENTAL FACTORS
4.1.6 LEGAL FACTORS
4.2 PORTER’S FIVE FORCES ANALYSIS
4.2.1 THREAT OF NEW ENTRANTS
4.2.2 BARGAINING POWER OF SUPPLIERS
4.2.3 BARGAINING POWER OF BUYERS
4.2.4 THREAT OF SUBSTITUTES
4.2.5 INTERNAL COMPETITION
4.3 VENDOR SELECTION CRITERIA
4.3.1 QUALITY AND CONSISTENCY
4.3.2 TECHNICAL EXPERTISE
4.3.3 SUPPLY CHAIN RELIABILITY
4.3.4 COMPLIANCE AND SUSTAINABILITY
4.3.5 COST AND PRICING STRUCTURE
4.3.6 FINANCIAL STABILITY
4.3.7 FLEXIBILITY AND CUSTOMIZATION
4.3.8 RISK MANAGEMENT AND CONTINGENCY PLANS
5 MARKET OVERVIEW
5.1 DRIVERS
5.1.1 GROWING DEMAND FOR PLASTIC PACKAGING
5.1.2 BOOMING AUTOMOTIVE AND INDUSTRIAL SECTORS
5.1.3 INNOVATIONS AND ADVANCEMENTS IN POLYMER PACKAGING
5.1.4 FAST EXPANDING AGRICULTURAL SECTOR AND RISING NEED FOR HIGH-PERFORMANCE FILMS
5.2 RESTRAINTS
5.2.1 FLUCTUATING RAW MATERIAL PRICES
5.2.2 AVAILABILITY OF ALTERNATIVE ADDITIVES AND SOLUTIONS
5.3 OPPORTUNITIES
5.3.1 ADVANCEMENTS IN BIO-BASED ANTIBLOCK ADDITIVES
5.3.2 SURGE IN ONLINE SHOPPING AND GROWTH IN E-COMMERCE PACKAGING
5.4 CHALLENGES
5.4.1 REGULATORY COMPLIANCE AND TESTING STANDARDS
5.4.2 SHIFTING CONSUMER FOCUS TOWARD PAPER-BASED PACKAGING
6 MIDDLE EAST AND AFRICA ANTIBLOCK ADDITIVE MARKET, BY FORM
6.1 OVERVIEW
6.2 INORGANIC
6.2.1 INORGANIC, BY TYPE
6.2.2 INORGANIC, BY PARTICLE SIZE
6.3 ORGANIC
6.3.1 ORGANIC, BY FORM
7 MIDDLE EAST AND AFRICA ANTIBLOCK ADDITIVE MARKET, BY TARGET POLYMER
7.1 OVERVIEW
7.2 POLYETHYLENE(PE)
7.2.1 POLYETHYLENE (PE), BY TARGET POLYMER
7.3 POLYVINYL CHLORIDE (PVC)
7.4 BIAXIALLY-ORIENTED POLYPROPYLENE (BOPP)
7.5 POLYETHYLENE TEREPHTHALATE (PET)
7.6 POLYSTYRENE (PS)
7.7 OTHERS
8 MIDDLE EAST AND AFRICA ANTIBLOCK ADDITIVE MARKET, BY END USE INDUSTRY
8.1 OVERVIEW
8.2 PACKAGING
8.3 INDUSTRIAL
8.4 AGRICULTURE
8.5 MEDICAL AND HEALTHCARE
8.6 ELECTRONICS AND SOLAR
8.7 PRINTING AND OPTICS
8.8 OTHERS
9 MIDDLE EAST AND AFRICA ANTIBLOCK ADDITIVE MARKET, BY REGION
9.1 MIDDLE EAST AND AFRICA
9.1.1 SAUDI ARABIA
9.1.2 U.A.E
9.1.3 SOUTH AFRICA
9.1.4 EGYPT
9.1.5 ISRAEL
9.1.6 REST OF MIDDLE EAST AND AFRICA
10 MIDDLE EAST AND AFRICA ANTIBLOCK ADDITIVE MARKET: COMPANY LANDSCAPE
10.1 COMPANY SHARE ANALYSIS: MIDDLE EAST AND AFRICA
11 SWOT ANALYSIS
12 COMPANY PROFILES
12.1 IMERYS
12.1.1 COMPANY SNAPSHOT
12.1.2 REVENUE ANALYSIS
12.1.3 COMPANY SHARE ANALYSIS
12.1.4 PRODUCT PORTFOLIO
12.1.5 RECENT DEVELOPMENT
12.2 AMPACET CORPORATION
12.2.1 COMPANY SNAPSHOT
12.2.2 COMPANY SHARE ANALYSIS
12.2.3 PRODUCT PORTFOLIO
12.2.4 RECENT DEVELOPMENTS
12.3 ALTANA
12.3.1 COMPANY SNAPSHOT
12.3.2 COMPANY SHARE ANALYSIS
12.3.3 PRODUCT PORTFOLIO
12.3.4 RECENT DEVELOPMENTS
12.4 DOW
12.4.1 COMPANY SNAPSHOT
12.4.2 REVENUE ANALYSIS
12.4.3 COMPANY SHARE ANALYSIS
12.4.4 PRODUCT PORTFOLIO
12.4.5 RECENT DEVELOPMENTS
12.5 LYONDELLBASELL INDUSTRIES HOLDINGS B.V.
12.5.1 COMPANY SNAPSHOT
12.5.2 REVENUE ANALYSIS
12.5.3 COMPANY SHARE ANALYSIS
12.5.4 PRODUCT PORTFOLIO
12.5.5 RECENT DEVELOPMENT
12.6 ASTRA POLYMERS
12.6.1 COMPANY SNAPSHOT
12.6.2 PRODUCT/BRAND PORTFOLIO
12.6.3 RECENT DEVELOPMENTS
12.7 AVIENT CORPORATION
12.7.1 COMPANY SNAPSHOT
12.7.2 REVENUE ANALYSIS
12.7.3 PRODUCT PORTFOLIO
12.7.4 RECENT DEVELOPMENT
12.8 BASF
12.8.1 COMPANY SNAPSHOT
12.8.2 REVENUE ANALYSIS
12.8.3 PRODUCT PORTFOLIO
12.8.4 RECENT DEVELOPMENT
12.9 CARGILL, INCORPORATED
12.9.1 COMPANY SNAPSHOT
12.9.2 PRODUCT PORTFOLIO
12.9.3 RECENT DEVELOPMENTS
12.1 COVIA HOLDINGS LLC.
12.10.1 COMPANY SNAPSHOT
12.10.2 PRODUCT PORTFOLIO
12.10.3 RECENT DEVELOPMENT
12.11 EVONIK
12.11.1 COMPANY SNAPSHOT
12.11.2 REVENUE ANALYSIS
12.11.3 PRODUCT PORTFOLIO
12.11.4 RECENT DEVELOPMENTS
12.12 FINE ORGANIC INDUSTRIES LIMITED
12.12.1 COMPANY SNAPSHOT
12.12.2 REVENUE ANALYSIS
12.12.3 PRODUCT PORTFOLIO
12.12.4 RECENT DEVELOPMENTS
12.13 HONEYWELL INTERNATIONAL INC
12.13.1 COMPANY SNAPSHOT
12.13.2 REVENUE ANALYSIS
12.13.3 PRODUCT PORTFOLIO
12.13.4 RECENT DEVELOPMENTS
12.14 INERALS TECHNOLOGIES INC.
12.14.1 COMPANY SNAPSHOT
12.14.2 REVENUE ANALYSIS
12.14.3 PRODUCT PORTFOLIO
12.14.4 RECENT DEVELOPMENT
12.15 MOMENTIVE PERFORMANCE MATERIALS
12.15.1 COMPANY SNAPSHOT
12.15.2 PRODUCT PORTFOLIO
12.15.3 RECENT DEVELOPMENTS
12.16 NATIONAL PLASTICS COLOR, INC.
12.16.1 COMPANY SNAPSHOT
12.16.2 PRODUCT PORTFOLIO
12.16.3 RECENT DEVELOPMENTS
12.17 PLASMIX PVT LTD
12.17.1 COMPANY SNAPSHOT
12.17.2 PRODUCT PORTFOLIO
12.17.3 RECENT DEVELOPMENT
12.18 SABIC
12.18.1 COMPANY SNAPSHOT
12.18.2 REVENUE ANALYSIS
12.18.3 PRODUCT PORTFOLIO
12.18.4 RECENT DEVELOPMENTS
12.19 SUKANO AG
12.19.1 COMPANY SNAPSHOT
12.19.2 PRODUCT/BRAND PORTFOLIO
12.19.3 RECENT DEVELOPMENTS
12.2 W. R. GRACE & CO.-CONN
12.20.1 COMPANY SNAPSHOT
12.20.2 PRODUCT PORTFOLIO
12.20.3 RECENT DEVELOPMENTS
12.21 WELLS PLASTICS
12.21.1 COMPANY SNAPSHOT
12.21.2 PRODUCT PORTFOLIO
12.21.3 RECENT DEVELOPMENTS
13 QUESTIONNAIRE
14 RELATED REPORTS
List of Table
TABLE 1 MIDDLE EAST AND AFRICA ANTIBLOCK ADDITIVE MARKET, BY FORM, 2018-2032 (USD THOUSAND)
TABLE 2 MIDDLE EAST AND AFRICA ANTIBLOCK ADDITIVE MARKET, BY FORM, 2018-2032 (TONS)
TABLE 3 MIDDLE EAST AND AFRICA INORGANIC IN ANTIBLOCK ADDITIVE MARKET, BY REGION, 2018-2032 (USD THOUSAND)
TABLE 4 MIDDLE EAST AND AFRICA INORGANIC IN ANTIBLOCK ADDITIVE MARKET, BY REGION, 2018-2032, (TONS)
TABLE 5 MIDDLE EAST AND AFRICA INORGANIC IN ANTIBLOCK ADDITIVE MARKET, BY TYPE, 2018-2032 (USD THOUSAND)
TABLE 6 MIDDLE EAST AND AFRICA INORGANIC IN ANTIBLOCK ADDITIVE MARKET, BY TYPE, 2018-2032 (TONS)
TABLE 7 MIDDLE EAST AND AFRICA INORGANIC IN ANTIBLOCK ADDITIVE MARKET, BY PARTICLE SIZE, 2018-2032 (USD THOUSAND)
TABLE 8 MIDDLE EAST AND AFRICA INORGANIC IN ANTIBLOCK ADDITIVE MARKET, BY PARTICLE SIZE, 2018-2032 (TONS)
TABLE 9 MIDDLE EAST AND AFRICA ORGANIC IN ANTIBLOCK ADDITIVE MARKET, BY REGION, 2018-2032 (USD THOUSAND)
TABLE 10 MIDDLE EAST AND AFRICA ORGANIC IN ANTIBLOCK ADDITIVE MARKET, BY REGION, 2018-2032, (TONS)
TABLE 11 MIDDLE EAST AND AFRICA ORGANIC IN ANTIBLOCK ADDITIVE MARKET, BY FORM, 2018-2032 (USD THOUSAND)
TABLE 12 MIDDLE EAST AND AFRICA ORGANIC IN ANTIBLOCK ADDITIVE MARKET, BY FORM, 2018-2032 (TONS)
TABLE 13 MIDDLE EAST AND AFRICA ANTIBLOCK ADDITIVE MARKET, BY TARGET POLYMER, 2018-2032 (USD THOUSAND)
TABLE 14 MIDDLE EAST AND AFRICA ANTIBLOCK ADDITIVE MARKET, BY TARGET POLYMER, 2018-2032 (TONS)
TABLE 15 MIDDLE EAST AND AFRICA POLYETHYLENE (PE) IN ANTIBLOCK ADDITIVE MARKET, BY REGION, 2018-2032 (USD THOUSAND)
TABLE 16 MIDDLE EAST AND AFRICA POLYETHYLENE (PE) IN ANTIBLOCK ADDITIVE MARKET, BY REGION, 2018-2032, (TONS)
TABLE 17 MIDDLE EAST AND AFRICA POLYETHYLENE (PE) IN ANTIBLOCK ADDITIVE MARKET, BY TARGET POLYMER, 2018-2032 (USD THOUSAND)
TABLE 18 MIDDLE EAST AND AFRICA POLYETHYLENE (PE) IN ANTIBLOCK ADDITIVE MARKET, BY TARGET POLYMER, 2018-2032 (TONS)
TABLE 19 MIDDLE EAST AND AFRICA POLYVINYL CHLORIDE (PVC) IN ANTIBLOCK ADDITIVE MARKET, BY REGION, 2018-2032 (USD THOUSAND)
TABLE 20 MIDDLE EAST AND AFRICA POLYVINYL CHLORIDE (PVC) IN ANTIBLOCK ADDITIVE MARKET, BY REGION, 2018-2032, (TONS)
TABLE 21 MIDDLE EAST AND AFRICA BIAXIALLY-ORIENTED POLYPROPYLENE (BOPP) IN ANTIBLOCK ADDITIVE MARKET, BY REGION, 2018-2032 (USD THOUSAND)
TABLE 22 MIDDLE EAST AND AFRICA BIAXIALLY-ORIENTED POLYPROPYLENE (BOPP) IN ANTIBLOCK ADDITIVE MARKET, BY REGION, 2018-2032, (TONS)
TABLE 23 MIDDLE EAST AND AFRICA POLYETHYLENE TEREPHTHALATE (PET) IN ANTIBLOCK ADDITIVE MARKET, BY REGION, 2018-2032 (USD THOUSAND)
TABLE 24 MIDDLE EAST AND AFRICA POLYETHYLENE TEREPHTHALATE (PET) IN ANTIBLOCK ADDITIVE MARKET, BY REGION, 2018-2032, (TONS)
TABLE 25 MIDDLE EAST AND AFRICA POLYSTYRENE (PS) IN ANTIBLOCK ADDITIVE MARKET, BY REGION, 2018-2032 (USD THOUSAND)
TABLE 26 MIDDLE EAST AND AFRICA POLYSTYRENE (PS) IN ANTIBLOCK ADDITIVE MARKET, BY REGION, 2018-2032, (TONS)
TABLE 27 MIDDLE EAST AND AFRICA OTHERS IN ANTIBLOCK ADDITIVE MARKET, BY REGION, 2018-2032 (USD THOUSAND)
TABLE 28 MIDDLE EAST AND AFRICA OTHERS IN ANTIBLOCK ADDITIVE MARKET, BY REGION, 2018-2032 (TONS)
TABLE 29 MIDDLE EAST AND AFRICA ANTIBLOCK ADDITIVE MARKET, BY END USE INDUSTRY, 2018-2032 (USD THOUSAND)
TABLE 30 MIDDLE EAST AND AFRICA ANTIBLOCK ADDITIVE MARKET, BY END USE INDUSTRY, 2018-2032 (TONS)
TABLE 31 MIDDLE EAST AND AFRICA PACKAGING IN ANTIBLOCK ADDITIVE MARKET, BY REGION, 2018-2032, (USD THOUSAND)
TABLE 32 MIDDLE EAST AND AFRICA PACKAGING IN ANTIBLOCK ADDITIVE MARKET, BY REGION, 2018-2032 (TONS)
TABLE 33 MIDDLE EAST AND AFRICA PACKAGING IN ANTIBLOCK ADDITIVE MARKET, BY TYPE, 2018-2032 (USD THOUSAND)
TABLE 34 MIDDLE EAST AND AFRICA PACKAGING IN ANTIBLOCK ADDITIVE MARKET, BY TYPE, 2018-2032 (TONS)
TABLE 35 MIDDLE EAST AND AFRICA PACKAGING IN ANTIBLOCK ADDITIVE MARKET, BY FORM, 2018-2032 (USD THOUSAND)
TABLE 36 MIDDLE EAST AND AFRICA PACKAGING IN ANTIBLOCK ADDITIVE MARKET, BY FORM, 2018-2032 (TONS)
TABLE 37 MIDDLE EAST AND AFRICA INDUSTRIAL IN ANTIBLOCK ADDITIVE MARKET, BY REGION, 2018-2032, (USD THOUSAND)
TABLE 38 MIDDLE EAST AND AFRICA INDUSTRIAL IN ANTIBLOCK ADDITIVE MARKET, BY REGION, 2018-2032 (TONS)
TABLE 39 MIDDLE EAST AND AFRICA INDUSTRIAL IN ANTIBLOCK ADDITIVE MARKET, BY TYPE, 2018-2032 (USD THOUSAND)
TABLE 40 MIDDLE EAST AND AFRICA INDUSTRIAL IN ANTIBLOCK ADDITIVE MARKET, BY TYPE, 2018-2032 (TONS)
TABLE 41 MIDDLE EAST AND AFRICA INDUSTRIAL IN ANTIBLOCK ADDITIVE MARKET, BY FORM, 2018-2032 (USD THOUSAND)
TABLE 42 MIDDLE EAST AND AFRICA INDUSTRIAL IN ANTIBLOCK ADDITIVE MARKET, BY FORM, 2018-2032 (TONS)
TABLE 43 MIDDLE EAST AND AFRICA AGRICULTURE IN ANTIBLOCK ADDITIVE MARKET, BY REGION, 2018-2032, (USD THOUSAND)
TABLE 44 MIDDLE EAST AND AFRICA AGRICULTURE IN ANTIBLOCK ADDITIVE MARKET, BY REGION, 2018-2032 (TONS)
TABLE 45 MIDDLE EAST AND AFRICA AGRICULTURE IN ANTIBLOCK ADDITIVE MARKET, BY FORM, 2018-2032 (USD THOUSAND)
TABLE 46 MIDDLE EAST AND AFRICA AGRICULTURE IN ANTIBLOCK ADDITIVE MARKET, BY FORM, 2018-2032 (TONS)
TABLE 47 MIDDLE EAST AND AFRICA MEDICAL AND HEALTHCARE IN ANTIBLOCK ADDITIVE MARKET, BY REGION, 2018-2032, (USD THOUSAND)
TABLE 48 MIDDLE EAST AND AFRICA MEDICAL AND HEALTHCARE IN ANTIBLOCK ADDITIVE MARKET, BY REGION, 2018-2032 (TONS)
TABLE 49 MIDDLE EAST AND AFRICA MEDICAL AND HEALTHCARE IN ANTIBLOCK ADDITIVE MARKET, BY FORM, 2018-2032 (USD THOUSAND)
TABLE 50 MIDDLE EAST AND AFRICA MEDICAL AND HEALTHCARE IN ANTIBLOCK ADDITIVE MARKET, BY FORM, 2018-2032 (TONS)
TABLE 51 MIDDLE EAST AND AFRICA ELECTRONICS AND SOLAR IN ANTIBLOCK ADDITIVE MARKET, BY REGION, 2018-2032, (USD THOUSAND)
TABLE 52 MIDDLE EAST AND AFRICA ELECTRONICS AND SOLAR IN ANTIBLOCK ADDITIVE MARKET, BY REGION, 2018-2032 (TONS)
TABLE 53 MIDDLE EAST AND AFRICA ELECTRONICS AND SOLAR IN ANTIBLOCK ADDITIVE MARKET, BY TYPE, 2018-2032 (USD THOUSAND)
TABLE 54 MIDDLE EAST AND AFRICA ELECTRONICS AND SOLAR IN ANTIBLOCK ADDITIVE MARKET, BY TYPE, 2018-2032 (TONS)
TABLE 55 MIDDLE EAST AND AFRICA ELECTRONICS AND SOLAR IN ANTIBLOCK ADDITIVE MARKET, BY FORM, 2018-2032 (USD THOUSAND)
TABLE 56 MIDDLE EAST AND AFRICA ELECTRONICS AND SOLAR IN ANTIBLOCK ADDITIVE MARKET, BY FORM, 2018-2032 (TONS)
TABLE 57 MIDDLE EAST AND AFRICA PRINTING AND OPTICS IN ANTIBLOCK ADDITIVE MARKET, BY REGION, 2018-2032, (USD THOUSAND)
TABLE 58 MIDDLE EAST AND AFRICA PRINTING AND OPTICS IN ANTIBLOCK ADDITIVE MARKET, BY REGION, 2018-2032 (TONS)
TABLE 59 MIDDLE EAST AND AFRICA PRINTING AND OPTICS IN ANTIBLOCK ADDITIVE MARKET, BY TYPE, 2018-2032 (USD THOUSAND)
TABLE 60 MIDDLE EAST AND AFRICA PRINTING AND OPTICS IN ANTIBLOCK ADDITIVE MARKET, BY TYPE, 2018-2032 (TONS)
TABLE 61 MIDDLE EAST AND AFRICA PRINTING AND OPTICS IN ANTIBLOCK ADDITIVE MARKET, BY FORM, 2018-2032 (USD THOUSAND)
TABLE 62 MIDDLE EAST AND AFRICA PRINTING AND OPTICS IN ANTIBLOCK ADDITIVE MARKET, BY FORM, 2018-2032 (TONS)
TABLE 63 MIDDLE EAST AND AFRICA OTHERS IN ANTIBLOCK ADDITIVE MARKET, BY REGION, 2018-2032, (USD THOUSAND)
TABLE 64 MIDDLE EAST AND AFRICA OTHERS IN ANTIBLOCK ADDITIVE MARKET, BY REGION, 2018-2032 (TONS)
TABLE 65 MIDDLE EAST AND AFRICA OTHERS IN ANTIBLOCK ADDITIVE MARKET, BY FORM, 2018-2032 (USD THOUSAND)
TABLE 66 MIDDLE EAST AND AFRICA OTHERS IN ANTIBLOCK ADDITIVE MARKET, BY FORM, 2018-2032 (TONS)
TABLE 67 MIDDLE EAST AND AFRICA ANTIBLOCK ADDITIVE MARKET, BY COUNTRY, 2018-2032 (USD THOUSAND)
TABLE 68 MIDDLE EAST AND AFRICA ANTIBLOCK ADDITIVE MARKET, BY COUNTRY, 2018-2032 (TONS)
TABLE 69 MIDDLE EAST AND AFRICA ANTIBLOCK ADDITIVE MARKET, BY FORM, 2018-2032 (USD THOUSAND)
TABLE 70 MIDDLE EAST AND AFRICA ANTIBLOCK ADDITIVE MARKET, BY FORM, 2018-2032 (TONS)
TABLE 71 MIDDLE EAST AND AFRICA INORGANIC IN ANTIBLOCK ADDITIVE MARKET, BY TYPE, 2018-2032 (USD THOUSAND)
TABLE 72 MIDDLE EAST AND AFRICA INORGANIC IN ANTIBLOCK ADDITIVE MARKET, BY TYPE, 2018-2032 (TONS)
TABLE 73 MIDDLE EAST AND AFRICA INORGANIC IN ANTIBLOCK ADDITIVE MARKET, BY PARTICLE SHAPE, 2018-2032 (USD THOUSAND)
TABLE 74 MIDDLE EAST AND AFRICA INORGANIC IN ANTIBLOCK ADDITIVE MARKET, BY PARTICLE SHAPE, 2018-2032 (TONS)
TABLE 75 MIDDLE EAST AND AFRICA ORGANIC IN ANTIBLOCK ADDITIVE MARKET, BY FORM, 2018-2032 (USD THOUSAND)
TABLE 76 MIDDLE EAST AND AFRICA ORGANIC IN ANTIBLOCK ADDITIVE MARKET, BY FORM, 2018-2032 (TONS)
TABLE 77 MIDDLE EAST AND AFRICA ANTIBLOCK ADDITIVE MARKET, BY TARGET POLYMER, 2018-2032 (USD THOUSAND)
TABLE 78 MIDDLE EAST AND AFRICA ANTIBLOCK ADDITIVE MARKET, BY TARGET POLYMER, 2018-2032 (TONS)
TABLE 79 MIDDLE EAST AND AFRICA POLYETHYLENE (PE) IN ANTIBLOCK ADDITIVE MARKET, BY TARGET POLYMER, 2018-2032 (USD THOUSAND)
TABLE 80 MIDDLE EAST AND AFRICA POLYETHYLENE (PE) IN ANTIBLOCK ADDITIVE MARKET, BY TARGET POLYMER, 2018-2032 (TONS)
TABLE 81 MIDDLE EAST AND AFRICA ANTIBLOCK ADDITIVE MARKET, BY END USE INDUSTRY, 2018-2032 (USD THOUSAND)
TABLE 82 MIDDLE EAST AND AFRICA ANTIBLOCK ADDITIVE MARKET, BY END USE INDUSTRY, 2018-2032 (TONS)
TABLE 83 MIDDLE EAST AND AFRICA PACKAGING IN ANTIBLOCK ADDITIVE MARKET, BY TYPE, 2018-2032 (USD THOUSAND)
TABLE 84 MIDDLE EAST AND AFRICA PACKAGING IN ANTIBLOCK ADDITIVE MARKET, BY TYPE, 2018-2032 (TONS)
TABLE 85 MIDDLE EAST AND AFRICA PACKAGING IN ANTIBLOCK ADDITIVE MARKET, BY FORM, 2018-2032 (USD THOUSAND)
TABLE 86 MIDDLE EAST AND AFRICA PACKAGING IN ANTIBLOCK ADDITIVE MARKET, BY FORM, 2018-2032 (TONS)
TABLE 87 MIDDLE EAST AND AFRICA INDUSTRIAL IN ANTIBLOCK ADDITIVE MARKET, BY TYPE, 2018-2032 (USD THOUSAND)
TABLE 88 MIDDLE EAST AND AFRICA INDUSTRIAL IN ANTIBLOCK ADDITIVE MARKET, BY TYPE, 2018-2032 (TONS)
TABLE 89 MIDDLE EAST AND AFRICA INDUSTRIAL IN ANTIBLOCK ADDITIVE MARKET, BY FORM, 2018-2032 (USD THOUSAND)
TABLE 90 MIDDLE EAST AND AFRICA INDUSTRIAL IN ANTIBLOCK ADDITIVE MARKET, BY FORM, 2018-2032 (TONS)
TABLE 91 MIDDLE EAST AND AFRICA AGRICULTURE IN ANTIBLOCK ADDITIVE MARKET, BY FORM, 2018-2032 (USD THOUSAND)
TABLE 92 MIDDLE EAST AND AFRICA AGRICULTURE IN ANTIBLOCK ADDITIVE MARKET, BY FORM, 2018-2032 (TONS)
TABLE 93 MIDDLE EAST AND AFRICA MEDICAL AND HEALTHCARE IN ANTIBLOCK ADDITIVE MARKET, BY FORM, 2018-2032 (USD THOUSAND)
TABLE 94 MIDDLE EAST AND AFRICA MEDICAL AND HEALTHCARE IN ANTIBLOCK ADDITIVE MARKET, BY FORM, 2018-2032 (TONS)
TABLE 95 MIDDLE EAST AND AFRICA ELECTRONICS AND SOLAR IN ANTIBLOCK ADDITIVE MARKET, BY TYPE, 2018-2032 (USD THOUSAND)
TABLE 96 MIDDLE EAST AND AFRICA ELECTRONICS AND SOLAR IN ANTIBLOCK ADDITIVE MARKET, BY TYPE, 2018-2032 (TONS)
TABLE 97 MIDDLE EAST AND AFRICA ELECTRONICS AND SOLAR IN ANTIBLOCK ADDITIVE MARKET, BY FORM, 2018-2032 (USD THOUSAND)
TABLE 98 MIDDLE EAST AND AFRICA ELECTRONICS AND SOLAR IN ANTIBLOCK ADDITIVE MARKET, BY FORM, 2018-2032 (TONS)
TABLE 99 MIDDLE EAST AND AFRICA PRINTING AND OPTICS IN ANTIBLOCK ADDITIVE MARKET, BY TYPE, 2018-2032 (USD THOUSAND)
TABLE 100 MIDDLE EAST AND AFRICA PRINTING AND OPTICS IN ANTIBLOCK ADDITIVE MARKET, BY TYPE, 2018-2032 (TONS)
TABLE 101 MIDDLE EAST AND AFRICA PRINTING AND OPTICS IN ANTIBLOCK ADDITIVE MARKET, BY FORM, 2018-2032 (USD THOUSAND)
TABLE 102 MIDDLE EAST AND AFRICA PRINTING AND OPTICS IN ANTIBLOCK ADDITIVE MARKET, BY FORM, 2018-2032 (TONS)
TABLE 103 MIDDLE EAST AND AFRICA OTHERS IN ANTIBLOCK ADDITIVE MARKET, BY FORM, 2018-2032 (USD THOUSAND)
TABLE 104 MIDDLE EAST AND AFRICA OTHERS IN ANTIBLOCK ADDITIVE MARKET, BY FORM, 2018-2032 (TONS)
TABLE 105 SAUDI ARABIA ANTIBLOCK ADDITIVE MARKET, BY FORM, 2018-2032 (USD THOUSAND)
TABLE 106 SAUDI ARABIA ANTIBLOCK ADDITIVE MARKET, BY FORM, 2018-2032 (TONS)
TABLE 107 SAUDI ARABIA INORGANIC IN ANTIBLOCK ADDITIVE MARKET, BY TYPE, 2018-2032 (USD THOUSAND)
TABLE 108 SAUDI ARABIA INORGANIC IN ANTIBLOCK ADDITIVE MARKET, BY TYPE, 2018-2032 (TONS)
TABLE 109 SAUDI ARABIA INORGANIC IN ANTIBLOCK ADDITIVE MARKET, BY PARTICLE SHAPE, 2018-2032 (USD THOUSAND)
TABLE 110 SAUDI ARABIA INORGANIC IN ANTIBLOCK ADDITIVE MARKET, BY PARTICLE SHAPE, 2018-2032 (TONS)
TABLE 111 SAUDI ARABIA ORGANIC IN ANTIBLOCK ADDITIVE MARKET, BY FORM, 2018-2032 (USD THOUSAND)
TABLE 112 SAUDI ARABIA ORGANIC IN ANTIBLOCK ADDITIVE MARKET, BY FORM, 2018-2032 (TONS)
TABLE 113 SAUDI ARABIA ANTIBLOCK ADDITIVE MARKET, BY TARGET POLYMER, 2018-2032 (USD THOUSAND)
TABLE 114 SAUDI ARABIA ANTIBLOCK ADDITIVE MARKET, BY TARGET POLYMER, 2018-2032 (TONS)
TABLE 115 SAUDI ARABIA POLYETHYLENE (PE) IN ANTIBLOCK ADDITIVE MARKET, BY TARGET POLYMER, 2018-2032 (USD THOUSAND)
TABLE 116 SAUDI ARABIA POLYETHYLENE (PE) IN ANTIBLOCK ADDITIVE MARKET, BY TARGET POLYMER, 2018-2032 (TONS)
TABLE 117 SAUDI ARABIA ANTIBLOCK ADDITIVE MARKET, BY END USE INDUSTRY, 2018-2032 (USD THOUSAND)
TABLE 118 SAUDI ARABIA ANTIBLOCK ADDITIVE MARKET, BY END USE INDUSTRY, 2018-2032 (TONS)
TABLE 119 SAUDI ARABIA PACKAGING IN ANTIBLOCK ADDITIVE MARKET, BY TYPE, 2018-2032 (USD THOUSAND)
TABLE 120 SAUDI ARABIA PACKAGING IN ANTIBLOCK ADDITIVE MARKET, BY TYPE, 2018-2032 (TONS)
TABLE 121 SAUDI ARABIA PACKAGING IN ANTIBLOCK ADDITIVE MARKET, BY FORM, 2018-2032 (USD THOUSAND)
TABLE 122 SAUDI ARABIA PACKAGING IN ANTIBLOCK ADDITIVE MARKET, BY FORM, 2018-2032 (TONS)
TABLE 123 SAUDI ARABIA INDUSTRIAL IN ANTIBLOCK ADDITIVE MARKET, BY TYPE, 2018-2032 (USD THOUSAND)
TABLE 124 SAUDI ARABIA INDUSTRIAL IN ANTIBLOCK ADDITIVE MARKET, BY TYPE, 2018-2032 (TONS)
TABLE 125 SAUDI ARABIA INDUSTRIAL IN ANTIBLOCK ADDITIVE MARKET, BY FORM, 2018-2032 (USD THOUSAND)
TABLE 126 SAUDI ARABIA INDUSTRIAL IN ANTIBLOCK ADDITIVE MARKET, BY FORM, 2018-2032 (TONS)
TABLE 127 SAUDI ARABIA AGRICULTURE IN ANTIBLOCK ADDITIVE MARKET, BY FORM, 2018-2032 (USD THOUSAND)
TABLE 128 SAUDI ARABIA AGRICULTURE IN ANTIBLOCK ADDITIVE MARKET, BY FORM, 2018-2032 (TONS)
TABLE 129 SAUDI ARABIA MEDICAL AND HEALTHCARE IN ANTIBLOCK ADDITIVE MARKET, BY FORM, 2018-2032 (USD THOUSAND)
TABLE 130 SAUDI ARABIA MEDICAL AND HEALTHCARE IN ANTIBLOCK ADDITIVE MARKET, BY FORM, 2018-2032 (TONS)
TABLE 131 SAUDI ARABIA ELECTRONICS AND SOLAR IN ANTIBLOCK ADDITIVE MARKET, BY TYPE, 2018-2032 (USD THOUSAND)
TABLE 132 SAUDI ARABIA ELECTRONICS AND SOLAR IN ANTIBLOCK ADDITIVE MARKET, BY TYPE, 2018-2032 (TONS)
TABLE 133 SAUDI ARABIA ELECTRONICS AND SOLAR IN ANTIBLOCK ADDITIVE MARKET, BY FORM, 2018-2032 (USD THOUSAND)
TABLE 134 SAUDI ARABIA ELECTRONICS AND SOLAR IN ANTIBLOCK ADDITIVE MARKET, BY FORM, 2018-2032 (TONS)
TABLE 135 SAUDI ARABIA PRINTING AND OPTICS IN ANTIBLOCK ADDITIVE MARKET, BY TYPE, 2018-2032 (USD THOUSAND)
TABLE 136 SAUDI ARABIA PRINTING AND OPTICS IN ANTIBLOCK ADDITIVE MARKET, BY TYPE, 2018-2032 (TONS)
TABLE 137 SAUDI ARABIA PRINTING AND OPTICS IN ANTIBLOCK ADDITIVE MARKET, BY FORM, 2018-2032 (USD THOUSAND)
TABLE 138 SAUDI ARABIA PRINTING AND OPTICS IN ANTIBLOCK ADDITIVE MARKET, BY FORM, 2018-2032 (TONS)
TABLE 139 SAUDI ARABIA OTHERS IN ANTIBLOCK ADDITIVE MARKET, BY FORM, 2018-2032 (USD THOUSAND)
TABLE 140 SAUDI ARABIA OTHERS IN ANTIBLOCK ADDITIVE MARKET, BY FORM, 2018-2032 (TONS)
TABLE 141 U.A.E ANTIBLOCK ADDITIVE MARKET, BY FORM, 2018-2032 (USD THOUSAND)
TABLE 142 U.A.E ANTIBLOCK ADDITIVE MARKET, BY FORM, 2018-2032 (TONS)
TABLE 143 U.A.E INORGANIC IN ANTIBLOCK ADDITIVE MARKET, BY TYPE, 2018-2032 (USD THOUSAND)
TABLE 144 U.A.E INORGANIC IN ANTIBLOCK ADDITIVE MARKET, BY TYPE, 2018-2032 (TONS)
TABLE 145 U.A.E INORGANIC IN ANTIBLOCK ADDITIVE MARKET, BY PARTICLE SHAPE, 2018-2032 (USD THOUSAND)
TABLE 146 U.A.E INORGANIC IN ANTIBLOCK ADDITIVE MARKET, BY PARTICLE SHAPE, 2018-2032 (TONS)
TABLE 147 U.A.E ORGANIC IN ANTIBLOCK ADDITIVE MARKET, BY FORM, 2018-2032 (USD THOUSAND)
TABLE 148 U.A.E ORGANIC IN ANTIBLOCK ADDITIVE MARKET, BY FORM, 2018-2032 (TONS)
TABLE 149 U.A.E ANTIBLOCK ADDITIVE MARKET, BY TARGET POLYMER, 2018-2032 (USD THOUSAND)
TABLE 150 U.A.E ANTIBLOCK ADDITIVE MARKET, BY TARGET POLYMER, 2018-2032 (TONS)
TABLE 151 U.A.E POLYETHYLENE (PE) IN ANTIBLOCK ADDITIVE MARKET, BY TARGET POLYMER, 2018-2032 (USD THOUSAND)
TABLE 152 U.A.E POLYETHYLENE (PE) IN ANTIBLOCK ADDITIVE MARKET, BY TARGET POLYMER, 2018-2032 (TONS)
TABLE 153 U.A.E ANTIBLOCK ADDITIVE MARKET, BY END USE INDUSTRY, 2018-2032 (USD THOUSAND)
TABLE 154 U.A.E ANTIBLOCK ADDITIVE MARKET, BY END USE INDUSTRY, 2018-2032 (TONS)
TABLE 155 U.A.E PACKAGING IN ANTIBLOCK ADDITIVE MARKET, BY TYPE, 2018-2032 (USD THOUSAND)
TABLE 156 U.A.E PACKAGING IN ANTIBLOCK ADDITIVE MARKET, BY TYPE, 2018-2032 (TONS)
TABLE 157 U.A.E PACKAGING IN ANTIBLOCK ADDITIVE MARKET, BY FORM, 2018-2032 (USD THOUSAND)
TABLE 158 U.A.E PACKAGING IN ANTIBLOCK ADDITIVE MARKET, BY FORM, 2018-2032 (TONS)
TABLE 159 U.A.E INDUSTRIAL IN ANTIBLOCK ADDITIVE MARKET, BY TYPE, 2018-2032 (USD THOUSAND)
TABLE 160 U.A.E INDUSTRIAL IN ANTIBLOCK ADDITIVE MARKET, BY TYPE, 2018-2032 (TONS)
TABLE 161 U.A.E INDUSTRIAL IN ANTIBLOCK ADDITIVE MARKET, BY FORM, 2018-2032 (USD THOUSAND)
TABLE 162 U.A.E INDUSTRIAL IN ANTIBLOCK ADDITIVE MARKET, BY FORM, 2018-2032 (TONS)
TABLE 163 U.A.E AGRICULTURE IN ANTIBLOCK ADDITIVE MARKET, BY FORM, 2018-2032 (USD THOUSAND)
TABLE 164 U.A.E AGRICULTURE IN ANTIBLOCK ADDITIVE MARKET, BY FORM, 2018-2032 (TONS)
TABLE 165 U.A.E MEDICAL AND HEALTHCARE IN ANTIBLOCK ADDITIVE MARKET, BY FORM, 2018-2032 (USD THOUSAND)
TABLE 166 U.A.E MEDICAL AND HEALTHCARE IN ANTIBLOCK ADDITIVE MARKET, BY FORM, 2018-2032 (TONS)
TABLE 167 U.A.E ELECTRONICS AND SOLAR IN ANTIBLOCK ADDITIVE MARKET, BY TYPE, 2018-2032 (USD THOUSAND)
TABLE 168 U.A.E ELECTRONICS AND SOLAR IN ANTIBLOCK ADDITIVE MARKET, BY TYPE, 2018-2032 (TONS)
TABLE 169 U.A.E ELECTRONICS AND SOLAR IN ANTIBLOCK ADDITIVE MARKET, BY FORM, 2018-2032 (USD THOUSAND)
TABLE 170 U.A.E ELECTRONICS AND SOLAR IN ANTIBLOCK ADDITIVE MARKET, BY FORM, 2018-2032 (TONS)
TABLE 171 U.A.E PRINTING AND OPTICS IN ANTIBLOCK ADDITIVE MARKET, BY TYPE, 2018-2032 (USD THOUSAND)
TABLE 172 U.A.E PRINTING AND OPTICS IN ANTIBLOCK ADDITIVE MARKET, BY TYPE, 2018-2032 (TONS)
TABLE 173 U.A.E PRINTING AND OPTICS IN ANTIBLOCK ADDITIVE MARKET, BY FORM, 2018-2032 (USD THOUSAND)
TABLE 174 U.A.E PRINTING AND OPTICS IN ANTIBLOCK ADDITIVE MARKET, BY FORM, 2018-2032 (TONS)
TABLE 175 U.A.E OTHERS IN ANTIBLOCK ADDITIVE MARKET, BY FORM, 2018-2032 (USD THOUSAND)
TABLE 176 U.A.E OTHERS IN ANTIBLOCK ADDITIVE MARKET, BY FORM, 2018-2032 (TONS)
TABLE 177 SOUTH AFRICA ANTIBLOCK ADDITIVE MARKET, BY FORM, 2018-2032 (USD THOUSAND)
TABLE 178 SOUTH AFRICA ANTIBLOCK ADDITIVE MARKET, BY FORM, 2018-2032 (TONS)
TABLE 179 SOUTH AFRICA INORGANIC IN ANTIBLOCK ADDITIVE MARKET, BY TYPE, 2018-2032 (USD THOUSAND)
TABLE 180 SOUTH AFRICA INORGANIC IN ANTIBLOCK ADDITIVE MARKET, BY TYPE, 2018-2032 (TONS)
TABLE 181 SOUTH AFRICA INORGANIC IN ANTIBLOCK ADDITIVE MARKET, BY PARTICLE SHAPE, 2018-2032 (USD THOUSAND)
TABLE 182 SOUTH AFRICA INORGANIC IN ANTIBLOCK ADDITIVE MARKET, BY PARTICLE SHAPE, 2018-2032 (TONS)
TABLE 183 SOUTH AFRICA ORGANIC IN ANTIBLOCK ADDITIVE MARKET, BY FORM, 2018-2032 (USD THOUSAND)
TABLE 184 SOUTH AFRICA ORGANIC IN ANTIBLOCK ADDITIVE MARKET, BY FORM, 2018-2032 (TONS)
TABLE 185 SOUTH AFRICA ANTIBLOCK ADDITIVE MARKET, BY TARGET POLYMER, 2018-2032 (USD THOUSAND)
TABLE 186 SOUTH AFRICA ANTIBLOCK ADDITIVE MARKET, BY TARGET POLYMER, 2018-2032 (TONS)
TABLE 187 SOUTH AFRICA POLYETHYLENE (PE) IN ANTIBLOCK ADDITIVE MARKET, BY TARGET POLYMER, 2018-2032 (USD THOUSAND)
TABLE 188 SOUTH AFRICA POLYETHYLENE (PE) IN ANTIBLOCK ADDITIVE MARKET, BY TARGET POLYMER, 2018-2032 (TONS)
TABLE 189 SOUTH AFRICA ANTIBLOCK ADDITIVE MARKET, BY END USE INDUSTRY, 2018-2032 (USD THOUSAND)
TABLE 190 SOUTH AFRICA ANTIBLOCK ADDITIVE MARKET, BY END USE INDUSTRY, 2018-2032 (TONS)
TABLE 191 SOUTH AFRICA PACKAGING IN ANTIBLOCK ADDITIVE MARKET, BY TYPE, 2018-2032 (USD THOUSAND)
TABLE 192 SOUTH AFRICA PACKAGING IN ANTIBLOCK ADDITIVE MARKET, BY TYPE, 2018-2032 (TONS)
TABLE 193 SOUTH AFRICA PACKAGING IN ANTIBLOCK ADDITIVE MARKET, BY FORM, 2018-2032 (USD THOUSAND)
TABLE 194 SOUTH AFRICA PACKAGING IN ANTIBLOCK ADDITIVE MARKET, BY FORM, 2018-2032 (TONS)
TABLE 195 SOUTH AFRICA INDUSTRIAL IN ANTIBLOCK ADDITIVE MARKET, BY TYPE, 2018-2032 (USD THOUSAND)
TABLE 196 SOUTH AFRICA INDUSTRIAL IN ANTIBLOCK ADDITIVE MARKET, BY TYPE, 2018-2032 (TONS)
TABLE 197 SOUTH AFRICA INDUSTRIAL IN ANTIBLOCK ADDITIVE MARKET, BY FORM, 2018-2032 (USD THOUSAND)
TABLE 198 SOUTH AFRICA INDUSTRIAL IN ANTIBLOCK ADDITIVE MARKET, BY FORM, 2018-2032 (TONS)
TABLE 199 SOUTH AFRICA AGRICULTURE IN ANTIBLOCK ADDITIVE MARKET, BY FORM, 2018-2032 (USD THOUSAND)
TABLE 200 SOUTH AFRICA AGRICULTURE IN ANTIBLOCK ADDITIVE MARKET, BY FORM, 2018-2032 (TONS)
TABLE 201 SOUTH AFRICA MEDICAL AND HEALTHCARE IN ANTIBLOCK ADDITIVE MARKET, BY FORM, 2018-2032 (USD THOUSAND)
TABLE 202 SOUTH AFRICA MEDICAL AND HEALTHCARE IN ANTIBLOCK ADDITIVE MARKET, BY FORM, 2018-2032 (TONS)
TABLE 203 SOUTH AFRICA ELECTRONICS AND SOLAR IN ANTIBLOCK ADDITIVE MARKET, BY TYPE, 2018-2032 (USD THOUSAND)
TABLE 204 SOUTH AFRICA ELECTRONICS AND SOLAR IN ANTIBLOCK ADDITIVE MARKET, BY TYPE, 2018-2032 (TONS)
TABLE 205 SOUTH AFRICA ELECTRONICS AND SOLAR IN ANTIBLOCK ADDITIVE MARKET, BY FORM, 2018-2032 (USD THOUSAND)
TABLE 206 SOUTH AFRICA ELECTRONICS AND SOLAR IN ANTIBLOCK ADDITIVE MARKET, BY FORM, 2018-2032 (TONS)
TABLE 207 SOUTH AFRICA PRINTING AND OPTICS IN ANTIBLOCK ADDITIVE MARKET, BY TYPE, 2018-2032 (USD THOUSAND)
TABLE 208 SOUTH AFRICA PRINTING AND OPTICS IN ANTIBLOCK ADDITIVE MARKET, BY TYPE, 2018-2032 (TONS)
TABLE 209 SOUTH AFRICA PRINTING AND OPTICS IN ANTIBLOCK ADDITIVE MARKET, BY FORM, 2018-2032 (USD THOUSAND)
TABLE 210 SOUTH AFRICA PRINTING AND OPTICS IN ANTIBLOCK ADDITIVE MARKET, BY FORM, 2018-2032 (TONS)
TABLE 211 SOUTH AFRICA OTHERS IN ANTIBLOCK ADDITIVE MARKET, BY FORM, 2018-2032 (USD THOUSAND)
TABLE 212 SOUTH AFRICA OTHERS IN ANTIBLOCK ADDITIVE MARKET, BY FORM, 2018-2032 (TONS)
TABLE 213 EGYPT ANTIBLOCK ADDITIVE MARKET, BY FORM, 2018-2032 (USD THOUSAND)
TABLE 214 EGYPT ANTIBLOCK ADDITIVE MARKET, BY FORM, 2018-2032 (TONS)
TABLE 215 EGYPT INORGANIC IN ANTIBLOCK ADDITIVE MARKET, BY TYPE, 2018-2032 (USD THOUSAND)
TABLE 216 EGYPT INORGANIC IN ANTIBLOCK ADDITIVE MARKET, BY TYPE, 2018-2032 (TONS)
TABLE 217 EGYPT INORGANIC IN ANTIBLOCK ADDITIVE MARKET, BY PARTICLE SHAPE, 2018-2032 (USD THOUSAND)
TABLE 218 EGYPT INORGANIC IN ANTIBLOCK ADDITIVE MARKET, BY PARTICLE SHAPE, 2018-2032 (TONS)
TABLE 219 EGYPT ORGANIC IN ANTIBLOCK ADDITIVE MARKET, BY FORM, 2018-2032 (USD THOUSAND)
TABLE 220 EGYPT ORGANIC IN ANTIBLOCK ADDITIVE MARKET, BY FORM, 2018-2032 (TONS)
TABLE 221 EGYPT ANTIBLOCK ADDITIVE MARKET, BY TARGET POLYMER, 2018-2032 (USD THOUSAND)
TABLE 222 EGYPT ANTIBLOCK ADDITIVE MARKET, BY TARGET POLYMER, 2018-2032 (TONS)
TABLE 223 EGYPT POLYETHYLENE (PE) IN ANTIBLOCK ADDITIVE MARKET, BY TARGET POLYMER, 2018-2032 (USD THOUSAND)
TABLE 224 EGYPT POLYETHYLENE (PE) IN ANTIBLOCK ADDITIVE MARKET, BY TARGET POLYMER, 2018-2032 (TONS)
TABLE 225 EGYPT ANTIBLOCK ADDITIVE MARKET, BY END USE INDUSTRY, 2018-2032 (USD THOUSAND)
TABLE 226 EGYPT ANTIBLOCK ADDITIVE MARKET, BY END USE INDUSTRY, 2018-2032 (TONS)
TABLE 227 EGYPT PACKAGING IN ANTIBLOCK ADDITIVE MARKET, BY TYPE, 2018-2032 (USD THOUSAND)
TABLE 228 EGYPT PACKAGING IN ANTIBLOCK ADDITIVE MARKET, BY TYPE, 2018-2032 (TONS)
TABLE 229 EGYPT PACKAGING IN ANTIBLOCK ADDITIVE MARKET, BY FORM, 2018-2032 (USD THOUSAND)
TABLE 230 EGYPT PACKAGING IN ANTIBLOCK ADDITIVE MARKET, BY FORM, 2018-2032 (TONS)
TABLE 231 EGYPT INDUSTRIAL IN ANTIBLOCK ADDITIVE MARKET, BY TYPE, 2018-2032 (USD THOUSAND)
TABLE 232 EGYPT INDUSTRIAL IN ANTIBLOCK ADDITIVE MARKET, BY TYPE, 2018-2032 (TONS)
TABLE 233 EGYPT INDUSTRIAL IN ANTIBLOCK ADDITIVE MARKET, BY FORM, 2018-2032 (USD THOUSAND)
TABLE 234 EGYPT INDUSTRIAL IN ANTIBLOCK ADDITIVE MARKET, BY FORM, 2018-2032 (TONS)
TABLE 235 EGYPT AGRICULTURE IN ANTIBLOCK ADDITIVE MARKET, BY FORM, 2018-2032 (USD THOUSAND)
TABLE 236 EGYPT AGRICULTURE IN ANTIBLOCK ADDITIVE MARKET, BY FORM, 2018-2032 (TONS)
TABLE 237 EGYPT MEDICAL AND HEALTHCARE IN ANTIBLOCK ADDITIVE MARKET, BY FORM, 2018-2032 (USD THOUSAND)
TABLE 238 EGYPT MEDICAL AND HEALTHCARE IN ANTIBLOCK ADDITIVE MARKET, BY FORM, 2018-2032 (TONS)
TABLE 239 EGYPT ELECTRONICS AND SOLAR IN ANTIBLOCK ADDITIVE MARKET, BY TYPE, 2018-2032 (USD THOUSAND)
TABLE 240 EGYPT ELECTRONICS AND SOLAR IN ANTIBLOCK ADDITIVE MARKET, BY TYPE, 2018-2032 (TONS)
TABLE 241 EGYPT ELECTRONICS AND SOLAR IN ANTIBLOCK ADDITIVE MARKET, BY FORM, 2018-2032 (USD THOUSAND)
TABLE 242 EGYPT ELECTRONICS AND SOLAR IN ANTIBLOCK ADDITIVE MARKET, BY FORM, 2018-2032 (TONS)
TABLE 243 EGYPT PRINTING AND OPTICS IN ANTIBLOCK ADDITIVE MARKET, BY TYPE, 2018-2032 (USD THOUSAND)
TABLE 244 EGYPT PRINTING AND OPTICS IN ANTIBLOCK ADDITIVE MARKET, BY TYPE, 2018-2032 (TONS)
TABLE 245 EGYPT PRINTING AND OPTICS IN ANTIBLOCK ADDITIVE MARKET, BY FORM, 2018-2032 (USD THOUSAND)
TABLE 246 EGYPT PRINTING AND OPTICS IN ANTIBLOCK ADDITIVE MARKET, BY FORM, 2018-2032 (TONS)
TABLE 247 EGYPT OTHERS IN ANTIBLOCK ADDITIVE MARKET, BY FORM, 2018-2032 (USD THOUSAND)
TABLE 248 EGYPT OTHERS IN ANTIBLOCK ADDITIVE MARKET, BY FORM, 2018-2032 (TONS)
TABLE 249 ISRAEL ANTIBLOCK ADDITIVE MARKET, BY FORM, 2018-2032 (USD THOUSAND)
TABLE 250 ISRAEL ANTIBLOCK ADDITIVE MARKET, BY FORM, 2018-2032 (TONS)
TABLE 251 ISRAEL INORGANIC IN ANTIBLOCK ADDITIVE MARKET, BY TYPE, 2018-2032 (USD THOUSAND)
TABLE 252 ISRAEL INORGANIC IN ANTIBLOCK ADDITIVE MARKET, BY TYPE, 2018-2032 (TONS)
TABLE 253 ISRAEL INORGANIC IN ANTIBLOCK ADDITIVE MARKET, BY PARTICLE SHAPE, 2018-2032 (USD THOUSAND)
TABLE 254 ISRAEL INORGANIC IN ANTIBLOCK ADDITIVE MARKET, BY PARTICLE SHAPE, 2018-2032 (TONS)
TABLE 255 ISRAEL ORGANIC IN ANTIBLOCK ADDITIVE MARKET, BY FORM, 2018-2032 (USD THOUSAND)
TABLE 256 ISRAEL ORGANIC IN ANTIBLOCK ADDITIVE MARKET, BY FORM, 2018-2032 (TONS)
TABLE 257 ISRAEL ANTIBLOCK ADDITIVE MARKET, BY TARGET POLYMER, 2018-2032 (USD THOUSAND)
TABLE 258 ISRAEL ANTIBLOCK ADDITIVE MARKET, BY TARGET POLYMER, 2018-2032 (TONS)
TABLE 259 ISRAEL POLYETHYLENE (PE) IN ANTIBLOCK ADDITIVE MARKET, BY TARGET POLYMER, 2018-2032 (USD THOUSAND)
TABLE 260 ISRAEL POLYETHYLENE (PE) IN ANTIBLOCK ADDITIVE MARKET, BY TARGET POLYMER, 2018-2032 (TONS)
TABLE 261 ISRAEL ANTIBLOCK ADDITIVE MARKET, BY END USE INDUSTRY, 2018-2032 (USD THOUSAND)
TABLE 262 ISRAEL ANTIBLOCK ADDITIVE MARKET, BY END USE INDUSTRY, 2018-2032 (TONS)
TABLE 263 ISRAEL PACKAGING IN ANTIBLOCK ADDITIVE MARKET, BY TYPE, 2018-2032 (USD THOUSAND)
TABLE 264 ISRAEL PACKAGING IN ANTIBLOCK ADDITIVE MARKET, BY TYPE, 2018-2032 (TONS)
TABLE 265 ISRAEL PACKAGING IN ANTIBLOCK ADDITIVE MARKET, BY FORM, 2018-2032 (USD THOUSAND)
TABLE 266 ISRAEL PACKAGING IN ANTIBLOCK ADDITIVE MARKET, BY FORM, 2018-2032 (TONS)
TABLE 267 ISRAEL INDUSTRIAL IN ANTIBLOCK ADDITIVE MARKET, BY TYPE, 2018-2032 (USD THOUSAND)
TABLE 268 ISRAEL INDUSTRIAL IN ANTIBLOCK ADDITIVE MARKET, BY TYPE, 2018-2032 (TONS)
TABLE 269 ISRAEL INDUSTRIAL IN ANTIBLOCK ADDITIVE MARKET, BY FORM, 2018-2032 (USD THOUSAND)
TABLE 270 ISRAEL INDUSTRIAL IN ANTIBLOCK ADDITIVE MARKET, BY FORM, 2018-2032 (TONS)
TABLE 271 ISRAEL AGRICULTURE IN ANTIBLOCK ADDITIVE MARKET, BY FORM, 2018-2032 (USD THOUSAND)
TABLE 272 ISRAEL AGRICULTURE IN ANTIBLOCK ADDITIVE MARKET, BY FORM, 2018-2032 (TONS)
TABLE 273 ISRAEL MEDICAL AND HEALTHCARE IN ANTIBLOCK ADDITIVE MARKET, BY FORM, 2018-2032 (USD THOUSAND)
TABLE 274 ISRAEL MEDICAL AND HEALTHCARE IN ANTIBLOCK ADDITIVE MARKET, BY FORM, 2018-2032 (TONS)
TABLE 275 ISRAEL ELECTRONICS AND SOLAR IN ANTIBLOCK ADDITIVE MARKET, BY TYPE, 2018-2032 (USD THOUSAND)
TABLE 276 ISRAEL ELECTRONICS AND SOLAR IN ANTIBLOCK ADDITIVE MARKET, BY TYPE, 2018-2032 (TONS)
TABLE 277 ISRAEL ELECTRONICS AND SOLAR IN ANTIBLOCK ADDITIVE MARKET, BY FORM, 2018-2032 (USD THOUSAND)
TABLE 278 ISRAEL ELECTRONICS AND SOLAR IN ANTIBLOCK ADDITIVE MARKET, BY FORM, 2018-2032 (TONS)
TABLE 279 ISRAEL PRINTING AND OPTICS IN ANTIBLOCK ADDITIVE MARKET, BY TYPE, 2018-2032 (USD THOUSAND)
TABLE 280 ISRAEL PRINTING AND OPTICS IN ANTIBLOCK ADDITIVE MARKET, BY TYPE, 2018-2032 (TONS)
TABLE 281 ISRAEL PRINTING AND OPTICS IN ANTIBLOCK ADDITIVE MARKET, BY FORM, 2018-2032 (USD THOUSAND)
TABLE 282 ISRAEL PRINTING AND OPTICS IN ANTIBLOCK ADDITIVE MARKET, BY FORM, 2018-2032 (TONS)
TABLE 283 ISRAEL OTHERS IN ANTIBLOCK ADDITIVE MARKET, BY FORM, 2018-2032 (USD THOUSAND)
TABLE 284 ISRAEL OTHERS IN ANTIBLOCK ADDITIVE MARKET, BY FORM, 2018-2032 (TONS)
TABLE 285 REST OF MIDDLE EAST AND AFRICA ANTIBLOCK ADDITIVE MARKET, BY FORM, 2018-2032 (USD THOUSAND)
TABLE 286 REST OF MIDDLE EAST AND AFRICA ANTIBLOCK ADDITIVE MARKET, BY FORM, 2018-2032 (TONS)
List of Figure
FIGURE 1 MIDDLE EAST AND AFRICA ANTIBLOCK ADDITIVE MARKET
FIGURE 2 MIDDLE EAST AND AFRICA ANTIBLOCK ADDITIVE MARKET: DATA TRIANGULATION
FIGURE 3 MIDDLE EAST AND AFRICA ANTIBLOCK ADDITIVE MARKET: DROC ANALYSIS
FIGURE 4 MIDDLE EAST AND AFRICA ANTIBLOCK ADDITIVE MARKET: REGIONAL MARKET ANALYSIS
FIGURE 5 MIDDLE EAST AND AFRICA ANTIBLOCK ADDITIVE MARKET: COMPANY RESEARCH ANALYSIS
FIGURE 6 MIDDLE EAST AND AFRICA ANTIBLOCK ADDITIVE MARKET: MULTIVARIATE MODELLING
FIGURE 7 MIDDLE EAST AND AFRICA ANTIBLOCK ADDITIVE MARKET: INTERVIEW DEMOGRAPHICS
FIGURE 8 MIDDLE EAST AND AFRICA ANTIBLOCK ADDITIVE MARKET: DBMR MARKET POSITION GRID
FIGURE 9 MIDDLE EAST AND AFRICA ANTIBLOCK ADDITIVE MARKET: VENDOR SHARE ANALYSIS
FIGURE 10 MIDDLE EAST AND AFRICA ANTIBLOCK ADDITIVE MARKET: SEGMENTATION
FIGURE 11 TWO SEGMENTS COMPRISE THE MIDDLE EAST AND AFRICA ANTIBLOCK ADDITIVE MARKET, BY FORM (2024)
FIGURE 12 MIDDLE EAST AND AFRICA ANTIBLOCK ADDITIVE MARKET: EXECUTIVE SUMMARY
FIGURE 13 MIDDLE EAST AND AFRICA ANTIBLOCK ADDITIVE MARKET: STRATEGIC DECISIONS
FIGURE 14 GROWING DEMAND FOR PLASTIC PACKAGING MIDDLE EAST AND AFRICA LY IS EXPECTED TO DRIVE THE MIDDLE EAST AND AFRICA ANTIBLOCK ADDITIVE MARKET IN THE FORECAST PERIOD (2025-2032)
FIGURE 15 THE INORGANIC SEGMENT IS EXPECTED TO ACCOUNT FOR THE LARGEST SHARE OF THE MIDDLE EAST AND AFRICA ANTIBLOCK ADDITIVE MARKET IN 2025 AND 2032
FIGURE 16 PESTEL ANALYSIS
FIGURE 17 PORTER’S FIVE FORCES ANALYSIS
FIGURE 18 VENDOR SELECTION CRITERIA
FIGURE 19 DRIVERS, RESTRAINTS, OPPORTUNITIES, AND CHALLENGES FOR MIDDLE EAST AND AFRICA ANTIBLOCK ADDITIVE MARKET
FIGURE 20 MIDDLE EAST AND AFRICA ANTIBLOCK ADDITIVE MARKET: BY FORM, 2024
FIGURE 21 MIDDLE EAST AND AFRICA ANTIBLOCK ADDITIVE MARKET: BY TARGET POLYMER, 2024
FIGURE 22 MIDDLE EAST AND AFRICA ANTIBLOCK ADDITIVE MARKET: BY END USE INDUSTRY, 2024
FIGURE 23 MIDDLE EAST AND AFRICA ANTIBLOCK ADDITIVE MARKET: SNAPSHOT (2024)
FIGURE 24 MIDDLE EAST AND AFRICA ANTIBLOCK ADDITIVE MARKET: COMPANY SHARE 2024 (%)
Middle East And Africa Antiblock Additive Market, Supply Chain Analysis and Ecosystem Framework
To support market growth and help clients navigate the impact of geopolitical shifts, DBMR has integrated in-depth supply chain analysis into its Middle East And Africa Antiblock Additive Market research reports. This addition empowers clients to respond effectively to global changes affecting their industries. The supply chain analysis section includes detailed insights such as Middle East And Africa Antiblock Additive Market consumption and production by country, price trend analysis, the impact of tariffs and geopolitical developments, and import and export trends by country and HSN code. It also highlights major suppliers with data on production capacity and company profiles, as well as key importers and exporters. In addition to research, DBMR offers specialized supply chain consulting services backed by over a decade of experience, providing solutions like supplier discovery, supplier risk assessment, price trend analysis, impact evaluation of inflation and trade route changes, and comprehensive market trend analysis.
Data collection and base year analysis are done using data collection modules with large sample sizes. The stage includes obtaining market information or related data through various sources and strategies. It includes examining and planning all the data acquired from the past in advance. It likewise envelops the examination of information inconsistencies seen across different information sources. The market data is analysed and estimated using market statistical and coherent models. Also, market share analysis and key trend analysis are the major success factors in the market report. To know more, please request an analyst call or drop down your inquiry.
The key research methodology used by DBMR research team is data triangulation which involves data mining, analysis of the impact of data variables on the market and primary (industry expert) validation. Data models include Vendor Positioning Grid, Market Time Line Analysis, Market Overview and Guide, Company Positioning Grid, Patent Analysis, Pricing Analysis, Company Market Share Analysis, Standards of Measurement, Global versus Regional and Vendor Share Analysis. To know more about the research methodology, drop in an inquiry to speak to our industry experts.
Data Bridge Market Research is a leader in advanced formative research. We take pride in servicing our existing and new customers with data and analysis that match and suits their goal. The report can be customized to include price trend analysis of target brands understanding the market for additional countries (ask for the list of countries), clinical trial results data, literature review, refurbished market and product base analysis. Market analysis of target competitors can be analyzed from technology-based analysis to market portfolio strategies. We can add as many competitors that you require data about in the format and data style you are looking for. Our team of analysts can also provide you data in crude raw excel files pivot tables (Fact book) or can assist you in creating presentations from the data sets available in the report.


