
Middle East And Africa Api Intermediates Market
Market Size in USD Million
 USD
966.78 Million
USD
1,461.35 Million
2024
2032
USD
966.78 Million
USD
1,461.35 Million
2024
2032
| 2025 - 2032 | |
| USD 966.78 Million | |
| USD 1,461.35 Million | |
| % | |
|
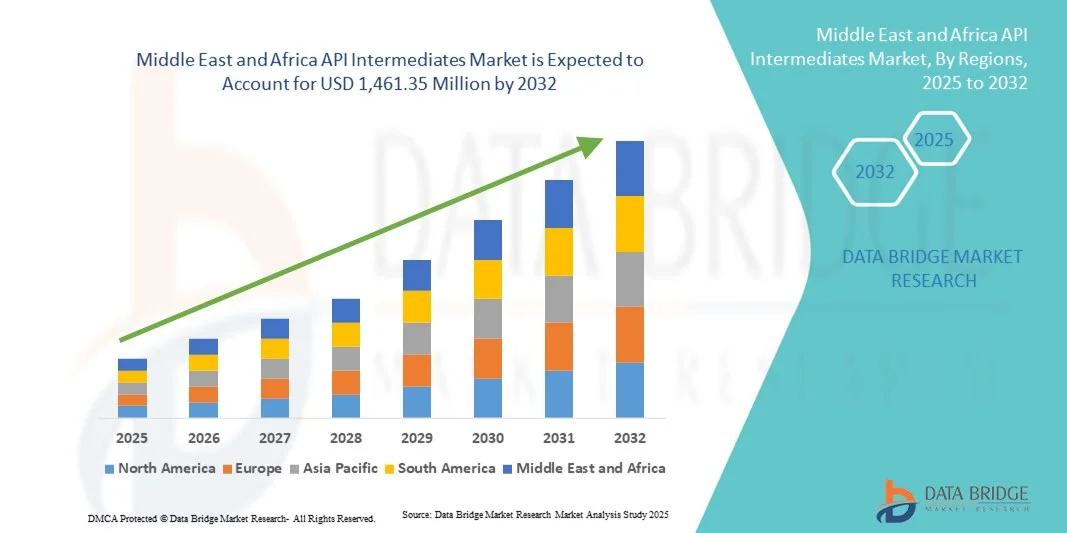
Middle East and Africa API Intermediates Market Size
- The Middle East and Africa API intermediates market size was valued at USD 966.78 million in 2024 and is expected to reach USD 1,461.35 million by 2032, at a CAGR of 5.3% during the forecast period
- The market growth is largely fueled by the increasing demand for both generic and innovative APIs, driven by the rising prevalence of chronic diseases such as diabetes, cardiovascular conditions, and cancer across the region
- Furthermore, expanding healthcare infrastructure, strategic initiatives by local manufacturers to enhance production capabilities, and favorable regulatory environments are establishing the MEA region as a growing hub for API production. These converging factors are accelerating the uptake of advanced API intermediates, thereby significantly boosting the industry's growth
Middle East and Africa API Intermediates Market Analysis
- API intermediates, serving as key building blocks in the manufacture of active pharmaceutical ingredients, are increasingly vital components of pharmaceutical production in both generic and innovative drug segments across the Middle East and Africa due to their role in ensuring high-quality, cost-effective, and scalable drug synthesis
- The escalating demand for API intermediates is primarily fueled by the rising prevalence of chronic and lifestyle-related diseases, growing pharmaceutical manufacturing capacities, and a shift towards locally produced intermediates to reduce dependence on imports
- Egypt dominated the Middle East and Africa API intermediates market with the largest revenue share of 38% in 2024, characterized by expanding pharmaceutical manufacturing infrastructure, government initiatives supporting local production, and the presence of established contract manufacturing organizations, with substantial growth in veterinary and pharmaceutical drug intermediates, particularly for cardiovascular and metabolic disease therapies
- South Africa is expected to be the fastest growing country in the Middle East and Africa API intermediates market during the forecast period due to increasing healthcare investments, rising access to modern medical facilities, and growing adoption of advanced intermediates such as Bromo Compounds, Oxirane, and Pheniramine Base
- Bulk Drug Intermediates dominated the Middle East and Africa API intermediates market with a market share of 48.2% in 2024, driven by high demand from API manufacturers and finished product manufacturers, alongside distribution via direct tenders and retail sales channels
Report Scope and Middle East and Africa API Intermediates Market Segmentation
|
Attributes |
Middle East and Africa API Intermediates Key Market Insights |
|
Segments Covered |
|
|
Countries Covered |
Middle East and Africa
|
|
Key Market Players |
|
|
Market Opportunities |
|
|
Value Added Data Infosets |
In addition to the insights on market scenarios such as market value, growth rate, segmentation, geographical coverage, and major players, the market reports curated by the Data Bridge Market Research also include in-depth expert analysis, patient epidemiology, pipeline analysis, pricing analysis, and regulatory framework |
Middle East and Africa API Intermediates Market Trends
Rising Demand for Specialized and High-Potency Intermediates
- A significant and accelerating trend in the MEA API intermediates market is the increasing production and adoption of specialized intermediates for high-potency and targeted therapies, enhancing drug efficacy and safety
- For instance, companies in Egypt are developing advanced oncology and cardiovascular drug intermediates to cater to rising local and regional demand, ensuring higher quality and regulatory compliance
- Adoption of cutting-edge synthesis technologies, including chiral intermediates and complex chemical compounds, is enabling manufacturers to meet the needs of both generic and innovative pharmaceutical sectors
- The integration of contract manufacturing services with API production allows centralized control over quality, supply chain, and cost-efficiency, creating a more streamlined production process
- This trend toward high-value, specialized intermediates is driving investment in R&D, facility upgrades, and collaborations with global pharmaceutical players to remain competitive
- The demand for advanced API intermediates is growing across both pharmaceutical and veterinary drug segments, as manufacturers prioritize high-potency, cost-effective, and regulatory-compliant solutions
- Expansion of digital tools for process monitoring, quality control, and predictive maintenance is improving production efficiency and reducing operational risks across manufacturing plants
- Increasing partnerships between MEA manufacturers and international pharmaceutical companies are enabling technology transfer, capacity building, and access to new markets
Middle East and Africa API Intermediates Market Dynamics
Driver
Increasing Pharmaceutical Manufacturing and Chronic Disease Prevalence
- The rising prevalence of chronic diseases such as cardiovascular, metabolic, and infectious diseases, coupled with expanding pharmaceutical manufacturing capacities, is a key driver for API intermediates demand
- For instance, South Africa has witnessed growth in domestic API production to cater to local healthcare needs, reducing reliance on imports and supporting regional pharmaceutical supply chains
- Governments and private companies are investing in modern production facilities and adopting GMP-compliant processes to ensure consistent quality and meet international standards
- Growing awareness among healthcare providers and patients is increasing demand for high-quality drugs, which in turn drives the need for reliable and scalable API intermediates
- The expansion of local pharmaceutical infrastructure and rising investment in biotechnology and contract manufacturing organizations are enhancing production capabilities across the region. The convergence of chronic disease prevalence, improved manufacturing infrastructure, and government incentives is significantly accelerating market growth
- Rising government initiatives to promote local API production and reduce import dependency are providing additional incentives for investment in manufacturing facilities
- Increased focus on sustainability and green chemistry in API synthesis is encouraging manufacturers to adopt eco-friendly processes, enhancing competitiveness and regulatory compliance
Restraint/Challenge
Regulatory Complexity and Raw Material Dependence
- Regulatory compliance and adherence to strict international quality standards pose a significant challenge for API intermediates manufacturers in the MEA region. For instance, delays in approvals from health authorities in Egypt and Morocco can disrupt production schedules and limit market access for new intermediates
- Dependence on imported raw materials, particularly from Asia, exposes manufacturers to supply chain disruptions and cost fluctuations, affecting production continuity
- Smaller manufacturers may struggle with the capital-intensive requirements of modern API facilities, limiting their ability to scale or adopt advanced synthesis technologies
- While regional initiatives aim to support local production, navigating multi-country regulations and harmonizing standards remains complex and resource-intensive
- Overcoming these challenges through regulatory harmonization, local raw material sourcing, and strategic partnerships will be crucial for sustainable market expansion
- Variability in regional infrastructure, including logistics and storage capabilities, can hinder timely delivery of intermediates to end users
- Limited skilled workforce in advanced chemical synthesis and quality control is constraining production efficiency and innovation in certain MEA countries
Middle East and Africa API Intermediates Market Scope
The market is segmented on the basis of type, product, therapeutic type, customers, end user, and distribution channel.
- By Type
On the basis of type, the MEA API intermediates market is segmented into veterinary drug intermediates pharmaceutical and bulk drug intermediates. The Bulk Drug Intermediates segment dominated the market with the largest revenue share of 48.2% in 2024. This dominance is due to high demand for generic and specialty APIs used in chronic disease treatment, including cardiovascular, metabolic, and infectious diseases. Manufacturers prefer bulk intermediates for cost efficiency and ease of integration into finished formulations. Countries such as Egypt and South Africa are expanding production capabilities to meet both domestic and export demand. Government incentives, regulatory compliance, and well-established supply chains reinforce its market position. Continuous prevalence of chronic diseases ensures sustained demand for these intermediates over the forecast period.
The Veterinary Drug Intermediates segment is expected to witness the fastest CAGR of 22% from 2025 to 2032. Growth is driven by increasing livestock populations and rising awareness of animal health. Local governments and private companies are boosting veterinary drug manufacturing to ensure safe and effective products. Export opportunities to neighboring regions further support the growth. The adoption of high-quality veterinary intermediates by domestic manufacturers is increasing, meeting regulatory and safety standards. Overall, the segment is benefiting from rising investment in regional animal healthcare infrastructure.
- By Product
On the basis of product, the market is segmented into Bromo Compound, O-Benzyl Salbutamol, Hemisulfate, Oxirane, Bisoprolol Base, Chiral PCBHP, Pheniramine Base, Chlorpheniramine Base, Brompheniramine Base, Mepyramine/Pyrilamine Base, 6-Amino-1,3-Dimethyl Uracil, Theofylline, Acefylline, Xanthine, Nitriles, and Others. The Bromo Compound segment dominated the market in 2024 due to its wide use in cardiovascular, respiratory, and antiviral drug synthesis. Its high demand is driven by compatibility with both bulk drug production and pharmaceutical intermediates. Manufacturers in Egypt and South Africa focus on producing high-purity Bromo Compounds meeting GMP standards. The segment benefits from scalable synthesis, cost efficiency, and high regulatory compliance. Long-term contracts with pharmaceutical companies reinforce its market position. Sustained investment in R&D ensures continuous innovation and quality improvements.
The Oxirane segment is expected to witness the fastest growth during the forecast period. Its growth is fueled by increasing use in specialty drug synthesis, especially in metabolic and oncology therapies. Oxirane intermediates offer chemical versatility for complex API production. Strategic partnerships with international pharma companies accelerate adoption in MEA manufacturing hubs. Local investments in advanced production technologies improve yield and quality. Rising healthcare infrastructure and demand for targeted therapies are key drivers of this growth segment.
- By Therapeutic Type
On the basis of therapeutic type, the market is segmented into autoimmune diseases, oncology, metabolic diseases, ophthalmology, cardiovascular diseases, infectious diseases, neurology, respiratory disorders, dermatology, urology, and others. The Cardiovascular Diseases segment dominated the market with a 35% share in 2024. This dominance is driven by the high prevalence of cardiovascular conditions across MEA countries. API intermediates for cardiovascular drugs are in strong demand due to ongoing patient needs and production of generics. High-purity intermediates ensure safety, efficacy, and regulatory compliance. Collaboration between local manufacturers and global pharma strengthens market presence. Government initiatives supporting chronic disease treatment further reinforce dominance.
The Oncology segment is expected to witness the fastest CAGR of 20% from 2025 to 2032. Rising cancer prevalence and demand for targeted therapies fuel this growth. Oncology intermediates are highly specialized, including high-potency APIs and chiral compounds. Investments in production technologies and infrastructure support the expansion. Partnerships with multinational companies facilitate technology transfer. Regional healthcare development initiatives also enhance market adoption of oncology intermediates.
- By Customers
On the basis of customers, the market is segmented into direct users/pharma companies, traders/wholesalers/distributors, and associations/govt. institutions/pvt institutions. The Direct Users/Pharma Companies segment dominated the market in 2024 due to their steady demand for high-quality intermediates for in-house drug manufacturing. Bulk procurement ensures uninterrupted production and cost efficiency. Local pharma companies in Egypt, Morocco, and South Africa secure supply chains through long-term agreements. Regulatory compliance and quality assurance are key priorities. The segment benefits from strong relationships with API manufacturers. Continuous chronic disease prevalence ensures ongoing demand.
The Traders/Wholesalers/Distributors segment is expected to witness the fastest growth from 2025 to 2032. Growth is driven by intermediaries bridging supply-demand gaps across the region. Small and medium pharma companies rely on them for access to quality intermediates. They help manage logistics, documentation, and quality assurance. Rising export opportunities to neighboring countries further support their role. The segment benefits from increasing regional access and demand for specialized intermediates.
- By End User
On the basis of end user, the market is segmented into API Manufacturer and Finished Product Manufacturer. The API Manufacturer segment dominated the market with a 55% revenue share in 2024. High demand for intermediates in large-scale API synthesis ensures consistent growth. Manufacturers focus on bulk drugs and specialty APIs while maintaining GMP and regulatory compliance. Investments in high-capacity plants and R&D reinforce dominance. Partnerships with global pharma companies enhance technological capabilities. Regional demand for cardiovascular and metabolic drug intermediates further supports the segment.
The Finished Product Manufacturer segment is expected to witness the fastest growth from 2025 to 2032. Growth is driven by domestic pharma companies producing finished dosage forms. Specialized intermediates for oncology, metabolic, and respiratory drugs are increasingly sourced locally. Expanding healthcare infrastructure supports production. Regional manufacturers focus on quality, cost, and regulatory compliance. Collaboration with API suppliers enhances access to high-potency intermediates.
- By Distribution Channel
On the basis of distribution channel, the market is segmented into direct tender, retail sales, and others. The Direct Tender segment dominated the market with a 50% share in 2024. Long-term contracts with pharmaceutical and veterinary drug companies ensure consistent supply. Tenders provide cost efficiency, predictable delivery, and quality assurance. Large-scale buyers prefer this channel for bulk procurement. Government procurement initiatives reinforce market dominance. High-value intermediates benefit from direct tender agreements to maintain supply chain stability.
The Retail Sales segment is expected to witness the fastest growth from 2025 to 2032. Small pharma companies, veterinary manufacturers, and private hospitals increasingly procure intermediates via retail channels. Ease of transactions and access to specialized intermediates drive growth. Regional distributors play a key role in facilitating availability. Expanding export opportunities support retail sales. Rising demand for niche therapies accelerates segment adoption. Local market penetration by distributors further boosts this segment.
Middle East and Africa API Intermediates Market Regional Analysis
- Egypt dominated the Middle East and Africa API intermediates market with the largest revenue share of 38% in 2024, characterized by expanding pharmaceutical manufacturing infrastructure, government initiatives supporting local production, and the presence of established contract manufacturing organizations, with substantial growth in veterinary and pharmaceutical drug intermediates, particularly for cardiovascular and metabolic disease therapies
- Manufacturers in Egypt prioritize high-quality API intermediates for cardiovascular, metabolic, and infectious disease therapies, ensuring compliance with international standards and supporting both domestic consumption and export markets
- The widespread adoption of locally produced intermediates is supported by strategic investments in advanced production facilities, contract manufacturing partnerships, and skilled workforce development, establishing Egypt as a key hub for API synthesis in the MEA region
The Egypt API Intermediates Market Insight
The Egypt API intermediates market captured the largest revenue share of 38% in 2024 within the MEA region, fueled by expanding pharmaceutical manufacturing infrastructure and government initiatives to promote local production. Manufacturers are increasingly prioritizing high-quality intermediates for cardiovascular, metabolic, and infectious disease therapies. The growing demand for both generic and specialty drug intermediates is driving investment in advanced production technologies. Furthermore, partnerships with multinational pharmaceutical companies are enabling technology transfer and capacity building. Egypt’s regulatory support, skilled workforce, and strategic location for exports are further bolstering market growth. Rising healthcare expenditure and chronic disease prevalence continue to sustain strong demand for API intermediates.
South Africa API Intermediates Market Insight
The South Africa API intermediates market is anticipated to grow at the fastest CAGR of 21% during the forecast period of 2025 to 2032, driven by increasing healthcare infrastructure investments and rising demand for high-quality drug intermediates. Local manufacturers are focusing on expanding production capacities for oncology, metabolic, and veterinary drug intermediates. Government initiatives aimed at reducing import dependence and supporting domestic pharmaceutical production further stimulate growth. The adoption of advanced synthesis technologies and contract manufacturing services enhances quality and scalability. South Africa is also emerging as a regional hub for API supply to neighboring countries. The growing prevalence of chronic and lifestyle-related diseases underlines the continued need for reliable intermediates.
Saudi Arabia API Intermediates Market Insight
The Saudi Arabia API intermediates market is gaining momentum due to increasing investments in healthcare infrastructure and pharmaceutical manufacturing. The government’s Vision 2030 initiative is promoting local API production and reducing reliance on imports. Manufacturers are focusing on producing intermediates for metabolic, infectious, and cardiovascular drugs. The adoption of modern synthesis techniques and quality control systems ensures compliance with international standards. Growing partnerships with multinational pharmaceutical companies support technology transfer and capacity building. In addition, rising chronic disease prevalence and expanding healthcare facilities in the country contribute to sustained market growth.
Nigeria API Intermediates Market Insight
The Nigeria API intermediates market accounted for a significant share of the Sub-Saharan region in 2024, driven by increasing demand for affordable and high-quality drug intermediates. Local manufacturers are focusing on producing pharmaceutical and veterinary intermediates to meet domestic and regional needs. Investments in production facilities, regulatory compliance, and workforce training are enhancing manufacturing capabilities. Nigeria’s strategic position in West Africa supports exports to neighboring countries. Government support for local pharmaceutical manufacturing is also fueling growth. Rising prevalence of infectious and chronic diseases continues to drive demand for reliable API intermediates.
Middle East and Africa API Intermediates Market Share
The Middle East and Africa API Intermediates industry is primarily led by well-established companies, including:
- Hikma Pharmaceuticals (Jordan)
- Julphar Gulf Pharmaceutical Industries (UAE)
- Dr. Reddy’s Laboratories Ltd. (India)
- Aurobindo Pharma Limited (India)
- EVA Pharma (Egypt)
- Aspen Pharmacare (South Africa)
- Cadila Pharmaceuticals Ltd. (India)
- Sandoz (U.S.)
- Teva Pharmaceutical Industries Ltd. (Israel)
- Sun Pharmaceutical Industries Ltd. (India)
- Cipla Ltd. (India)
- AbbVie Inc. (U.S.)
- Sanofi (France)
- Bristol-Myers Squibb Company (U.S.)
- Merck & Co., Inc. (U.S.)
- Pfizer Inc. (U.S.)
- Johnson & Johnson Services, Inc. (U.S.)
- Eli Lilly and Company (U.S.)
- GSK plc (U.K.)
What are the Recent Developments in Middle East and Africa API Intermediates Market?
- In October 2025, a report highlighted the expansion of the UAE pyridine market, driven by rising demand in pharmaceuticals, food flavoring, and rubber production. Opportunities also exist in the electronics sector, supported by the country's growing industrial base and investment in high-tech industries. This development indicates the UAE's increasing role in the production of key chemical intermediates essential for various pharmaceutical applications
- In August 2025, Marubeni Corporation completed its investment in Phillips Healthcare Corporation (Phillips Pharma), now a Marubeni equity-method affiliate. This move is part of Marubeni's strategy to expand its pharmaceutical business in Africa, contributing to the development of a new antimalarial drug program and joining the AAIC Fund, which focuses on investing in and supporting the growth of companies in the healthcare sector
- In July 2025, Hikma Pharmaceuticals and the International Finance Corporation (IFC) signed a USD 250 million deal, marking a 40-year partnership aimed at driving access to quality medicines in the MENA region. This partnership underscores the commitment to enhancing the pharmaceutical supply chain and improving access to essential medicines across the Middle East and North Africa
- In July 2025, the Egyptian government announced plans to establish a state-of-the-art pharmaceutical manufacturing facility in Alexandria, aimed at producing a wide range of Active Pharmaceutical Ingredient (API) intermediates. This initiative is part of Egypt's broader strategy to enhance local production capabilities and reduce dependency on imported APIs
- In June 2025, EVA Pharma and CHICO Pharmaceutical signed a strategic Memorandum of Understanding (MoU) to localize oncology Active Pharmaceutical Ingredient (API) production for the Middle East and Africa. This collaboration aims to enhance regional supply chains and improve access to high-potency cancer treatments
SKU-

- Interactive Data Analysis Dashboard
- Company Analysis Dashboard for high growth potential opportunities
- Research Analyst Access for customization & queries
- Competitor Analysis with Interactive dashboard
- Latest News, Updates & Trend analysis
- Harness the Power of Benchmark Analysis for Comprehensive Competitor Tracking
Data collection and base year analysis are done using data collection modules with large sample sizes. The stage includes obtaining market information or related data through various sources and strategies. It includes examining and planning all the data acquired from the past in advance. It likewise envelops the examination of information inconsistencies seen across different information sources. The market data is analysed and estimated using market statistical and coherent models. Also, market share analysis and key trend analysis are the major success factors in the market report. To know more, please request an analyst call or drop down your inquiry.
The key research methodology used by DBMR research team is data triangulation which involves data mining, analysis of the impact of data variables on the market and primary (industry expert) validation. Data models include Vendor Positioning Grid, Market Time Line Analysis, Market Overview and Guide, Company Positioning Grid, Patent Analysis, Pricing Analysis, Company Market Share Analysis, Standards of Measurement, Global versus Regional and Vendor Share Analysis. To know more about the research methodology, drop in an inquiry to speak to our industry experts.
Data Bridge Market Research is a leader in advanced formative research. We take pride in servicing our existing and new customers with data and analysis that match and suits their goal. The report can be customized to include price trend analysis of target brands understanding the market for additional countries (ask for the list of countries), clinical trial results data, literature review, refurbished market and product base analysis. Market analysis of target competitors can be analyzed from technology-based analysis to market portfolio strategies. We can add as many competitors that you require data about in the format and data style you are looking for. Our team of analysts can also provide you data in crude raw excel files pivot tables (Fact book) or can assist you in creating presentations from the data sets available in the report.


