
Middle East And Africa Bioactive Ingredient Market
Market Size in USD Billion
 USD
3.55 Billion
USD
6.01 Billion
2025
2033
USD
3.55 Billion
USD
6.01 Billion
2025
2033
| 2026 - 2033 | |
| USD 3.55 Billion | |
| USD 6.01 Billion | |
| % | |
|
Middle East and Africa Bioactive Ingredient Market Size
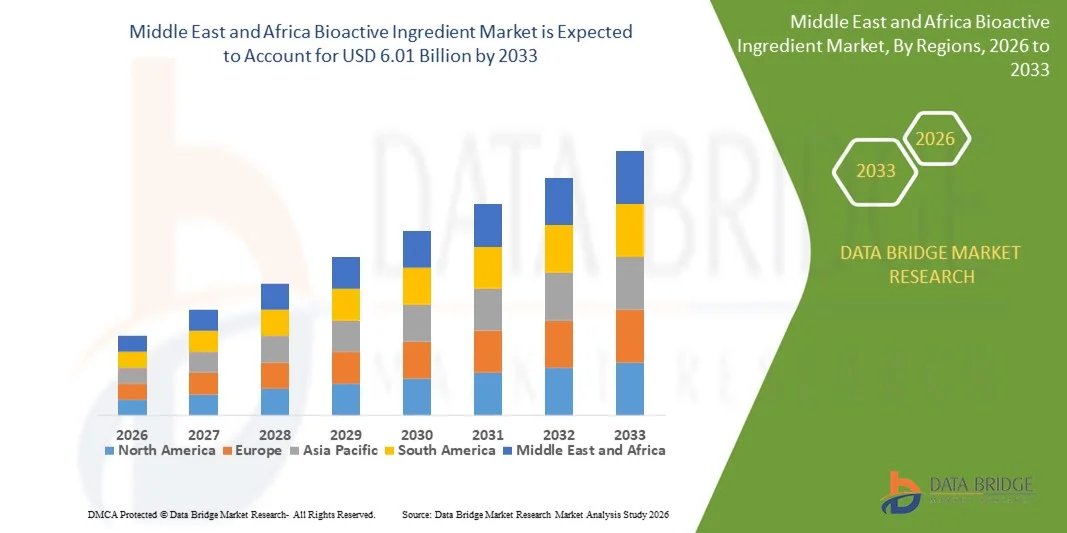
- The Middle East and Africa bioactive ingredient market size was valued at USD 3.55 billion in 2025 and is expected to reach USD 6.01 billion by 2033, at a CAGR of 6.80% during the forecast period
- The market growth is largely fuelled by rising consumer awareness regarding preventive healthcare, functional nutrition, and the role of bioactive compounds in managing lifestyle-related disorders
- Increasing incorporation of bioactive ingredients in functional foods, dietary supplements, nutraceuticals, and personal care formulations is further supporting sustained market expansion
Middle East and Africa Bioactive Ingredient Market Analysis
- The market is witnessing strong momentum due to continuous innovation in extraction, formulation, and delivery technologies that enhance bioavailability, stability, and efficacy of bioactive compounds
- In addition, growing preference for natural, plant-based, and clean-label ingredients, coupled with expanding applications across food, beverage, pharmaceutical, and cosmetic industries, is strengthening overall market attractiveness
- South Africa bioactive ingredient market dominated in 2025, supported by rising awareness of preventive healthcare and improving living standards. Growing middle-class population is driving demand for functional foods and supplements
- U.A.E. is expected to witness the highest compound annual growth rate (CAGR) in the Middle East and Africa bioactive ingredient market due to increasing health consciousness, high disposable incomes, growing demand for premium nutrition and wellness products, and government initiatives supporting the functional food and nutraceutical sectors
- The vitamins segment held the largest market revenue share in 2025 driven by widespread use in functional foods, dietary supplements, and fortified beverages, along with growing consumer focus on immunity, energy, and overall wellness. Vitamins are extensively incorporated due to their established health benefits, ease of formulation, and strong consumer awareness across age groups
Report Scope and Middle East and Africa Bioactive Ingredient Market Segmentation
|
Attributes |
Middle East and Africa Bioactive Ingredient Key Market Insights |
|
Segments Covered |
|
|
Countries Covered |
Middle East and Africa
|
|
Key Market Players |
|
|
Market Opportunities |
|
|
Value Added Data Infosets |
In addition to the insights on market scenarios such as market value, growth rate, segmentation, geographical coverage, and major players, the market reports curated by the Data Bridge Market Research also include in-depth expert analysis, pricing analysis, brand share analysis, consumer survey, demography analysis, supply chain analysis, value chain analysis, raw material/consumables overview, vendor selection criteria, PESTLE Analysis, Porter Analysis, and regulatory framework. |
Middle East and Africa Bioactive Ingredient Market Trends
Rising Demand For Preventive Healthcare And Functional Nutrition
- The increasing focus on health maintenance and disease prevention is significantly shaping the bioactive ingredient market, as consumers increasingly seek ingredients that offer physiological benefits beyond basic nutrition. Bioactive ingredients are gaining strong traction due to their proven role in supporting immunity, digestive health, cardiovascular wellness, and cognitive performance. This trend is strengthening their adoption across functional foods, dietary supplements, nutraceuticals, and personal care products, encouraging manufacturers to develop innovative formulations aligned with health-focused consumption patterns
- Growing awareness around lifestyle-related disorders, ageing populations, and long-term wellness has accelerated the demand for bioactive ingredients in functional foods, fortified beverages, supplements, and sports nutrition products. Health-conscious consumers are actively seeking products enriched with antioxidants, probiotics, omega fatty acids, polyphenols, and plant extracts, prompting brands to emphasize scientific validation, clean-label positioning, and functional efficacy in product development
- Preventive health and wellness trends are influencing purchasing decisions, with manufacturers highlighting clinically backed benefits, natural sourcing, and bioavailability enhancement. Transparent labeling, health claims supported by research, and sustainability credentials are helping brands differentiate products and build consumer trust, while also driving investments in R&D and advanced delivery systems
- For instance, in 2024, leading nutrition and wellness brands expanded their portfolios by introducing functional foods and supplements fortified with bioactive compounds such as probiotics, omega-3 fatty acids, and plant-based antioxidants. These launches were driven by rising consumer demand for immunity-boosting, gut-health, and energy-support products, with strong traction across retail, e-commerce, and health-focused distribution channels
- While demand for bioactive ingredients continues to rise, sustained market growth depends on continuous research, regulatory compliance, and ensuring consistent efficacy across formulations. Manufacturers are focusing on improving bioavailability, stability, and scalability while balancing cost, quality, and scientific substantiation to support broader adoption
Middle East and Africa Bioactive Ingredient Market Dynamics
Driver
Growing Focus On Preventive Healthcare And Functional Food Consumption
- Rising consumer emphasis on preventive healthcare is a key driver for the bioactive ingredient market. Consumers are increasingly turning to functional foods, supplements, and nutraceuticals enriched with bioactive compounds to support long-term health, manage chronic conditions, and enhance overall well-being. This shift is encouraging manufacturers to replace conventional ingredients with functional bioactives supported by scientific evidence
- Expanding applications across functional foods, beverages, dietary supplements, pharmaceuticals, and personal care products are contributing to market growth. Bioactive ingredients help enhance nutritional value, functional performance, and health positioning, enabling manufacturers to meet evolving consumer expectations for wellness-oriented products
- Food, supplement, and personal care manufacturers are actively promoting bioactive ingredient-based formulations through product innovation, clinical research, and health-focused marketing campaigns. These efforts are supported by increasing consumer preference for natural, science-backed, and multifunctional ingredients, encouraging partnerships between ingredient suppliers, research institutions, and brands
- For instance, in 2023, major global nutrition and supplement companies reported increased incorporation of probiotics, plant extracts, and omega fatty acids in functional food and supplement formulations. This expansion followed higher consumer demand for immunity, digestive health, and cognitive support solutions, driving product differentiation and repeat purchases
- Although preventive health trends strongly support market growth, long-term success depends on regulatory alignment, consistent ingredient quality, and ongoing investment in research and formulation technologies to meet global demand and maintain competitive positioning
Restraint/Challenge
High Development Costs And Regulatory Complexity
- The relatively high cost associated with developing and commercializing bioactive ingredients remains a key challenge, particularly due to extensive research, clinical validation, and advanced processing requirements. Extraction, purification, and stabilization processes often increase production costs, limiting adoption among price-sensitive manufacturers
- Regulatory complexity and varying approval requirements for health claims and functional ingredients pose additional challenges. Manufacturers must comply with stringent safety, efficacy, and labeling standards, which can delay product launches and increase compliance costs. Limited regulatory clarity around certain novel bioactive compounds further restricts market entry
- Supply chain and formulation challenges also impact market growth, as some bioactive ingredients are sensitive to heat, light, and oxidation. Ensuring stability, bioavailability, and consistent performance across different product formats increases formulation complexity and operational costs
- For instance, manufacturers introducing new bioactive-based functional foods and supplements in 2024 reported delays due to extended approval timelines and the need for additional clinical documentation to support health claims. These factors increased time-to-market and constrained innovation cycles
- Addressing these challenges will require streamlined regulatory frameworks, cost-efficient extraction technologies, and continued investment in scientific research. Collaboration between ingredient producers, regulatory bodies, and product manufacturers will be essential to unlock long-term growth opportunities and ensure sustainable expansion of the global bioactive ingredient market
Middle East and Africa Bioactive Ingredient Market Scope
The market is segmented on the basis of ingredient type, application, and source.
- By Ingredient Type
On the basis of ingredient type, the Middle East and Africa bioactive ingredient market is segmented into Prebiotics, Probiotics, Amino Acid, Peptides, Omega 3 And Structured Lipids, Phytochemicals & Plant Extracts, Minerals, Vitamins, Fibers and Specialty Carbohydrates, Carotenoids and Antioxidants, and Others. The vitamins segment held the largest market revenue share in 2025 driven by widespread use in functional foods, dietary supplements, and fortified beverages, along with growing consumer focus on immunity, energy, and overall wellness. Vitamins are extensively incorporated due to their established health benefits, ease of formulation, and strong consumer awareness across age groups.
The probiotics segment is expected to witness the fastest growth rate from 2026 to 2033, driven by increasing awareness of gut health, digestive wellness, and immune support. Rising consumption of fermented foods, functional beverages, and probiotic supplements is supporting rapid adoption, with manufacturers investing in strain innovation and improved stability for broader application.
- By Application
On the basis of application, the Middle East and Africa bioactive ingredient market is segmented into Functional Food, Dietary Supplements, Gummy Supplements, Animal Nutrition, Personal Care, and Other. The dietary supplements segment accounted for the largest market share in 2025 supported by growing health consciousness, preventive healthcare trends, and rising demand for convenient nutrition formats. Bioactive ingredients are widely used in capsules, tablets, and powders to address immunity, energy, and lifestyle-related health concerns.
The functional food segment is expected to register the highest growth rate from 2026 to 2033, driven by increasing consumption of fortified foods and beverages that offer added health benefits. Manufacturers are focusing on incorporating bioactive ingredients into everyday food products to align with evolving consumer preferences for nutrition-rich and wellness-oriented diets.
- By Source
On the basis of source, the Middle East and Africa bioactive ingredient market is segmented into Plant, Animal, and Microbial. The plant-based segment dominated the market in 2025 driven by strong consumer preference for natural, clean-label, and sustainably sourced ingredients. Plant-derived bioactives such as polyphenols, fibers, and plant extracts are widely used across food, supplement, and personal care applications due to their perceived safety and functional benefits.
The microbial segment is expected to register the highest growth rate from 2026 to 2033, supported by increasing use of probiotics, enzymes, and fermentation-derived ingredients. Advances in biotechnology and fermentation processes are enabling scalable production and consistent quality, making microbial sources increasingly attractive for bioactive ingredient manufacturers.
Middle East and Africa Bioactive Ingredient Market Regional Analysis
- South Africa bioactive ingredient market dominated in 2025, supported by rising awareness of preventive healthcare and improving living standards. Growing middle-class population is driving demand for functional foods and supplements
- Urbanization and changing dietary patterns are influencing consumption of bioactive ingredients
- Expansion of modern retail and pharmacy networks is enhancing market reach. Increasing interest in immunity and wellness products is sustaining demand
U.A.E. Bioactive Ingredient Market Insight
The U.A.E. bioactive ingredient market is expected to witness the fastest growth rate from 2026 to 2033, driven by high disposable incomes and strong health awareness. Consumers are increasingly adopting premium nutrition and wellness products. Demand for functional foods, supplements, and fortified beverages is rising. Government focus on health and wellness initiatives supports market development. Growing investment in nutraceutical innovation is accelerating adoption
Middle East and Africa Bioactive Ingredient Market Share
The Middle East and Africa bioactive ingredient industry is primarily led by well-established companies, including:
• Saudi Basic Industries Corporation (Saudi Arabia)
• Savola Group (Saudi Arabia)
• Almarai Company (Saudi Arabia)
• National Food Products Company (U.A.E.)
• IFFCO Group (U.A.E.)
• Al Ain Farms (U.A.E.)
• Aspen Pharmacare Holdings Limited (South Africa)
• Adcock Ingram Holdings Limited (South Africa)
• RCL Foods Limited (South Africa)
• Tiger Brands Limited (South Africa)
• Clover Industries Limited (South Africa)
• Zamil Industrial Investment Co. (Saudi Arabia)
• Julphar Gulf Pharmaceutical Industries (U.A.E.)
• Nutrivita Food Industries (Egypt)
• Pharco Pharmaceuticals (Egypt)
SKU-

- Interactive Data Analysis Dashboard
- Company Analysis Dashboard for high growth potential opportunities
- Research Analyst Access for customization & queries
- Competitor Analysis with Interactive dashboard
- Latest News, Updates & Trend analysis
- Harness the Power of Benchmark Analysis for Comprehensive Competitor Tracking
Middle East And Africa Bioactive Ingredient Market, Supply Chain Analysis and Ecosystem Framework
To support market growth and help clients navigate the impact of geopolitical shifts, DBMR has integrated in-depth supply chain analysis into its Middle East And Africa Bioactive Ingredient Market research reports. This addition empowers clients to respond effectively to global changes affecting their industries. The supply chain analysis section includes detailed insights such as Middle East And Africa Bioactive Ingredient Market consumption and production by country, price trend analysis, the impact of tariffs and geopolitical developments, and import and export trends by country and HSN code. It also highlights major suppliers with data on production capacity and company profiles, as well as key importers and exporters. In addition to research, DBMR offers specialized supply chain consulting services backed by over a decade of experience, providing solutions like supplier discovery, supplier risk assessment, price trend analysis, impact evaluation of inflation and trade route changes, and comprehensive market trend analysis.
Data collection and base year analysis are done using data collection modules with large sample sizes. The stage includes obtaining market information or related data through various sources and strategies. It includes examining and planning all the data acquired from the past in advance. It likewise envelops the examination of information inconsistencies seen across different information sources. The market data is analysed and estimated using market statistical and coherent models. Also, market share analysis and key trend analysis are the major success factors in the market report. To know more, please request an analyst call or drop down your inquiry.
The key research methodology used by DBMR research team is data triangulation which involves data mining, analysis of the impact of data variables on the market and primary (industry expert) validation. Data models include Vendor Positioning Grid, Market Time Line Analysis, Market Overview and Guide, Company Positioning Grid, Patent Analysis, Pricing Analysis, Company Market Share Analysis, Standards of Measurement, Global versus Regional and Vendor Share Analysis. To know more about the research methodology, drop in an inquiry to speak to our industry experts.
Data Bridge Market Research is a leader in advanced formative research. We take pride in servicing our existing and new customers with data and analysis that match and suits their goal. The report can be customized to include price trend analysis of target brands understanding the market for additional countries (ask for the list of countries), clinical trial results data, literature review, refurbished market and product base analysis. Market analysis of target competitors can be analyzed from technology-based analysis to market portfolio strategies. We can add as many competitors that you require data about in the format and data style you are looking for. Our team of analysts can also provide you data in crude raw excel files pivot tables (Fact book) or can assist you in creating presentations from the data sets available in the report.


