
Middle East And Africa Bioinformatics Market
Market Size in USD Billion
 USD
1.58 Billion
USD
4.86 Billion
2025
2033
USD
1.58 Billion
USD
4.86 Billion
2025
2033
| 2026 - 2033 | |
| USD 1.58 Billion | |
| USD 4.86 Billion | |
| % | |
|
Middle East and Africa Bioinformatics Market Overview
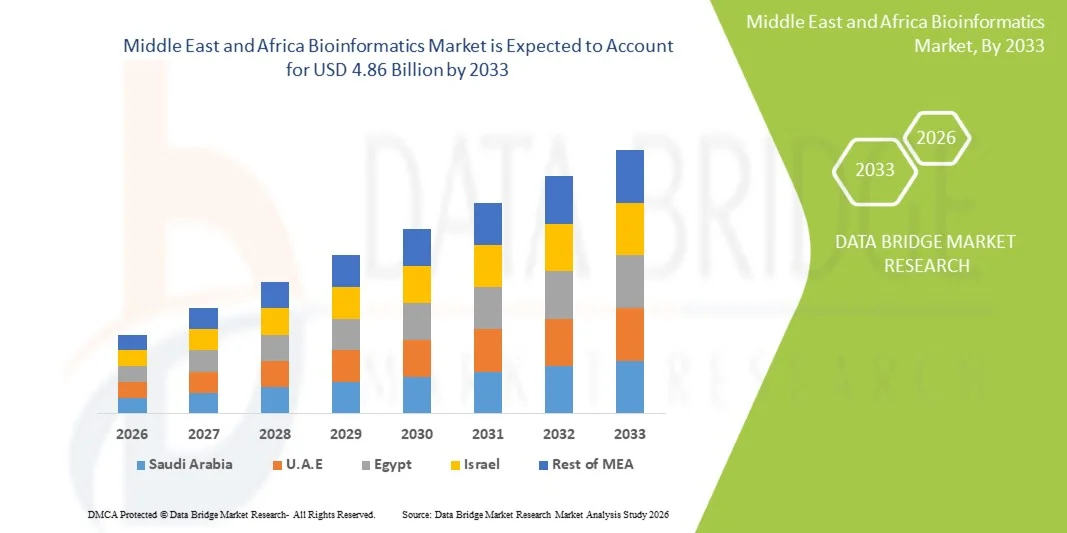
The Middle East and Africa Bioinformatics market was valued at USD 1.58 billion in 2025 and is projected to reach USD 4.86 billion by 2033, growing at a CAGR of 15.08% from 2026 to 2033. The Middle East and Africa Bioinformatics Market is experiencing steady growth driven by increasing investments in genomics research, rising adoption of precision medicine, and expanding applications of bioinformatics solutions across healthcare, biotechnology, agriculture, and academic research sectors.
The growing burden of chronic diseases, increasing focus on personalized healthcare, and advancements in next-generation sequencing (NGS), artificial intelligence, and data analytics are encouraging governments, research institutions, and healthcare organizations across the region to adopt advanced bioinformatics platforms. Countries are strengthening genomic research capabilities through national initiatives, while pharmaceutical and biotechnology companies are leveraging bioinformatics tools for drug discovery, biomarker identification, and clinical research. The increasing availability of biological data, development of research infrastructure, and collaborations between global technology providers and regional institutions are further supporting the adoption of bioinformatics solutions across the Middle East and Africa.
Key Market Trends & Insights
- Saudi Arabia dominated the Middle East and Africa Bioinformatics market with the largest revenue share of 34.12% in 2025, supported by strong government initiatives under healthcare transformation programs, rising investments in genomics and precision medicine, and expansion of biotechnology research infrastructure.
- The Group Purchase segment dominated the market with a 61.42% share in 2025, owing to widespread adoption of bioinformatics solutions by universities, research institutions, pharmaceutical companies, and government laboratories.
- A.E. is expected to be the fastest-growing country in the Middle East and Africa Bioinformatics market at a CAGR of 8.1% from 2026 to 2033, fueled by investments in digital healthcare, genomics research centers, AI-driven life science solutions, and government-backed biotechnology innovation initiatives.
- Cloud-Based Bioinformatics Platforms are the fastest-growing technology segment, projected to register a CAGR of 8.5%, reflecting rising demand for scalable data analysis solutions, secure genomic data storage, and collaborative research environments.
- On-Premise deployment accounts the market in 2025, preferred by research organizations, healthcare institutions, and government laboratories requiring enhanced data control, regulatory compliance, and secure management of sensitive genomic information.
Market Size & Forecast
- Middle East and Africa Market Value (2025): USD 1.58 Billion
- Expected Market Value (2033): USD 4.86 Billion
- Forecast CAGR (2026–2033): 15.08%
- Leading Region in 2025: Saudi Arabia
- Fastest Growing Region: U.A.E.
Report Scope and Middle East and Africa Bioinformatics Market Segmentation
|
Attributes |
Bioinformatics Key Market Insights |
|
Segments Covered |
|
|
Countries Covered |
Middle East and Africa · Saudi Arabia · U.A.E. · South Africa · Egypt · Israel · Rest of Middle East and Africa · |
|
Key Market Players |
· Thermo Fisher Scientific Inc. (U.S.) · Illumina, Inc. (U.S.) · QIAGEN N.V. (Netherlands) · Agilent Technologies, Inc. (U.S.) · PerkinElmer Inc. (U.S.) · Bio-Rad Laboratories, Inc. (U.S.) · Danaher Corporation (U.S.) · Becton Dickinson and Company (U.S.) · F. Hoffmann-La Roche Ltd (Switzerland) · SAS Institute Inc. (U.S.) · IBM Corporation (U.S.) · Microsoft Corporation (U.S.) · Oracle Corporation (U.S.) · DNAnexus, Inc. (U.S.) · Seven Bridges Genomics (U.S.) · Benchling, Inc. (U.S.) · Dotmatics (U.S.) · Bionano Genomics, Inc. (U.S.) · Partek Incorporated (U.S.) · Genedata AG (Switzerland) · Sophia Genetics SA (Switzerland) · CLC bio (Denmark) · Qiagen Digital Insights (Germany) · Altos Labs (U.S.) · Strand Life Sciences (India) · Tata Consultancy Services (India) · Infosys Limited (India) · Wipro Limited (India) · Bharat Biotech International Limited (India) · Biocon Limited (India) · MGI Tech Co., Ltd. (China) · BGI Genomics Co., Ltd. (China) · Macrogen Inc. (South Korea) · Takara Bio Inc. (Japan) · Eurofins Scientific SE (Luxembourg) |
|
Market Opportunities |
· Expansion of Precision Medicine and Genomics Programs · Rising Adoption of AI and Cloud-Based Bioinformatics Platforms · Growing Research Collaborations and Biotechnology Infrastructure Development |
|
Value Added Data Infosets |
In addition to the insights on market scenarios such as market value, growth rate, segmentation, geographical coverage, and major players, the market reports curated by the Data Bridge Market Research also include in-depth expert analysis, geographically represented company-wise production and capacity, network layouts of distributors and partners, detailed and updated price trend analysis and deficit analysis of supply chain and demand. |
Middle East and Africa Bioinformatics Market Trends
Trend: Growth in Precision Medicine, Genomics & AI-Driven Life Sciences
Healthcare systems and research organizations across the Middle East and Africa are increasingly adopting Bioinformatics platforms to support genomic analysis, personalized medicine, disease profiling, and advanced biological research. The rising availability of next-generation sequencing (NGS) technologies is generating massive volumes of genomic and clinical data, creating demand for advanced computational tools for data interpretation and storage. Countries such as Saudi Arabia and the U.A.E. are accelerating adoption through national genomics initiatives, including large-scale population sequencing programs aimed at improving disease understanding and precision healthcare outcomes. The integration of artificial intelligence (AI) and machine learning into bioinformatics workflows is further enabling faster genome annotation, biomarker identification, and drug discovery processes.
Middle East and Africa Bioinformatics Market Dynamics
Key Market Driver: Increasing Investments in Genomics Research and Precision Healthcare Infrastructure
The growing focus on precision medicine, genetic disease research, and biotechnology development is a major driver for the Middle East and Africa Bioinformatics market. Governments and healthcare institutions are investing in genomic databases, sequencing infrastructure, and digital health platforms to improve diagnosis and treatment strategies. Saudi Arabia’s Saudi Human Genome Program, launched to build a national genomic database, has accelerated demand for bioinformatics solutions capable of analyzing large-scale sequencing datasets. Similarly, the U.A.E. has expanded genomics capabilities through initiatives such as the Emirati Genome Program, which supports population-scale genomic research and personalized healthcare development.
The increasing burden of chronic diseases, rare genetic disorders, and oncology-related conditions is also encouraging hospitals, research centers, and pharmaceutical companies to adopt bioinformatics tools for biomarker discovery, clinical research, and targeted therapy development.
Key Restraint/Challenge: Limited Bioinformatics Expertise and High Data Management Complexity
A significant challenge in the Middle East and Africa Bioinformatics market is the shortage of skilled professionals capable of managing advanced genomic datasets, computational biology workflows, and AI-based analysis platforms. Bioinformatics requires expertise across molecular biology, data science, cloud computing, and machine learning, creating a talent gap in several emerging markets. In addition, the management of large-scale genomic data presents challenges related to storage costs, cybersecurity, regulatory compliance, and data privacy. High-performance computing infrastructure and specialized bioinformatics software require continuous investment, which can limit adoption among smaller research institutions and healthcare organizations. For instance, population-scale sequencing programs generate terabytes of genomic information, requiring advanced computational infrastructure for secure processing and interpretation, increasing the operational complexity for regional healthcare systems.
Key Market Opportunity: Integration of Artificial Intelligence and Cloud-Based Bioinformatics Platforms
The integration of AI, machine learning, and cloud computing represents a significant growth opportunity for the Middle East and Africa Bioinformatics market. AI-powered bioinformatics platforms can accelerate genome interpretation, identify disease-associated genetic variations, improve drug discovery pipelines, and enable predictive healthcare analytics. Cloud-based solutions are gaining attention as they allow healthcare providers, universities, and research organizations to access advanced computational capabilities without investing heavily in standalone infrastructure. Pharmaceutical and biotechnology companies are increasingly leveraging these platforms for clinical trial optimization, molecular modeling, and precision drug development. The expansion of biotechnology hubs in countries such as Saudi Arabia, the U.A.E., and South Africa, combined with increasing collaborations between academic institutions, healthcare providers, and global life science companies, is expected to create new opportunities for bioinformatics adoption across the region.
Middle East and Africa Bioinformatics Market Scope
The Bioinformatics market is segmented on the basis of type, sector, application, purchase mode, method, and end-user.
- By Type
On the basis of type, the Middle East and Africa Bioinformatics market is segmented into Knowledge Management Tools, Bioinformatics Software, and Bioinformatics Services. The Bioinformatics Software segment dominated the market with a 43.25% share in 2025, owing to increasing adoption of advanced computational biology platforms, genomic data analysis solutions, and sequence interpretation software across healthcare institutions, research organizations, and biotechnology companies. The growing availability of high-throughput sequencing technologies and increasing generation of complex biological datasets are driving demand for efficient software solutions. In addition, rising investments in precision medicine, personalized healthcare, and molecular diagnostics are encouraging organizations to adopt advanced bioinformatics software platforms. The integration of artificial intelligence, machine learning, and cloud-based analytics into bioinformatics software is further improving data processing capabilities and research efficiency. Moreover, pharmaceutical and biotechnology companies are increasingly utilizing these platforms for drug discovery, biomarker identification, and clinical research applications, strengthening the dominance of this segment across the Middle East and Africa market.
The Bioinformatics Services segment is expected to witness the fastest CAGR of 9.2% from 2026 to 2033, driven by increasing demand for outsourced bioinformatics analysis, genomic interpretation, and research support services. The growing shortage of skilled bioinformatics professionals across emerging markets is encouraging academic institutions, healthcare organizations, and biotechnology companies to rely on specialized service providers. In addition, increasing adoption of next-generation sequencing (NGS), proteomics, and transcriptomics research is generating demand for advanced data analysis solutions. Bioinformatics service providers are offering customized solutions, including sequence analysis, database management, and computational modeling, helping organizations reduce research costs and improve efficiency. Furthermore, increasing collaborations between global bioinformatics companies and regional research institutions are expanding service availability across the Middle East and Africa region.
- By Sector
On the basis of sector, the Middle East and Africa Bioinformatics market is segmented into Medical Biotechnology, Academics, Animal Biotechnology, Agricultural Biotechnology, Environmental Biotechnology, Forensic Biotechnology, and Others. The Medical Biotechnology segment dominated the market with a 39.68% share in 2025, supported by increasing adoption of bioinformatics solutions in genomics research, molecular diagnostics, personalized medicine, and drug discovery. The rising prevalence of chronic diseases such as cancer, cardiovascular disorders, and genetic diseases is increasing demand for advanced biological data analysis tools. In addition, government initiatives focused on genomic research and precision healthcare are encouraging healthcare institutions and biotechnology companies to invest in bioinformatics technologies. The growing adoption of next-generation sequencing and biomarker discovery platforms is further strengthening the role of bioinformatics in medical biotechnology. Moreover, pharmaceutical companies are leveraging computational biology solutions to accelerate therapeutic development and improve clinical research outcomes.
The Agricultural Biotechnology segment is projected to register the fastest CAGR of 8.8% from 2026 to 2033, driven by increasing demand for genetic analysis, crop improvement programs, and precision agriculture solutions. Bioinformatics tools are being increasingly adopted for plant genome sequencing, trait identification, and development of improved agricultural varieties. The rising need for sustainable farming practices and enhanced crop productivity is encouraging governments and research institutions to invest in agricultural biotechnology research. In addition, climate change challenges and food security concerns across Africa and the Middle East are increasing the importance of genomic-based agricultural solutions. The integration of bioinformatics with agricultural genomics is enabling researchers to develop disease-resistant crops and optimize breeding programs.
- By Application
On the basis of application, the Middle East and Africa Bioinformatics market is segmented into Genomics & Drug Development, Proteomics, Evolutionary Studies, Agricultural Studies, Veterinary Science, Metabolomics, Transcriptomics, and Others. The Genomics & Drug Development segment dominated the market with a 42.17% share in 2025, due to increasing adoption of genomic sequencing technologies and computational analysis tools for drug discovery and precision medicine applications. Bioinformatics platforms are widely used for genome mapping, disease gene identification, and development of targeted therapies. The increasing focus on personalized healthcare and molecular diagnostics is driving the adoption of genomic analysis solutions. In addition, pharmaceutical and biotechnology companies are utilizing bioinformatics tools to improve drug development efficiency, identify therapeutic targets, and reduce research timelines. Growing investments in genomic databases and population-level sequencing projects are further supporting segment growth.
The Transcriptomics segment is expected to witness the fastest CAGR of 9.5% from 2026 to 2033, driven by increasing demand for gene expression analysis and RNA sequencing applications. Transcriptomics-based research is gaining importance in understanding disease mechanisms, biological pathways, and therapeutic responses. The rising adoption of RNA sequencing technologies in oncology, infectious disease research, and molecular biology is accelerating demand for transcriptomic bioinformatics solutions. In addition, advancements in computational analysis tools are enabling researchers to process large-scale gene expression datasets more efficiently. Increasing academic and pharmaceutical research activities are further contributing to the rapid expansion of this segment.
- By Purchase Mode
On the basis of purchase mode, the Middle East and Africa Bioinformatics market is segmented into Group Purchase and Individual Purchase. The Group Purchase segment dominated the market with a 61.42% share in 2025, owing to widespread adoption of bioinformatics solutions by universities, research institutions, pharmaceutical companies, and government laboratories. Institutional purchasing enables organizations to access advanced software platforms, databases, and research tools at optimized costs. The increasing establishment of genomics centers and biotechnology research facilities is supporting higher adoption of group-based purchasing models. In addition, collaborations between academic institutions and technology providers are encouraging large-scale deployment of bioinformatics platforms. The availability of enterprise-level solutions with multi-user access is further strengthening the dominance of this segment.
The Individual Purchase segment is projected to grow at the fastest CAGR of 7.9% from 2026 to 2033, driven by increasing adoption among independent researchers, small biotechnology companies, and specialized laboratories. The availability of subscription-based and cloud-based bioinformatics platforms is making advanced tools more accessible to individual users. In addition, increasing research activities among smaller organizations and growing availability of affordable software solutions are supporting segment expansion. The shift toward flexible purchasing models and online access to bioinformatics resources is further accelerating individual adoption.
Middle East and Africa Bioinformatics Market Regional Analysis
The Middle East and Africa Bioinformatics market is witnessing significant growth, driven by increasing investments in genomics research, precision medicine initiatives, biotechnology innovation, and digital healthcare transformation. Governments across the region are actively supporting the development of genomic databases, advanced sequencing capabilities, and AI-enabled healthcare platforms to strengthen disease diagnosis, drug discovery, and personalized treatment approaches. The growing adoption of next-generation sequencing (NGS), cloud-based bioinformatics solutions, and artificial intelligence technologies is further accelerating market expansion. Strategic collaborations between research institutions, healthcare providers, and biotechnology companies continue to enhance the region’s bioinformatics ecosystem.
Saudi Arabia Bioinformatics Market Insight
The Saudi Arabia Bioinformatics market dominated the Middle East and Africa market with the largest revenue share of 34.12% in 2025, supported by strong government investments in healthcare modernization, genomics research, and biotechnology development. Initiatives such as the Saudi Human Genome Program are generating large-scale genomic datasets that require advanced bioinformatics platforms for analysis, storage, and interpretation. The country is increasingly utilizing bioinformatics tools in precision medicine, rare disease research, oncology studies, and pharmaceutical R&D. Furthermore, continued investments under Vision 2030 to strengthen life sciences and healthcare innovation are positioning Saudi Arabia as a leading bioinformatics hub within the region.
U.A.E. Bioinformatics Market Insight
The U.A.E. Bioinformatics market is expected to be the fastest-growing market in the Middle East and Africa, registering a CAGR of 8.1% from 2026 to 2033. Growth is driven by substantial investments in digital healthcare infrastructure, genomic research programs, and AI-powered life science solutions. National initiatives such as the Emirati Genome Program are accelerating the adoption of bioinformatics technologies for population-scale genomic analysis and precision healthcare applications. The country’s strong focus on biotechnology innovation, research collaborations, and advanced healthcare technologies is creating favorable conditions for market expansion. In addition, increasing deployment of cloud-based bioinformatics platforms and AI-driven analytics is strengthening the U.A.E.’s position as a regional center for genomics and computational biology research.
Middle East and Africa Bioinformatics Market Share
The Bioinformatics industry is primarily led by well-established companies, including:
- Thermo Fisher Scientific Inc. (U.S.)
- Illumina, Inc. (U.S.)
- QIAGEN N.V. (Netherlands)
- Agilent Technologies, Inc. (U.S.)
- PerkinElmer Inc. (U.S.)
- Bio-Rad Laboratories, Inc. (U.S.)
- Danaher Corporation (U.S.)
- Becton Dickinson and Company (U.S.)
- F. Hoffmann-La Roche Ltd (Switzerland)
- SAS Institute Inc. (U.S.)
- IBM Corporation (U.S.)
- Microsoft Corporation (U.S.)
- Oracle Corporation (U.S.)
- DNAnexus, Inc. (U.S.)
- Seven Bridges Genomics (U.S.)
- Benchling, Inc. (U.S.)
- Dotmatics (U.S.)
- Bionano Genomics, Inc. (U.S.)
- Partek Incorporated (U.S.)
- Genedata AG (Switzerland)
- Sophia Genetics SA (Switzerland)
- CLC bio (Denmark)
- Qiagen Digital Insights (Germany)
- Altos Labs (U.S.)
- Strand Life Sciences (India)
- Tata Consultancy Services (India)
- Infosys Limited (India)
- Wipro Limited (India)
- Bharat Biotech International Limited (India)
- Biocon Limited (India)
- MGI Tech Co., Ltd. (China)
- BGI Genomics Co., Ltd. (China)
- Macrogen Inc. (South Korea)
- Takara Bio Inc. (Japan)
- Eurofins Scientific SE (Luxembourg)
Latest Developments in Middle East and Africa Bioinformatics Market
- In January 2021, NVIDIA expanded its Clara Parabricks platform, a GPU-accelerated bioinformatics solution for genomic analysis, enabling researchers and healthcare organizations to significantly reduce the time required for secondary genome analysis. The platform enhanced the speed and scalability of next-generation sequencing (NGS) workflows, supporting the growing demand for large-scale genomic data processing in precision medicine and clinical research
- In December 2021, Illumina announced major advancements to its DRAGEN Bio-IT Platform, introducing enhanced graph-based read mapping, machine-learning-driven variant calling, and expanded cloud capabilities. These improvements were designed to increase the accuracy, speed, and scalability of genomic data analysis, reinforcing DRAGEN’s position as one of the leading bioinformatics platforms for next-generation sequencing applications
- In January 2022, Illumina introduced new bioinformatics capabilities on its DRAGEN platform, expanding support for DNA, RNA, and methylation analysis while incorporating a novel Bayesian machine-learning approach. The enhancement enabled faster and more comprehensive genomic analysis, helping researchers accelerate discoveries in genomics and precision medicine
- In August 2023, PacBio announced the commercialization of its Onso Short-Read Sequencing System, a highly accurate sequencing platform utilizing Sequencing by Binding (SBB) chemistry. The launch provided researchers with improved sequencing accuracy and generated high-quality genomic data that can be leveraged by advanced bioinformatics tools for translational research, clinical genomics, and precision medicine applications
- In August 2023, PacBio entered into an agreement to acquire Apton Biosystems, a company developing next-generation high-throughput sequencing technology. The acquisition was aimed at combining PacBio’s sequencing chemistry with Apton’s advanced optical and image-processing technologies to create a high-throughput sequencing platform capable of generating massive genomic datasets for bioinformatics-driven research and analysis
- In March 2024, NVIDIA Healthcare launched a new suite of generative AI microservices for drug discovery, genomics, and digital health applications, including expanded access to Parabricks and other accelerated bioinformatics tools through cloud-native deployment models. The launch strengthened the integration of artificial intelligence and bioinformatics, enabling faster genomic interpretation and large-scale biological data analysis
- In April 2025, Signios Bio officially launched its AI-driven bioinformatics and multiomics platform, designed to support precision medicine and drug discovery. The platform integrates genomics, transcriptomics, proteomics, metabolomics, and spatial biology data with advanced artificial intelligence capabilities, enabling pharmaceutical companies and research organizations to accelerate biomarker discovery and therapeutic development
- In April 2025, GeneDx announced the acquisition of Fabric Genomics for up to USD51 million, strengthening its cloud-based genomic interpretation and AI-enabled bioinformatics capabilities. The acquisition was intended to improve the scalability and speed of genomic data analysis while expanding access to advanced genetic testing and precision medicine solutions worldwide
SKU-

- Interactive Data Analysis Dashboard
- Company Analysis Dashboard for high growth potential opportunities
- Research Analyst Access for customization & queries
- Competitor Analysis with Interactive dashboard
- Latest News, Updates & Trend analysis
- Harness the Power of Benchmark Analysis for Comprehensive Competitor Tracking
Data collection and base year analysis are done using data collection modules with large sample sizes. The stage includes obtaining market information or related data through various sources and strategies. It includes examining and planning all the data acquired from the past in advance. It likewise envelops the examination of information inconsistencies seen across different information sources. The market data is analysed and estimated using market statistical and coherent models. Also, market share analysis and key trend analysis are the major success factors in the market report. To know more, please request an analyst call or drop down your inquiry.
The key research methodology used by DBMR research team is data triangulation which involves data mining, analysis of the impact of data variables on the market and primary (industry expert) validation. Data models include Vendor Positioning Grid, Market Time Line Analysis, Market Overview and Guide, Company Positioning Grid, Patent Analysis, Pricing Analysis, Company Market Share Analysis, Standards of Measurement, Global versus Regional and Vendor Share Analysis. To know more about the research methodology, drop in an inquiry to speak to our industry experts.
Data Bridge Market Research is a leader in advanced formative research. We take pride in servicing our existing and new customers with data and analysis that match and suits their goal. The report can be customized to include price trend analysis of target brands understanding the market for additional countries (ask for the list of countries), clinical trial results data, literature review, refurbished market and product base analysis. Market analysis of target competitors can be analyzed from technology-based analysis to market portfolio strategies. We can add as many competitors that you require data about in the format and data style you are looking for. Our team of analysts can also provide you data in crude raw excel files pivot tables (Fact book) or can assist you in creating presentations from the data sets available in the report.


