
Middle East And Africa Biotechnology Market
Market Size in USD Billion
 USD
51.52 Billion
USD
117.02 Billion
2025
2033
USD
51.52 Billion
USD
117.02 Billion
2025
2033
| 2026 - 2033 | |
| USD 51.52 Billion | |
| USD 117.02 Billion | |
| % | |
|
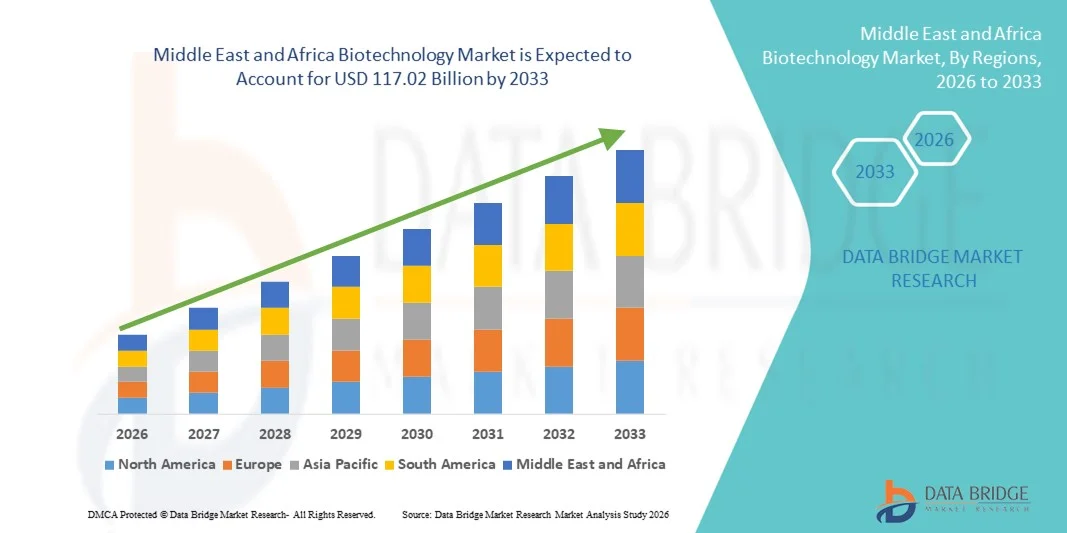
Middle East and Africa Biotechnology Market Size
- The Middle East and Africa biotechnology market size was valued at USD 51.52 billion in 2025 and is expected to reach USD 117.02 billion by 2033, at a CAGR of 10.80% during the forecast period
- The market growth is largely fueled by rising investments in biotechnology infrastructure, expanding government initiatives, and increasing demand for advanced healthcare solutions, agricultural biotech, and sustainable industrial biotechnologies, driving innovation and commercialization across the region
- Furthermore, growing needs for improved health outcomes, enhanced food security, and collaborative international research efforts are prompting adoption of cutting‑edge biotech processes, reinforcing biotechnology as a key driver of economic diversification in both Middle Eastern and African markets
Middle East and Africa Biotechnology Market Analysis
- Biotechnology, encompassing genetic engineering, biopharmaceuticals, and industrial biotech applications, is increasingly vital in advancing healthcare, agriculture, and environmental sustainability across Middle East and Africa, driven by technological innovation, rising R&D investments, and adoption of advanced bioprocesses
- The escalating demand for biotechnology solutions is primarily fueled by growing healthcare needs, food security challenges, and government initiatives supporting biotech research, alongside increasing collaboration with global biotech firms and research institutions
- South Africa dominated the Middle East and Africa biotechnology market with the largest revenue share of 25.9% in 2025, supported by strong research infrastructure, early adoption of advanced biotechnologies, and government funding for healthcare and agricultural biotech projects
- Egypt is expected to be the fastest-growing country in the regional biotechnology market during the forecast period due to rising adoption of DNA sequencing, PCR technology, tissue engineering, and expanding agricultural biotechnology programs
- Reagents segment dominated the market with a market share of 42.7% in 2025, driven by their essential role in research, diagnostics, and laboratory operations across pharmaceutical and biotechnology companies, contract research organizations, and academic institutes in countries including South Africa, UAE, and Kenya
Report Scope and Middle East and Africa Biotechnology Market Segmentation
|
Attributes |
Middle East and Africa Biotechnology Key Market Insights |
|
Segments Covered |
|
|
Countries Covered |
Middle East and Africa
|
|
Key Market Players |
|
|
Market Opportunities |
|
|
Value Added Data Infosets |
In addition to the insights on market scenarios such as market value, growth rate, segmentation, geographical coverage, and major players, the market reports curated by the Data Bridge Market Research also include in-depth expert analysis, patient epidemiology, pipeline analysis, pricing analysis, and regulatory framework |
Middle East and Africa Biotechnology Market Trends
Advancement Through Genomics and Bioinformatics Integration
- A significant and accelerating trend in the Middle East and Africa biotechnology market is the integration of advanced genomics and bioinformatics tools, enhancing research efficiency and enabling precision applications in healthcare, agriculture, and industrial biotechnology
- For instance, in 2025, Therapeia Biotech in South Africa deployed an integrated bioinformatics platform to accelerate genomic research and streamline drug discovery pipelines
- Genomics and bioinformatics integration allows for personalized medicine approaches, predictive disease modeling, and optimized crop engineering, while improving data management and decision-making across biotech operations
- The seamless integration of biotechnology platforms with laboratory information management systems (LIMS) and cloud-based data analytics facilitates centralized monitoring of experiments, sample tracking, and automated reporting, improving operational efficiency
- This trend toward more data-driven, precise, and interconnected biotech solutions is fundamentally reshaping expectations for innovation, prompting companies such as Biovac in South Africa to develop genomics-enabled vaccines and precision therapeutics
- The demand for biotechnology solutions leveraging genomics and bioinformatics is growing rapidly across pharmaceutical, agricultural, and industrial sectors as stakeholders increasingly prioritize precision, efficiency, and scalable outcomes
- Collaborative networks between universities, research institutes, and private biotech firms are accelerating technology transfer and commercialization, fostering innovation and reducing the time from research to market
Middle East and Africa Biotechnology Market Dynamics
Driver
Rising Demand Due to Healthcare Needs and Biopharma Expansion
- The increasing prevalence of chronic diseases, growing population healthcare demands, and expanding pharmaceutical and biotechnology sectors are significant drivers for regional biotechnology adoption
- For instance, in March 2025, Biovac announced a partnership with the South African government to scale vaccine production using advanced bioprocessing technology
- Biotechnology solutions provide targeted therapeutics, biologics, diagnostics, and agricultural biotech interventions, offering effective solutions to address healthcare and food security challenges
- Furthermore, government initiatives supporting biotech research, collaborations with global firms, and incentives for innovation are making biotechnology a core element of economic development strategies
- Investments in laboratory infrastructure, contract research organizations, and academic research institutes, combined with increasing adoption of bioinformatics and DNA sequencing tools, are propelling growth across pharmaceutical, agricultural, and industrial applications
- Growing awareness of sustainable agricultural practices and climate-resilient crops is driving adoption of bio-agriculture solutions, further boosting market demand in Africa and the Middle East
- Expansion of private sector funding and venture capital into biotech startups is fostering innovation, enabling development of new therapeutics, diagnostics, and industrial biotech solutions
Restraint/Challenge
Regulatory Compliance and High Costs of Advanced Biotech Solutions
- Regulatory compliance, intellectual property management, and complex approval processes pose challenges to the faster adoption of biotechnology solutions in Middle East and Africa
- For instance, strict biosafety and clinical trial regulations in Saudi Arabia and UAE have delayed market entry for some advanced therapeutics and agricultural biotech products
- Addressing these regulatory hurdles through harmonized policies, clear approval pathways, and standardized testing protocols is crucial to ensuring compliance and accelerating adoption
- In addition, high costs associated with advanced biotechnology platforms, reagents, instruments, and services can be a barrier for budget-constrained research institutes and startups, limiting market penetration
- Overcoming these challenges through public-private partnerships, subsidized programs, and cost-effective biotech platforms will be essential for sustaining long-term market growth and adoption across the region
- Limited skilled workforce and expertise in advanced biotechnology techniques in some countries pose a challenge for R&D expansion and effective implementation of biotech solutions
- Variations in regulatory frameworks across different countries increase complexity for multinational biotech firms, requiring additional investment in compliance, local approvals, and adaptation to regional requirements
Middle East and Africa Biotechnology Market Scope
The market is segmented on the basis of product type, technology, application, end user, and distribution channel.
- By Product Type
On the basis of product type, the market is segmented into instruments, reagents and services, and software. The Reagents segment dominated the market with the largest revenue share of 42.7% in 2025, driven by its critical role in laboratory research, diagnostics, and biopharmaceutical production. Reagents and services are essential for supporting experiments in genomics, bioinformatics, and industrial biotechnology, offering reliability, accuracy, and standardized results. Pharmaceutical and biotechnology companies, as well as academic and contract research organizations, prefer established reagent kits and service providers to minimize errors and accelerate project timelines. The segment’s dominance is further strengthened by the high demand for outsourced laboratory services and contract research in countries such as South Africa, Saudi Arabia, and UAE. Reagents and services also provide scalability for both large and small-scale operations, making them a cornerstone of regional biotech activities.
The Instruments segment is expected to witness the fastest growth during 2026–2033, fueled by increasing investments in advanced laboratory equipment such as DNA sequencers, PCR machines, and chromatography systems. Modern instruments enable high-throughput experimentation, improved precision, and automation, which are critical for research and biopharmaceutical production. Adoption of instruments is growing rapidly in countries such as Egypt and Kenya due to expanding research infrastructure and government-backed biotech initiatives. The rising preference for in-house lab capabilities over outsourcing services is further driving instrument procurement. Continuous innovation in miniaturized, energy-efficient, and user-friendly instruments also supports faster adoption.
- By Technology
On the basis of technology, the market is segmented into nano biotechnology, PCR technology, DNA sequencing, chromatography, tissue engineering and regeneration, cell-based assays, fermentation, and others. The PCR Technology segment dominated the market with the largest revenue share in 2025, due to its widespread applications in molecular diagnostics, pathogen detection, and genetic research. PCR technology enables rapid, accurate, and scalable amplification of DNA, which is critical for pharmaceutical research, vaccine development, and bio-agriculture studies. Hospitals, research institutes, and contract research organizations in South Africa, Saudi Arabia, and UAE rely heavily on PCR platforms for diagnostic and research purposes. The segment benefits from continuous improvements in automation, miniaturization, and multiplex PCR techniques, allowing simultaneous analysis of multiple targets. Government funding and emergency response needs for infectious disease testing also drive the segment’s dominance.
DNA Sequencing is expected to witness the fastest CAGR during 2026–2033, driven by the growing demand for personalized medicine, genomics research, and bioinformatics integration. DNA sequencing adoption is increasing in countries such as Egypt, Kenya, and UAE, as governments invest in precision medicine and agricultural genomics projects. Advanced sequencing technologies reduce costs and turnaround times, making them accessible to a broader range of research institutes. DNA sequencing platforms also support large-scale population studies, pathogen surveillance, and crop improvement programs, contributing to their rapid growth.
- By Application
On the basis of application, the market is segmented into bio-pharmacy, bio-industrial, bio-services, bioinformatics, and bio-agriculture. The Bio-pharmacy segment dominated the market with the largest revenue share in 2025, driven by high demand for vaccines, biologics, and therapeutic proteins in South Africa, Saudi Arabia, and UAE. Biopharmaceutical applications are critical for addressing rising healthcare needs, chronic diseases, and pandemic preparedness. The segment’s growth is supported by collaborations between local biotech firms and international pharmaceutical companies, expanding manufacturing capabilities and distribution networks. Investment in biopharmaceutical R&D, clinical trials, and advanced manufacturing facilities further reinforces dominance. Bio-pharmacy solutions also benefit from government incentives and policies promoting domestic drug production and reducing import dependency.
Bio-agriculture is expected to witness the fastest growth during 2026–2033 due to rising demand for genetically improved crops, climate-resilient agriculture, and sustainable farming practices in Africa and the Middle East. Countries such as Egypt and Kenya are actively adopting bio-agriculture solutions for higher yield, disease resistance, and food security. Integration with biotechnology tools such as DNA sequencing, tissue engineering, and fermentation accelerates adoption. Growing awareness of sustainable agriculture practices and government subsidies for biotech-enabled crop improvement further drive growth.
- By End User
On the basis of end user, the market is segmented into pharmaceutical & biotechnology companies, contract research organizations, academic & research institutes, and others. The Pharmaceutical & Biotechnology Companies segment dominated the market with the largest revenue share in 2025, due to continuous expansion in biologics, vaccines, and therapeutic development. Companies in South Africa, UAE, and Saudi Arabia leverage biotechnology platforms to accelerate drug discovery, optimize production, and comply with regulatory standards. The segment benefits from increasing private sector investment, strategic partnerships, and government support for pharmaceutical R&D. Demand for integrated lab solutions and reagents also contributes to dominance.
Academic & Research Institutes are expected to witness the fastest growth during 2026–2033, fueled by increasing research funding, collaborations with industry, and expansion of biotechnology education programs. Countries such as Egypt and Kenya are heavily investing in research infrastructure and training programs to build local biotech talent. Academic institutes also adopt advanced technologies such as PCR, DNA sequencing, and bioinformatics to support innovation. Growth is supported by international research collaborations, grants, and access to global biotech resources.
- By Distribution Channel
On the basis of distribution channel, the market is segmented into direct tender, third party distributors, and others. The Direct Tender segment dominated the market with the largest revenue share in 2025, as governments, hospitals, and large pharmaceutical firms prefer direct procurement for bulk purchases of reagents, instruments, and software. Direct tenders ensure quality, compliance, and reliable supply chains, especially for critical biotech applications. South Africa, Saudi Arabia, and UAE rely on direct procurement for national vaccination programs, large-scale research initiatives, and clinical trials. The segment benefits from government contracts, long-term supply agreements, and centralized purchasing policies.
Third Party Distributors are expected to witness the fastest growth during 2026–2033, driven by the expanding number of smaller biotech startups, laboratories, and academic institutes that require flexible supply solutions. Distributors provide localized support, faster delivery, and access to multiple product lines, making them attractive to new market entrants. Countries such as Egypt and Kenya are seeing increased adoption of distributor networks due to growing biotech hubs and emerging research centers.
Middle East and Africa Biotechnology Market Regional Analysis
- South Africa dominated the Middle East and Africa biotechnology market with the largest revenue share of 25.9% in 2025, supported by strong research infrastructure, early adoption of advanced biotechnologies, and government funding for healthcare and agricultural biotech projects
- Stakeholders in the region highly value advanced biotechnology capabilities, including DNA sequencing, PCR technology, and bioinformatics platforms, which enable precision healthcare, improved crop yields, and industrial biotech applications
- This widespread adoption is further supported by growing private sector investment, collaborations with global biotechnology firms, and initiatives to strengthen local research capabilities, establishing biotechnology as a key driver for healthcare, agriculture, and industrial innovation across the region
The South Africa Biotechnology Market Insight
The South Africa biotechnology market captured the largest revenue share of 25.9% in 2025, fueled by advanced research infrastructure, growing government support, and a strong presence of pharmaceutical and biotech companies. Stakeholders increasingly prioritize biopharmaceuticals, bio-services, and bio-agriculture solutions. The growing integration of genomics, PCR technology, and bioinformatics tools is accelerating R&D efficiency. Furthermore, partnerships with global biotech firms and public-private initiatives are expanding local capabilities. South Africa’s emphasis on healthcare innovation and agricultural sustainability is driving market growth across both residential research institutes and commercial biotech enterprises.
Saudi Arabia Biotechnology Market Insight
The Saudi Arabia biotechnology market is projected to expand at a substantial CAGR during the forecast period, primarily driven by government-backed biotech initiatives and investment in biopharmaceuticals and diagnostics. The country is witnessing rapid adoption of advanced biotechnology tools and laboratory automation. Strong funding for genomics research, vaccine production, and precision medicine is fostering growth. In addition, collaborations with international biotech firms are enhancing technology transfer. Growing awareness of healthcare and bio-agriculture applications further stimulates adoption across both urban and industrial sectors.
UAE Biotechnology Market Insight
The UAE biotechnology market is anticipated to grow at a noteworthy CAGR during the forecast period, driven by rising healthcare demands, innovation-friendly policies, and the development of dedicated biotech zones. Advanced laboratory infrastructure and regulatory support for biopharmaceutical production encourage private sector investment. The country’s focus on precision medicine, tissue engineering, and bioinformatics platforms supports adoption across pharmaceutical companies and research institutes. Furthermore, government programs promoting sustainable agriculture and industrial biotech solutions are expanding market reach.
Egypt Biotechnology Market Insight
The Egypt biotechnology market is expected to expand at a considerable CAGR during the forecast period, fueled by increasing government investment in healthcare, bio-agriculture, and industrial biotechnology. Growing academic and research capabilities are supporting local innovation. Expansion of biopharmaceutical production facilities and adoption of technologies such as PCR, DNA sequencing, and fermentation are driving growth. Egypt’s strategic partnerships with multinational biotech firms enable technology transfer and skill development. In addition, demand for affordable biotech solutions in agriculture and healthcare is increasing adoption across the country.
Middle East and Africa Biotechnology Market Share
The Middle East and Africa Biotechnology industry is primarily led by well-established companies, including:
- Lonza Group (Switzerland)
- BioNTech SE (Germany)
- Genmab A/S (Denmark)
- AstraZeneca (U.K.)
- Sanofi (France)
- Novartis AG (Switzerland)
- UCB S.A. (Belgium)
- GSK plc (U.K.)
- Merck KGaA (Germany)
- Bayer AG (Germany)
- Ipsen (France)
- QIAGEN (Netherlands)
- Oxford Nanopore Technologies (U.K.)
- Novo Nordisk A/S (Denmark)
- CSL Behring (Switzerland)
- Morphosys AG (Germany)
- Genfit (France)
- Bio Rad Laboratories (Switzerland)
- Evotec SE (Germany)
What are the Recent Developments in Middle East and Africa Biotechnology Market?
- In November 2025, M42 and Oracle Health announced a strategic initiative in the UAE to integrate the Emirati Genome Program’s data into electronic health records, enabling personalized pharmacogenomic insights at the point of care and advancing disease prevention and customized treatment strategies
- In June 2025, Saudi Arabia concluded its landmark debut at the BIO International Convention 2025 with over a dozen biotech partnerships, the launch of a national biotech accelerator, and formalized collaborations spanning genomics, therapeutics, and advanced diagnostics positioning the Kingdom as a regional biotech hub
- In June 2025, M42 announced a strategic collaboration with AstraZeneca and SOPHiA GENETICS to bring advanced liquid biopsy testing to the UAE, enabling non‑invasive genomic profiling for cancer patients and strengthening precision oncology infrastructure in the Middle East
- In March 2025, Abu Dhabi’s Emirati Genome Programme one of the world’s most comprehensive genomic databases continued expanding its sequencing efforts, with investment and utilization of advanced genomic platforms to support medical research, health strategy, and biotech innovation across the Middle East
- In February 2025, Yemaachi Biotechnology launched The African Cancer Atlas (TACA) in partnership with Roche, a major initiative to generate genomic and clinical data from up to 7,500 African cancer patients to address under‑representation in global cancer research and support precision oncology across Africa
SKU-

- Interactive Data Analysis Dashboard
- Company Analysis Dashboard for high growth potential opportunities
- Research Analyst Access for customization & queries
- Competitor Analysis with Interactive dashboard
- Latest News, Updates & Trend analysis
- Harness the Power of Benchmark Analysis for Comprehensive Competitor Tracking
Data collection and base year analysis are done using data collection modules with large sample sizes. The stage includes obtaining market information or related data through various sources and strategies. It includes examining and planning all the data acquired from the past in advance. It likewise envelops the examination of information inconsistencies seen across different information sources. The market data is analysed and estimated using market statistical and coherent models. Also, market share analysis and key trend analysis are the major success factors in the market report. To know more, please request an analyst call or drop down your inquiry.
The key research methodology used by DBMR research team is data triangulation which involves data mining, analysis of the impact of data variables on the market and primary (industry expert) validation. Data models include Vendor Positioning Grid, Market Time Line Analysis, Market Overview and Guide, Company Positioning Grid, Patent Analysis, Pricing Analysis, Company Market Share Analysis, Standards of Measurement, Global versus Regional and Vendor Share Analysis. To know more about the research methodology, drop in an inquiry to speak to our industry experts.
Data Bridge Market Research is a leader in advanced formative research. We take pride in servicing our existing and new customers with data and analysis that match and suits their goal. The report can be customized to include price trend analysis of target brands understanding the market for additional countries (ask for the list of countries), clinical trial results data, literature review, refurbished market and product base analysis. Market analysis of target competitors can be analyzed from technology-based analysis to market portfolio strategies. We can add as many competitors that you require data about in the format and data style you are looking for. Our team of analysts can also provide you data in crude raw excel files pivot tables (Fact book) or can assist you in creating presentations from the data sets available in the report.


