
Middle East And Africa Cleanroom Particle Counters Market
Market Size in USD Billion
 USD
2.60 Billion
USD
4.20 Billion
2025
2033
USD
2.60 Billion
USD
4.20 Billion
2025
2033
| 2026 - 2033 | |
| USD 2.60 Billion | |
| USD 4.20 Billion | |
| % | |
|
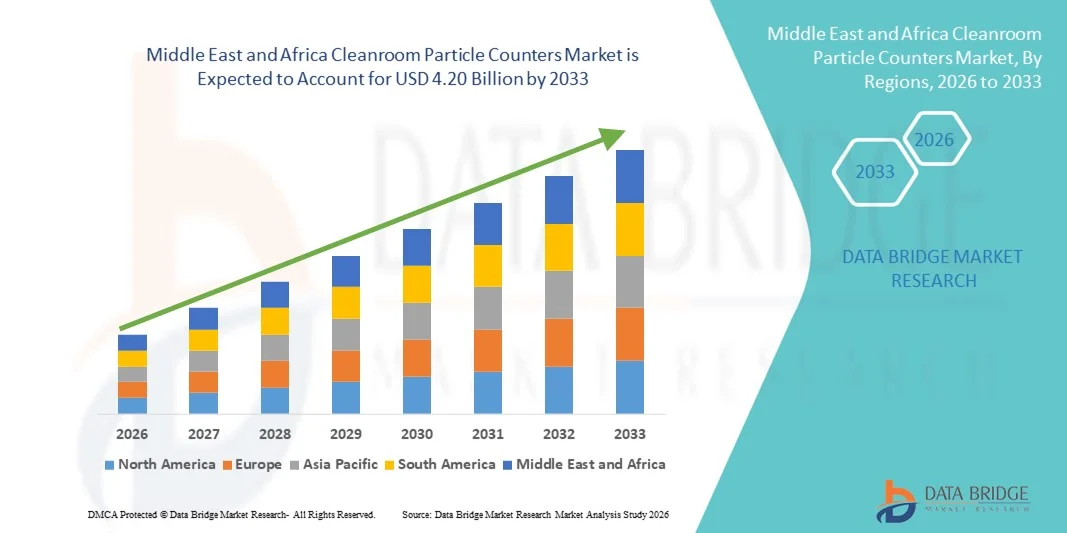
Middle East and Africa Cleanroom Particle Counters Market Size
- The Middle East and Africa cleanroom particle counters market size was valued at USD 2.60 billion in 2025 and is expected to reach USD 4.20 billion by 2033, at a CAGR of 6.20% during the forecast period
- The market growth is largely fueled by the increasing demand for contamination control and stringent regulatory standards across industries such as pharmaceuticals, biotechnology, medical devices, and semiconductor manufacturing, leading to greater adoption of cleanroom particle counters for maintaining controlled environments and ensuring product quality
- Furthermore, rising investments in advanced manufacturing facilities, expanding research and development activities, and growing emphasis on compliance with GMP, ISO, and FDA standards are establishing cleanroom particle counters as essential monitoring tools in critical production environments. These converging factors are accelerating the uptake of Cleanroom Particle Counters solutions, thereby significantly boosting the industry's growth
Middle East and Africa Cleanroom Particle Counters Market Analysis
- Cleanroom particle counters, designed to detect and measure airborne particles in controlled environments, are increasingly vital components of contamination control systems across pharmaceutical, biotechnology, semiconductor, and medical device manufacturing facilities due to their ability to ensure regulatory compliance, product quality, and operational safety
- The escalating demand for cleanroom particle counters is primarily fueled by stringent regulatory requirements such as GMP, ISO 14644, and FDA standards, growing investments in sterile manufacturing facilities, and the rising need for real-time environmental monitoring to minimize contamination risks in critical production processes
- Saudi Arabia dominated the Middle East and Africa cleanroom particle counters market with the largest revenue share of 27.6% in 2025, driven by expanding pharmaceutical manufacturing facilities, increasing investments in biotechnology and healthcare infrastructure under Vision 2030, and rising focus on regulatory compliance in controlled production environments. The country’s growing number of hospital laboratories, sterile drug manufacturing units, and research centers is significantly contributing to the demand for advanced particle monitoring systems
- The U.A.E. is expected to be the fastest-growing market in the Middle East and Africa during the forecast period, supported by rapid expansion of pharmaceutical free zones, increasing investments in life sciences and advanced manufacturing, and strong growth in healthcare infrastructure. The U.A.E. accounted for approximately 19.8% of the regional market share in 2025, and its focus on high-standard cleanroom facilities and international regulatory compliance is accelerating the adoption of cleanroom particle counter
- The Large Facilities segment dominated with a revenue share of 48.5% in 2025, driven by the presence of high-capacity cleanrooms in pharmaceutical manufacturing, biotechnology production, and semiconductor fabs
Report Scope and Cleanroom Particle Counters Market Segmentation
|
Attributes |
Cleanroom Particle Counters Key Market Insights |
|
Segments Covered |
|
|
Countries Covered |
Middle East and Africa
|
|
Key Market Players |
|
|
Market Opportunities |
|
|
Value Added Data Infosets |
In addition to the insights on market scenarios such as market value, growth rate, segmentation, geographical coverage, and major players, the market reports curated by the Data Bridge Market Research also include in-depth expert analysis, patient epidemiology, pipeline analysis, pricing analysis, and regulatory framework. |
Middle East and Africa Cleanroom Particle Counters Market Trends
Advancements in Real-Time Monitoring and Data Integration
- A significant and accelerating trend in the global cleanroom particle counters market is the increasing adoption of advanced real-time monitoring systems integrated with centralized data management platforms. These systems enable continuous tracking of airborne particle concentrations to ensure strict compliance with cleanroom standards across industries such as pharmaceuticals, biotechnology, semiconductors, and healthcare
- For instance, leading manufacturers are introducing portable and remote particle counters equipped with touch-screen interfaces and cloud-based data storage capabilities, allowing facility managers to monitor contamination levels across multiple cleanroom zones simultaneously
- The integration of remote monitoring capabilities enables instant alerts when particle counts exceed permissible thresholds, helping prevent product contamination and production downtime. This is particularly critical in pharmaceutical manufacturing environments where maintaining ISO and GMP compliance is mandatory
- Increasing emphasis on regulatory compliance and quality assurance is encouraging the deployment of continuous environmental monitoring systems rather than periodic manual testing. Cleanroom particle counters are now being integrated into broader environmental monitoring frameworks alongside microbial air samplers and HVAC validation systems
- This shift toward automated, high-precision, and network-enabled particle monitoring solutions is reshaping contamination control strategies across controlled environments, driving innovation and product development in the market
Middle East and Africa Cleanroom Particle Counters Market Dynamics
Driver
Stringent Regulatory Standards and Expanding Pharmaceutical Manufacturing
- The growing enforcement of stringent regulatory standards related to contamination control in pharmaceutical, biotechnology, and medical device manufacturing is a major driver of the Cleanroom Particle Counters market. Regulatory authorities require continuous air quality monitoring to ensure compliance with ISO cleanroom classifications and GMP guidelines
- The rapid expansion of pharmaceutical production facilities, vaccine manufacturing units, and biologics research centers globally is significantly increasing demand for reliable particle monitoring systems
- For instance, the expansion of sterile injectable manufacturing plants and semiconductor fabrication units in Asia-Pacific and North America has led to increased installation of fixed and portable particle counters to maintain validated cleanroom conditions
- In addition, the rise in semiconductor manufacturing and precision electronics production, where even microscopic contamination can cause product defects, is further strengthening the need for high-sensitivity particle counting equipment
- Increasing investments in healthcare infrastructure and life sciences research laboratories are also contributing to steady market growth
Restraint/Challenge
High Equipment Costs and Maintenance Requirements
- The high initial cost of advanced cleanroom particle counters, particularly remote and high-sensitivity models, acts as a restraint for small- and mid-sized manufacturing facilities
- For instance, multi-channel particle counters with integrated data logging and compliance software can require significant capital investment, limiting adoption in cost-sensitive markets
- Regular calibration, maintenance, and validation requirements add to operational expenses, as these devices must meet strict accuracy and regulatory standards
- Technical complexity and the need for skilled personnel to operate and interpret monitoring data can further challenge smaller facilities lacking specialized expertise
- Addressing cost barriers through product standardization, scalable monitoring solutions, and simplified maintenance processes will be essential to ensure broader market penetration and sustained industry growth
Middle East and Africa Cleanroom Particle Counters Market Scope
The market is segmented on the basis of type, particle size, flow rate capacity, facility, end user, and distribution channel.
- By Type
On the basis of type, the Global Cleanroom Particle Counters market is segmented into Portable Particle Counter, Handheld Particle Counter, and Remote Particle Counter. The Portable Particle Counter segment dominated the largest market revenue share of 39.6% in 2025, driven by its widespread adoption across pharmaceutical and semiconductor cleanrooms for routine monitoring and validation. Portable systems offer flexibility, high accuracy, and compliance with ISO 14644 and GMP standards. These devices are widely used for cleanroom certification, HVAC testing, and contamination troubleshooting. Growing regulatory enforcement in sterile manufacturing environments supports demand. Their ability to measure multiple particle sizes simultaneously enhances operational efficiency. Pharmaceutical production expansion globally further boosts procurement. Portable models are preferred for periodic monitoring in medium to large facilities. Technological advancements have improved battery life and data logging capabilities. Increasing adoption in hospital compounding pharmacies strengthens usage. Demand for contamination control in vaccine manufacturing also contributes to growth. Rising cleanroom construction projects globally support equipment sales. The combination of reliability and mobility ensures continued dominance.
The Remote Particle Counter segment is anticipated to witness the fastest CAGR of 9.2% from 2026 to 2033, fueled by increasing automation in cleanroom monitoring systems. Remote systems enable continuous real-time monitoring and integration with facility management software. Growing demand for uninterrupted contamination control in semiconductor fabs drives adoption. These counters reduce manual intervention and enhance data accuracy. Increasing use in high-grade ISO Class 1–3 cleanrooms supports growth. Integration with IoT-based platforms enables predictive maintenance and compliance reporting. Pharmaceutical manufacturers increasingly prefer centralized monitoring systems. Rising investment in smart manufacturing facilities accelerates demand. Remote systems improve operational transparency and audit readiness. The need for 24/7 environmental monitoring further strengthens adoption. Expanding biologics and cell therapy production facilities boost segment growth. Continuous innovation in sensor miniaturization enhances installation flexibility.
- By Particle Size
On the basis of particle size, the market is segmented into 0.1 µm–0.2 µm, 0.2 µm–0.3 µm, 0.3 µm–0.5 µm, 0.5 µm–5 µm, and More than 5 µm. The 0.3 µm–0.5 µm segment held the largest market revenue share of 31.8% in 2025, as this range is widely used as a standard reference for cleanroom classification under ISO guidelines. Most regulatory frameworks require monitoring at 0.3 µm and 0.5 µm thresholds. Pharmaceutical sterile manufacturing heavily relies on this particle size range. Semiconductor fabrication also requires precise monitoring at this level. These particle sizes are critical indicators of airborne contamination. Equipment calibrated for this range is highly standardized. Growing global compliance requirements sustain demand. Hospitals and research labs also prioritize this measurement range. Continuous quality audits in drug production further support dominance. The range balances sensitivity and operational practicality. Expanding GMP enforcement globally drives adoption. Increased focus on sterile injectables manufacturing reinforces segment strength.
The 0.1 µm–0.2 µm segment is projected to register the fastest CAGR of 10.4% from 2026 to 2033, driven by rising demand from advanced semiconductor and nanotechnology industries. Ultra-fine particle detection is essential in microelectronics manufacturing. Increasing production of smaller chip nodes requires enhanced contamination control. Growth in nanopharmaceutical research supports demand. These counters offer higher sensitivity for critical clean environments. Expanding investments in high-precision fabrication plants accelerate growth. Regulatory tightening in biologics manufacturing also drives adoption. Technological advancements have improved detection efficiency at ultra-low sizes. Rising R&D activities in biotechnology strengthen market potential. Emerging cleanroom standards in advanced industries further boost uptake. The demand for real-time ultra-fine monitoring systems increases globally. Continuous innovation in laser detection technology enhances reliability.
- By Flow Rate Capacity
On the basis of flow rate capacity, the market is segmented into Low Flow, Standard Flow, and High Flow. The Standard Flow segment accounted for the largest revenue share of 44.5% in 2025, as it offers a balanced sampling rate suitable for most pharmaceutical and industrial cleanrooms. Standard flow systems provide reliable particle counting with moderate operational costs. They are widely used in ISO Class 5–8 cleanrooms. Pharmaceutical production facilities prefer standard flow for validation and monitoring. These systems ensure compliance without excessive energy use. Their versatility supports use across multiple industries. Increasing regulatory inspections strengthen adoption. Growing vaccine and injectable drug production boosts demand. Standard flow counters offer accurate and repeatable results. Their compatibility with portable and remote systems enhances flexibility. Expansion of clean manufacturing environments supports sustained sales. Balanced cost-performance ratio ensures dominance.
The High Flow segment is expected to witness the fastest CAGR of 8.9% from 2026 to 2033, driven by demand for rapid sampling in large cleanroom areas. High flow systems reduce sampling time significantly. Semiconductor fabs require quick and precise contamination detection. Large pharmaceutical plants benefit from faster monitoring cycles. These systems enhance efficiency during certification processes. Growing large-scale biologics production supports demand. Increased construction of mega-fabrication facilities drives growth. Technological improvements reduce system noise and energy consumption. High flow counters improve productivity in industrial settings. Expansion of large hospital sterile units further supports adoption. Rising quality assurance standards strengthen segment expansion.
- By Facility
On the basis of facility, the market is segmented into Small Facilities and Large Facilities. The Large Facilities segment dominated with a revenue share of 48.5% in 2025, driven by the presence of high-capacity cleanrooms in pharmaceutical manufacturing, biotechnology production, and semiconductor fabs. Large-scale operations require continuous particle monitoring to comply with stringent GMP, ISO, and FDA regulations. Expansion of biologics and vaccine manufacturing globally increases adoption of cleanroom particle counters. Advanced research labs and contract manufacturing organizations (CMOs) rely on high-throughput monitoring systems. Large cleanrooms demand integration with facility management systems for real-time contamination tracking. Regulatory inspections necessitate validated monitoring protocols. The growing trend of automated cleanroom operations further reinforces demand. High initial investments are offset by the critical need for contamination control. Multi-product facilities also benefit from scalable particle counter solutions. Rising R&D spending globally supports equipment procurement. Government initiatives for pharmaceutical and semiconductor expansion drive market growth.
The Small Facilities segment is projected to grow at the fastest CAGR of 8.9% from 2026 to 2033, fueled by the increasing adoption of compact cleanrooms in research labs, startups, and specialty production units. Small-scale pharmaceutical and biotech labs require portable or handheld particle counters for flexibility and cost efficiency. Growing interest in cell therapy, gene therapy, and personalized medicine promotes cleanroom setups in smaller facilities. Academic institutions and pilot-scale manufacturing also drive adoption. Compact cleanroom designs and modular setups require sensitive, low-footprint particle monitoring solutions. Increasing availability of affordable, easy-to-use counters supports small facility growth. Regulatory guidance for even small production units enforces contamination monitoring. The expansion of localized semiconductor testing labs adds to adoption. Startups and niche R&D centers prefer versatile particle counters capable of multi-facility use. Overall, the rising number of small cleanroom facilities globally underlines a strong growth trajectory for this segment.
- By End User
On the basis of end user, the market is segmented into Pharmaceutical and Biotechnology Industry, Semiconductor and Electronics Industry, Chemical Industry, and Others. The Pharmaceutical and Biotechnology Industry segment dominated with a revenue share of 42.7% in 2025, driven by stringent GMP regulations and contamination control requirements. Vaccine manufacturing expansion globally increases demand. Rising biologics and cell therapy production further boosts adoption. Regulatory inspections mandate continuous monitoring. Growing sterile injectable production supports equipment sales. Pharmaceutical cleanrooms require validated particle monitoring systems. Expanding R&D laboratories enhance procurement. Increasing healthcare expenditure globally strengthens growth. Quality assurance programs reinforce monitoring requirements. Government regulations ensure sustained demand. Growing outsourcing to contract manufacturing organizations further supports adoption.
The Semiconductor and Electronics Industry segment is projected to grow at the fastest CAGR of 9.8% from 2026 to 2033, fueled by rapid expansion of chip manufacturing facilities worldwide. Advanced node fabrication requires ultra-clean environments. Rising demand for consumer electronics accelerates production. Increasing investment in semiconductor fabs supports equipment demand. Cleanroom standards in electronics manufacturing are becoming stricter. Growth in AI and high-performance computing increases chip production. Expansion of electric vehicle electronics boosts semiconductor manufacturing. Continuous innovation in microelectronics strengthens contamination control needs. Governments are investing heavily in domestic chip production. Technological miniaturization further increases monitoring sensitivity requirements.
- By Distribution Channel
On the basis of distribution channel, the market is segmented into Direct Tenders and Third Party Distributors. The Direct Tenders segment held the largest market revenue share of 53.1% in 2025, driven by bulk procurement by pharmaceutical manufacturers and semiconductor fabrication plants. Large facilities prefer direct purchasing for cost efficiency. Direct contracts ensure long-term service agreements. Manufacturers provide installation and calibration services. Government-funded cleanroom projects often procure through tenders. Direct supply reduces intermediary costs. Increasing infrastructure expansion supports tender-based buying. Institutional buyers prioritize standardized equipment procurement. Long-term contracts strengthen supplier relationships.
The Third Party Distributors segment is expected to witness the fastest CAGR of 8.5% from 2026 to 2033, driven by expanding demand from small and medium cleanroom facilities. Distributors provide flexible purchasing options. They ensure quick delivery and local service support. Smaller laboratories rely heavily on distributor networks. Expanding regional markets strengthen distribution channels. After-sales services enhance customer retention. Growing healthcare and research labs support sales growth. Competitive pricing strategies further boost adoption.
Middle East and Africa Cleanroom Particle Counters Market Regional Analysis
- The Middle East and Africa cleanroom particle counters market is projected to expand at a substantial CAGR throughout the forecast period
- Primarily driven by the rapid growth of pharmaceutical manufacturing, biotechnology research, and advanced healthcare infrastructure in the region
- Increasing regulatory oversight for sterile production environments, coupled with investments in high-standard cleanroom facilities, is fostering steady demand for particle monitoring systems across pharmaceuticals, biotechnology, and electronics sectors.
Saudi Arabia Cleanroom Particle Counters Market Insight
Saudi Arabia cleanroom particle counters market dominated the Middle East and Africa cleanroom particle counters market with the largest revenue share of 27.6% in 2025. Market growth is supported by expanding pharmaceutical manufacturing facilities, increasing investments in biotechnology and healthcare infrastructure under Vision 2030, and a rising focus on regulatory compliance in controlled production environments. The country’s growing number of hospital laboratories, sterile drug manufacturing units, and research centers is significantly contributing to the adoption of advanced cleanroom particle counters.
U.A.E. Cleanroom Particle Counters Market Insight
The U.A.E. cleanroom particle counters market is expected to be the fastest-growing market in the Middle East and Africa during the forecast period. This growth is supported by the rapid expansion of pharmaceutical free zones, increasing investments in life sciences and advanced manufacturing, and strong growth in healthcare infrastructure. The U.A.E. accounted for approximately 19.8% of the regional market share in 2025, and its focus on high-standard cleanroom facilities and international regulatory compliance is accelerating the adoption of particle monitoring systems.
Middle East and Africa Cleanroom Particle Counters Market Share
The Cleanroom Particle Counters industry is primarily led by well-established companies, including:
- TSI Incorporated (U.S.)
- Particle Measuring Systems (U.S.)
- Lighthouse Worldwide Solutions (U.S.)
- Beckman Coulter, Inc. (U.S.)
- RION Co., Ltd. (Japan)
- Climet Instruments Company (U.S.)
- Met One Instruments, Inc. (U.S.)
- Kanomax USA, Inc. (U.S.)
- PAMAS GmbH (Germany)
- Grimm Aerosol Technik GmbH & Co. KG (Germany)
- Aeroqual Limited (New Zealand)
- Fluke Corporation (U.S.)
- Extech Instruments (U.S.)
- Topas GmbH (Germany)
- Hach Company (U.S.)
- Sensirion AG (Switzerland)
- Setra Systems, Inc. (U.S.)
- Airy Technology (U.S.)
- Alphasense Ltd. (U.K.)
Latest Developments in Middle East and Africa Cleanroom Particle Counters Market
- In September 2021, Particle Measuring Systems launched the PRO Series of Contamination Instruments, a comprehensive lineup covering viable, non-viable, remote, and portable cleanroom particle counters designed to help manufacturers in pharmaceutical, semiconductor, and biotech industries improve contamination control and regulatory compliance
- In February 2021, Beckman Coulter Inc received industry recognition for its MET ONE 3400+ particle counter, which earned an award for innovation and value in pharmaceutical and healthcare applications, significantly increasing global visibility and adoption in regulated cleanroom environments
- In February 2023, TSI launched the AeroTrak+ Portable Particle Counter, offering simplified cleanroom classification and monitoring that meets global standards, helping technicians quickly assess and maintain air quality in critical manufacturing and pharmaceutical cleanrooms
- In October 2023, Particle Measuring Systems introduced the Lasair Pro Airborne Particle Counter, aimed at enhanced clean area monitoring and classification for critical environments such as pharmaceutical production lines and semiconductor fabrication plants, delivering robust particle counting performance for regulatory compliance
SKU-

- Interactive Data Analysis Dashboard
- Company Analysis Dashboard for high growth potential opportunities
- Research Analyst Access for customization & queries
- Competitor Analysis with Interactive dashboard
- Latest News, Updates & Trend analysis
- Harness the Power of Benchmark Analysis for Comprehensive Competitor Tracking
Data collection and base year analysis are done using data collection modules with large sample sizes. The stage includes obtaining market information or related data through various sources and strategies. It includes examining and planning all the data acquired from the past in advance. It likewise envelops the examination of information inconsistencies seen across different information sources. The market data is analysed and estimated using market statistical and coherent models. Also, market share analysis and key trend analysis are the major success factors in the market report. To know more, please request an analyst call or drop down your inquiry.
The key research methodology used by DBMR research team is data triangulation which involves data mining, analysis of the impact of data variables on the market and primary (industry expert) validation. Data models include Vendor Positioning Grid, Market Time Line Analysis, Market Overview and Guide, Company Positioning Grid, Patent Analysis, Pricing Analysis, Company Market Share Analysis, Standards of Measurement, Global versus Regional and Vendor Share Analysis. To know more about the research methodology, drop in an inquiry to speak to our industry experts.
Data Bridge Market Research is a leader in advanced formative research. We take pride in servicing our existing and new customers with data and analysis that match and suits their goal. The report can be customized to include price trend analysis of target brands understanding the market for additional countries (ask for the list of countries), clinical trial results data, literature review, refurbished market and product base analysis. Market analysis of target competitors can be analyzed from technology-based analysis to market portfolio strategies. We can add as many competitors that you require data about in the format and data style you are looking for. Our team of analysts can also provide you data in crude raw excel files pivot tables (Fact book) or can assist you in creating presentations from the data sets available in the report.


