
Middle East And Africa Dental Aligners Market
Market Size in USD Million
 USD
200.15 Million
USD
520.89 Million
2025
2033
USD
200.15 Million
USD
520.89 Million
2025
2033
| 2026 - 2033 | |
| USD 200.15 Million | |
| USD 520.89 Million | |
| % | |
|
What is the Middle East and Africa Dental Aligners Market Size and Overview?
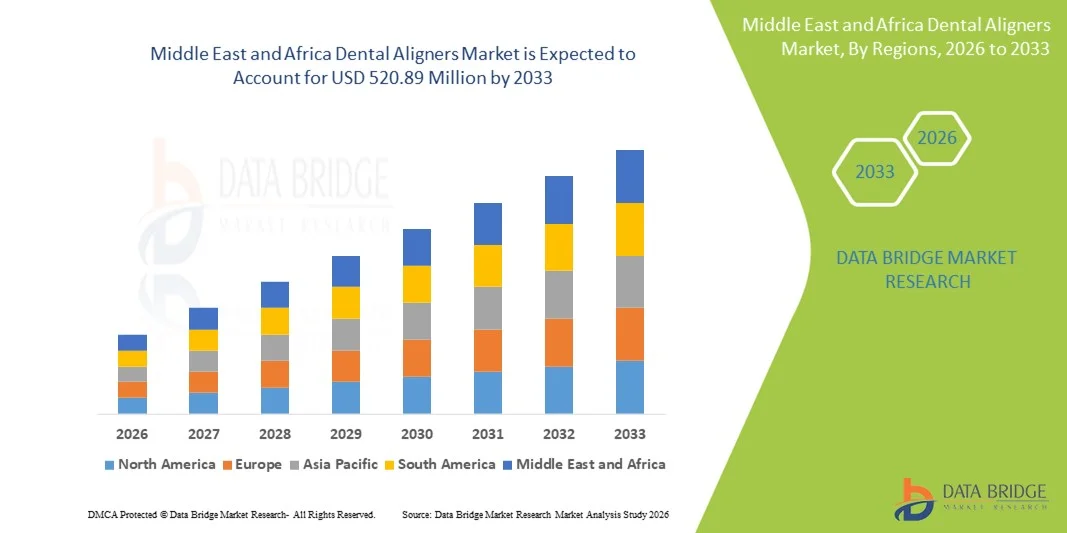
- The Middle East and Africa dental aligners market size was valued at USD 200.15 million in 2025 and is expected to reach USD 520.89 million by 2033, at a CAGR of 12.70% during the forecast period
- The market growth is largely fueled by increasing dental aesthetic awareness, rising adoption of digital orthodontic technologies, expanding private dental clinics, and growing investment in advanced dental treatments across urban centers in GCC countries and South Africa
- Furthermore, increased demand for comfortable and cosmetically appealing orthodontic solutions over traditional braces, coupled with expanding dental tourism and rising disposable incomes, is driving the uptake of dental aligners as a preferred corrective dental solution across both residential and commercial dental practices in the region
Market Size & Forecast
- Middle East and Africa Market Value (2025): USD 200.15 million
- Expected Market Value (2033): USD 520.89 million
- Forecast CAGR (2025–2033):12.70%
Middle East and Africa Dental Aligners Market Analysis
- Dental aligners, offering clear and removable orthodontic solutions for teeth straightening and alignment, are increasingly vital components of modern dental care in both clinical and cosmetic settings due to their aesthetic appeal, comfort, and compatibility with digital treatment planning
- The escalating demand for dental aligners is primarily fueled by growing awareness of dental aesthetics, rising adoption of advanced treatment plans such as In‑Office Aligners and At‑Home Aligners, and a preference for less visible, convenient alternatives to traditional braces
- Saudi Arabia dominated the dental aligners market with a revenue share of 22.3% in 2025, characterized by increasing dental clinics, higher disposable incomes, and a strong presence of key dental technology providers
- South Africa is expected to be the fastest-growing country in the dental aligners market during the forecast period due to rising awareness about oral health, expanding access to private dental care facilities, and increasing urbanization
- Adults segment dominated the dental aligners market with the largest share of 68.4% in 2025, driven by higher spending capacity, growing interest in cosmetic dentistry, and the effectiveness of aligners in addressing common issues such as malocclusion, crowding, and excessive spacing
Report Scope and Middle East and Africa Dental Aligners Market Segmentation
|
Attributes |
Middle East and Africa Dental Aligners Key Market Insights |
|
Segments Covered |
|
|
Countries Covered |
Middle East and Africa
|
|
Key Market Players |
|
|
Market Opportunities |
|
|
Value Added Data Infosets |
|
What is the Key Trend in the Middle East and Africa Dental Aligners Market?
Rising Adoption of Digital and Remote Treatment Solutions
- A significant and accelerating trend in the Middle East and Africa dental aligners market is the growing adoption of digital treatment planning and remote orthodontic solutions such as In‑Office and At‑Home Aligners, enhancing convenience, customization, and treatment efficiency for patients
- For instance, SmileDirectClub and local providers in UAE offer At‑Home Aligners that allow patients to complete orthodontic treatments remotely with digital scans and virtual monitoring, reducing the need for frequent clinic visits
- Digital integration in aligner treatments enables features such as 3D scanning for precise teeth modeling, AI-assisted treatment planning, and monitoring patient progress remotely, improving accuracy and patient compliance
- The seamless combination of digital orthodontics with mobile applications allows patients to track progress, receive alerts for aligner changes, and communicate with orthodontists virtually, creating a unified and convenient treatment experience
- This trend toward digitalized, patient-centric, and remote orthodontic care is reshaping expectations for dental treatments, prompting companies such as Align Technology to develop AI-assisted treatment plans and remote monitoring solutions
- The demand for digitally integrated and remotely accessible aligner solutions is growing rapidly across both adult and teenage patient segments, as consumers increasingly prioritize convenience, aesthetics, and effective treatment outcomes
- Increasing collaboration between dental labs and aligner manufacturers to provide fully customized, faster turnaround aligners is creating more tailored and efficient orthodontic solutions, enhancing patient satisfaction
Middle East and Africa Dental Aligners Market Dynamics
Driver
Growing Demand Due to Aesthetic Awareness and Orthodontic Needs
- The increasing focus on dental aesthetics, rising prevalence of malocclusion, and growing interest in non-invasive orthodontic treatments are significant drivers for the heightened demand for dental aligners
- For instance, in 2024, Align Technology expanded its operations in Saudi Arabia and UAE to meet the increasing demand for Invisalign treatments, highlighting the market potential for premium aligner solutions
- As consumers become more conscious about cosmetic appearance and oral health, aligners offer discreet, removable, and comfortable alternatives to traditional braces, driving adoption among adults and teenagers
- Furthermore, the growing number of private dental clinics equipped with digital orthodontic technologies facilitates access to aligner treatments, making them an integral part of modern orthodontic care
- The convenience of remote monitoring, reduced clinic visits, and custom-fit treatment plans tailored to individual patient needs are key factors propelling the adoption of dental aligners across the Middle East and Africa
- Increasing government initiatives and insurance support for dental health in countries such as UAE and Saudi Arabia are providing further incentives for patients to choose aligners over traditional braces
- Rising social media influence and aesthetic-driven consumer behavior are motivating adults and teenagers to opt for invisible aligners as a modern and lifestyle-friendly orthodontic solution
Restraint/Challenge
High Costs and Limited Awareness in Emerging Areas
- The relatively high cost of advanced aligner treatments compared to traditional braces poses a significant challenge to widespread adoption, especially in price-sensitive markets within the Middle East and Africa
- For instance, Invisalign treatments in Saudi Arabia and UAE are priced higher than conventional orthodontics, limiting access for budget-conscious patients despite the clinical advantages
- In addition, limited awareness about aligners and digital orthodontic solutions in rural and less urbanized areas restricts market penetration, as patients may prefer traditional braces due to familiarity and lower cost
- Addressing these barriers through consumer education, localized marketing campaigns, and the introduction of more affordable aligner options is crucial for expanding the market in emerging regions
- While premium clinics in urban centers continue to drive high-end adoption, expanding cost-effective solutions and raising awareness remain key challenges for sustained growth in the region
- The need for specialized orthodontists trained in digital aligner systems can slow adoption in countries with limited professional expertise, particularly outside major cities
- Cultural perceptions and skepticism regarding remote or self-managed orthodontic treatments can hinder acceptance, requiring targeted educational initiatives to build consumer confidence
Middle East and Africa Dental Aligners Market Scope
The market is segmented on the basis of product & services, age group, raw material, application, treatment plan, end user, and distribution channel.
- Product and Services
On the basis of product and services, the market is segmented into products and services. The Products segment dominated the market in 2025, accounting for the largest revenue share. This is due to the increasing preference for pre-fabricated clear aligners and customized orthodontic solutions among clinics and individual users. Products include the aligners themselves, trays, and accessories required for treatment. The strong adoption is fueled by awareness about dental aesthetics and the increasing number of private dental clinics in Saudi Arabia, UAE, and South Africa. Patients prefer tangible products that can be directly used for treatment under professional supervision. In addition, companies are continually innovating products with enhanced materials and digital customization, which adds to the segment’s dominance.
The Services segment is expected to witness the fastest growth from 2026 to 2033, driven by rising demand for professional orthodontic consultations, remote monitoring services, and tele-dentistry support. Services such as virtual scanning, treatment planning, and follow-up consultations allow dental clinics to cater to patients remotely, particularly teenagers and adults who prefer convenience. The expansion of services also supports at-home treatment plans, creating new opportunities for service-based revenue models. Clinics offering bundled products and services are gaining a competitive edge, enhancing patient satisfaction and treatment outcomes.
- By Age Group
On the basis of age group, the market is segmented into adults, teenagers, and children. The Adults segment dominated the market in 2025 with the largest revenue share of 68.4%, as adults are increasingly investing in cosmetic and corrective dental treatments. Adults are more willing to spend on premium aligners for aesthetic reasons, and the rising influence of social media and professional appearance concerns drives adoption. Urban populations in UAE, Saudi Arabia, and South Africa show a strong preference for invisible aligners due to lifestyle and work-related aesthetics. In addition, adults benefit from both in-office and at-home treatment plans, making them the primary revenue contributors. Clinics often prioritize adult patients for marketing campaigns, contributing further to this segment's dominance.
The Teenagers segment is expected to witness the fastest growth during the forecast period, fueled by the rising awareness among parents about early orthodontic intervention and the increasing availability of teen-specific aligners. Teenagers benefit from treatments that are comfortable, removable, and less socially noticeable than traditional braces. Schools and pediatric dental programs promoting oral health also contribute to market growth. Digital treatment planning and remote monitoring solutions increase convenience for parents managing teen orthodontics, further driving adoption.
- By Raw Material
On the basis of raw material, the market is segmented into Thermoplastic Polyurethanes (TPU), Polyethylene Terephthalate (PET), Polyethylene Terephthalate Glycol (PETG), and Others. The Thermoplastic Polyurethanes (TPU) segment dominated the market in 2025 due to its superior flexibility, clarity, and durability, which enhance comfort and treatment effectiveness. TPU aligners are widely preferred in Saudi Arabia, UAE, and South Africa for both in-office and at-home treatments. Clinics favor TPU for its compatibility with digital scanning and 3D printing technologies, ensuring precise fit and better patient compliance. Its resistance to deformation over long treatment periods ensures predictable orthodontic outcomes. The material’s widespread availability and adaptability in advanced treatment plans further support dominance.
The Polyethylene Terephthalate Glycol (PETG) segment is expected to witness the fastest growth during the forecast period, driven by cost-effectiveness, ease of fabrication, and transparency. PETG aligners are increasingly adopted for at-home treatment plans, where affordability is a key factor. Innovations in PETG formulations are improving durability and aesthetics, making it a viable alternative to TPU. Rising awareness of material options among orthodontists and patients is further fueling adoption.
- By Application
On the basis of application, the market is segmented into malocclusion, crowding, excessive spacing, and others. The Malocclusion segment dominated the market in 2025, accounting for the largest revenue share due to its high prevalence across adult and teenage populations. Aligners provide effective correction of malocclusion with minimal visibility and discomfort compared to traditional braces. Clinics in Saudi Arabia and UAE focus on this application for adult patients seeking cosmetic enhancement. Malocclusion treatments require precise digital planning, which increases reliance on advanced aligner products. Increasing patient preference for non-invasive solutions also boosts the segment’s dominance. Dental professionals often recommend aligners as the first choice for mild to moderate malocclusion cases, further strengthening this segment.
The Excessive Spacing segment is expected to witness the fastest growth during the forecast period, driven by rising aesthetic awareness and demand for cosmetic dental correction among adults and teenagers. Spacing issues are highly visible and motivate patients to opt for discreet aligner treatments. Technological advancements in scanning and customized aligners allow for efficient correction, even in severe cases. Social media influence and aesthetic-driven consumer behavior amplify demand, particularly in urban populations.
- By Treatment Plan
On the basis of treatment plan, the market is segmented into in-office aligners and at-home aligners. The In-Office Aligners segment dominated the market in 2025 due to its widespread adoption in established dental clinics across Saudi Arabia, UAE, and South Africa. In-office aligners provide professional supervision, better treatment accuracy, and access to advanced dental technologies, which increases trust and preference among patients. Clinics benefit from offering in-office treatments as a premium service, driving higher revenue. Patients prefer in-office options for complex orthodontic cases requiring closer monitoring. In addition, the segment’s dominance is reinforced by extensive marketing and awareness campaigns by leading dental providers.
The At-Home Aligners segment is expected to witness the fastest growth during the forecast period, fueled by rising demand for convenient, remote orthodontic solutions that allow patients to manage treatment from home. Tele-dentistry platforms, mobile applications for progress tracking, and virtual consultations enhance patient experience. This segment particularly appeals to working adults and teenagers who seek flexible treatment schedules. Increasing digital adoption and remote monitoring technologies are accelerating growth.
- By End User
On the basis of end user, the market is segmented into dental clinics, hospitals, orthodontic clinics, and others. The Dental Clinics segment dominated the market in 2025 with the largest revenue share, as private clinics in UAE, Saudi Arabia, and South Africa serve as the primary point for orthodontic treatments. Clinics offer both product and service-based aligner solutions, supported by professional staff and digital infrastructure. High patient footfall, trust in clinic-provided treatments, and availability of multiple treatment plans contribute to dominance. Clinics also engage in marketing and patient education, further strengthening adoption. Advanced digital scanning and customization capabilities make clinics a preferred end-user segment.
The Orthodontic Clinics segment is expected to witness the fastest growth during the forecast period, driven by specialized expertise, better patient outcomes, and a rising number of teen and adult patients seeking cosmetic treatments. Orthodontic clinics focus on personalized treatment plans and high-quality aligner solutions, making them increasingly attractive. Collaboration with digital labs and tele-dentistry platforms enhances service efficiency. Growth in private orthodontic centers in urban centers contributes to segment expansion.
- By Distribution Channel
On the basis of distribution channel, the market is segmented into direct sales and third-party distributors. The Direct Sales segment dominated the market in 2025, accounting for the largest revenue share, as manufacturers increasingly supply aligners directly to dental clinics, hospitals, and orthodontic centers. Direct engagement ensures better margins, customization, and timely delivery. Clinics prefer direct supply for access to the latest product innovations, digital support, and bulk purchasing benefits. Manufacturers also provide training and technical support to clinics under direct sales agreements. High adoption in urban centers contributes to the segment’s dominance.
The Third-Party Distributors segment is expected to witness the fastest growth during the forecast period, driven by expanding reach into emerging markets and rural areas where direct sales are limited. Distributors enable access to smaller clinics and hospitals that cannot source products directly. Partnerships with local distributors also help manufacturers navigate regulatory and logistical challenges. The convenience, cost-effectiveness, and wider market coverage provided by distributors are key growth factors.
Middle East and Africa Dental Aligners Market Regional Analysis
- Saudi Arabia dominated the dental aligners market with a revenue share of 22.3% in 2025, characterized by increasing dental clinics, higher disposable incomes, and a strong presence of key dental technology providers
- Patients in these countries highly value the convenience, aesthetic appeal, and effectiveness offered by clear aligners compared to traditional braces, along with the ability to choose between in-office and at-home treatment plans
- This widespread adoption is further supported by higher disposable incomes, urbanized populations, and the growing preference for professional dental care with advanced technologies, establishing aligners as the preferred orthodontic solution for both adults and teenagers in the region
The Saudi Arabia Dental Aligners Market Insight
The Saudi Arabia dental aligners market captured the largest revenue share of 22.3% in 2025 within the Middle East and Africa, fueled by the increasing adoption of digital orthodontic solutions and growing awareness of cosmetic dentistry. Consumers are increasingly prioritizing aesthetic dental treatments and convenient, removable options over traditional braces. The rising number of private dental clinics, coupled with the availability of both in-office and at-home aligner treatment plans, further propels the market. Moreover, growing urbanization, higher disposable incomes, and social media influence on cosmetic appearance are significantly contributing to the market's expansion.
United Arab Emirates Dental Aligners Market Insight
The UAE dental aligners market is projected to expand at a substantial CAGR during the forecast period, primarily driven by rising dental tourism and the demand for cosmetic orthodontic treatments. The increase in awareness about oral health, coupled with the availability of technologically advanced aligners, is fostering adoption across adults and teenagers. UAE consumers are also attracted to the convenience and precision offered by digital scanning and 3D-printed aligners. The region is witnessing significant growth across private clinics, hospitals, and specialized orthodontic centers.
South Africa Dental Aligners Market Insight
The South Africa dental aligners market is anticipated to grow at a noteworthy CAGR during the forecast period, driven by rising awareness of dental aesthetics and the increasing number of orthodontic clinics offering advanced treatment options. In addition, growing urban populations and higher disposable incomes are encouraging patients to adopt aligners. South Africa’s dental industry is embracing digital orthodontics, allowing precise treatment planning and improved patient experience. Both in-office and at-home treatment plans are gaining traction, particularly among working adults and teenagers.
Nigeria Dental Aligners Market Insight
The Nigeria dental aligners market is expected to expand at a considerable CAGR during the forecast period, fueled by increasing awareness of cosmetic dentistry and oral health. Rising urbanization and a growing middle-class population are promoting the adoption of aligners in metropolitan areas such as Lagos and Abuja. The integration of digital treatment planning and tele-dentistry platforms is making aligners more accessible. Affordability remains a challenge, but increasing investments by local clinics and dental chains are driving gradual market growth.
Which are the Top Companies in Middle East and Africa Dental Aligners Market?
The Middle East and Africa Dental Aligners industry is primarily led by well-established companies, including:
- Align Technology, Inc. (U.S.)
- AccuAligners (Saudi Arabia)
- Smartee Denti Technology Co., Ltd (China)
- ParisAline (UAE)
- SA Aligner (Saudi Arabia)
- ClearCorrect (Switzerland)
- SparkAligners (U.S.)
- Angelalign Technology Inc. (China)
- AlignerCo (U.S.)
- OrthoFX (U.S.)
- NewSmileUSA (U.S.)
- Reveal Clear Aligners (U.S.)
- CandidPro (U.S.)
- SureSmile (U.S.)
- SMILE2IMPRESS (Spain)
- BASMA (U.K.)
- Essix (U.S.)
- uLab Systems (U.S.)
- Byte (U.S.)
- 3M (U.S.)
What are the Recent Developments in Middle East and Africa Dental Aligners Market?
- In June 2025, Align Technology successfully concluded its Invisalign® Roadshow in Riyadh and Dubai, delivering full‑day clinical education programs for trained doctors, introducing new digital orthodontic tools such as the Palatal Expander System and mandibular advancement features, and enhancing complex case planning expertise in the region
- In May 2025, Align Technology launched a professional marketing initiative featuring doctors in digital orthodontics across the Europe, Middle East & Africa (EMEA) region, celebrating stories of transforming smiles with Invisalign clear aligners and underscoring the growing digital orthodontic ecosystem in the Middle East
- In June 2024, Align Technology hosted a Growing Patients Roadshow series across Riyadh, Jeddah, Kuwait City, and Dubai, aimed at educating dental professionals on digital workflows and accelerating treatment outcomes for children and teens using clear aligners, demonstrating expanding clinical adoption in key Gulf markets
- In February 2023, the Straumann Group partnered with Al Hayat Pharmaceuticals to introduce ClearCorrect Aligners in the UAE, significantly broadening the range of clear aligner options available to clinicians and patients in the Middle East
- In February 2023, Align Technology announced the launch of its Invisalign Moderate package across the Middle East, including Saudi Arabia and the UAE, giving clinicians a new treatment option for mild‑to‑moderate malocclusions and strengthening the region’s digital orthodontics offerings
SKU-

- Interactive Data Analysis Dashboard
- Company Analysis Dashboard for high growth potential opportunities
- Research Analyst Access for customization & queries
- Competitor Analysis with Interactive dashboard
- Latest News, Updates & Trend analysis
- Harness the Power of Benchmark Analysis for Comprehensive Competitor Tracking
Data collection and base year analysis are done using data collection modules with large sample sizes. The stage includes obtaining market information or related data through various sources and strategies. It includes examining and planning all the data acquired from the past in advance. It likewise envelops the examination of information inconsistencies seen across different information sources. The market data is analysed and estimated using market statistical and coherent models. Also, market share analysis and key trend analysis are the major success factors in the market report. To know more, please request an analyst call or drop down your inquiry.
The key research methodology used by DBMR research team is data triangulation which involves data mining, analysis of the impact of data variables on the market and primary (industry expert) validation. Data models include Vendor Positioning Grid, Market Time Line Analysis, Market Overview and Guide, Company Positioning Grid, Patent Analysis, Pricing Analysis, Company Market Share Analysis, Standards of Measurement, Global versus Regional and Vendor Share Analysis. To know more about the research methodology, drop in an inquiry to speak to our industry experts.
Data Bridge Market Research is a leader in advanced formative research. We take pride in servicing our existing and new customers with data and analysis that match and suits their goal. The report can be customized to include price trend analysis of target brands understanding the market for additional countries (ask for the list of countries), clinical trial results data, literature review, refurbished market and product base analysis. Market analysis of target competitors can be analyzed from technology-based analysis to market portfolio strategies. We can add as many competitors that you require data about in the format and data style you are looking for. Our team of analysts can also provide you data in crude raw excel files pivot tables (Fact book) or can assist you in creating presentations from the data sets available in the report.


