
Middle East And Africa E Commerce Packaging Market
Market Size in USD Billion
 USD
2.82 Billion
USD
6.06 Billion
2025
2033
USD
2.82 Billion
USD
6.06 Billion
2025
2033
| 2026 - 2033 | |
| USD 2.82 Billion | |
| USD 6.06 Billion | |
| % | |
|
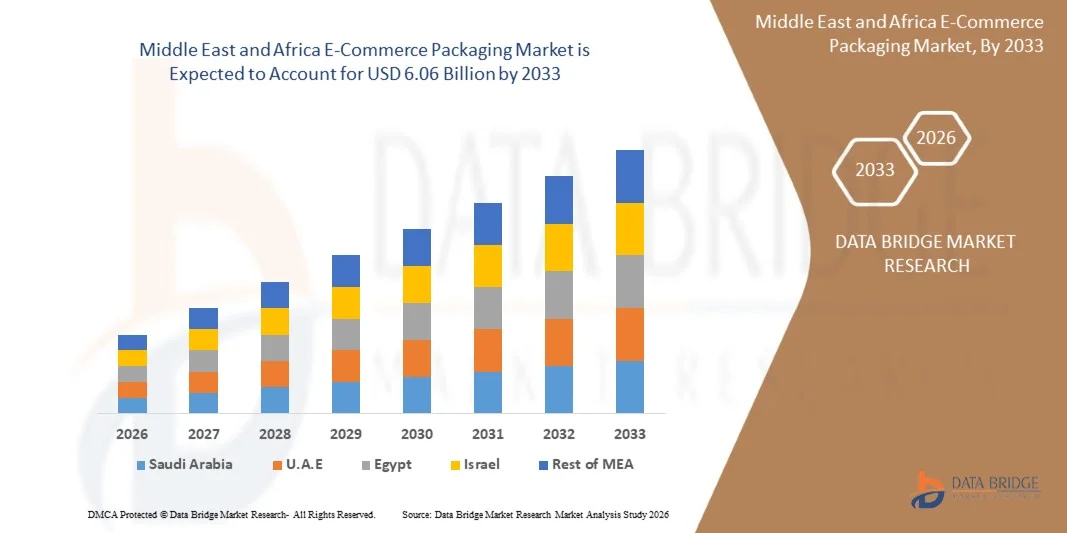
Middle East and Africa E-Commerce Packaging Market Size
- The Middle East and Africa E-Commerce Packaging Market was valued at USD 2.82 Billion in 2025 and is expected to reach USD 6.06 Billion by 2033
- During the forecast period of 2026 to 2033 the market is likely to grow at a CAGR of 10.1%, primarily driven by increasing consumer engagement in recreational, social, and family-oriented activities, which has significantly expanded the demand for strategy-based and educational board games—key categories that often rely on specialized, durable, and aesthetically appealing packaging formats.
- Additionally, the expansion of Middle East and Africa’s manufacturing and transportation infrastructure, combined with rising trade volumes across both domestic and international markets, is accelerating the adoption of advanced packaging solutions. The region’s strong emphasis on modern logistics, sustainability initiatives, and consumer convenience further supports consistent market momentum.
Middle East and Africa E-Commerce Packaging Market Analysis
- The Middle East and Africa E-Commerce Packaging Market is rapidly as brands integrate advanced technologies to improve efficiency, sustainability, and consumer engagement. While automation is traditionally associated with logistics and port operations, similar trends—such as digitalization, AI-driven analytics, automated stacking mechanisms, and intelligent inventory management—are increasingly shaping packaging operations across sectors including chemicals, food & beverage, pharmaceuticals, agriculture, construction, mining & minerals, waste & recycling, and consumer goods.
- These technologies are strengthening the region’s supply chain by reducing manual processes, accelerating delivery timelines, optimizing warehouse space, and supporting extensive online retail networks. Automated Stacking Cranes (ASCs), AI-guided systems, and advanced monitoring tools enable optimized storage, reduced handling time, and continuous visibility into inventory levels, helping manufacturers, distributors, and e-commerce platforms maintain supply consistency and reduce operational costs.
- The adoption of smart distribution platforms and predictive demand planning is further enhancing replenishment cycles, particularly during peak sales, new product launches, and promotional events.
- Saudi Arabia is expected to dominate the Middle East and Africa E-Commerce Packaging Market with the largest revenue share of 16.06% in 2026, driven by significant investments in logistics automation, digital infrastructure, and supply chain resilience initiatives. Major ports such as Los Angeles, Long Beach, and New York/New Jersey have already implemented ASCs, AGVs, and advanced Terminal Operating Systems (TOS) to improve throughput and reduce congestion, while key operators like APM Terminals, SSA Marine, and DP World continue to modernize handling equipment and operations.
- U.A.E. is expected to be the fastest-growing region in the Middle East and Africa E-Commerce Packaging Market during the forecast period with a CAGR of 10.7%, supported by rising containerized trade, modernization of logistics hubs, and the adoption of AI-enabled inventory tracking, autonomous vehicles, and remote-controlled cranes.
- In 2026, the Corrugated Boxes segment is expected to dominate the market with a 36.53% market share, as these packaging solutions offer an ideal balance of affordability, durability, scalability, and operational flexibility. Their ability to support high-volume e-commerce demand while maintaining cost efficiency makes them the preferred choice for manufacturers, distributors, and last-mile delivery companies across the region.
Report Scope and Middle East and Africa E-Commerce Packaging Market Segmentation
|
Attributes |
Middle East and Africa E-Commerce Packaging Key Market Insights |
|
Segments Covered |
|
|
Countries Covered |
Middle East and Africa
|
|
Key Market Players |
|
|
Market Opportunities |
|
|
Value Added Data Infosets |
In addition to the insights on market scenarios such as market value, growth rate, segmentation, geographical coverage, and major players, the market reports curated by the Data Bridge Market Research also include in-depth expert analysis, pricing analysis, brand share analysis, consumer survey, demography analysis, supply chain analysis, value chain analysis, raw material/consumables overview, vendor selection criteria, PESTLE Analysis, Porter Analysis, and regulatory framework. |
Middle East and Africa E-Commerce Packaging Market Trends
“Adoption of Automation and Right-Sizing Systems in Fulfillment”
- Adoption of automation and right-sizing systems in fulfillment has emerged as a significant opportunity for the Middle East and Africa E-Commerce Packaging Market. As order volumes scale and SKU diversity increases, manual packing and fulfillment processes have become costlier, slower and error-prone. Automation through robotics, AI-driven picking/packing systems and right-size packaging machinery offers enhanced efficiency, reduced labor dependency, consistent throughput and optimized material usage, all of which align closely with e-commerce demand and sustainability goals. This shift positions packaging automation as a value-adding lever for firms to reduce logistics costs, improve fulfilment speed and enable scalable growth.
- In January 2025, Smart-Robotics.io reported that by 2025 an estimated four million warehouse robots are expected to be installed across 50,000 warehouses in Middle East and Africa, with automation penetration set to rise from 18 % at end-2021 to 26 % by 2027.
- In September 2024, a press release noted that the Middle East and Africa packaging automation market (covering automated packing, sealing and labelling systems) was projected to rise from USD 64.70 billion in 2022 to USD 136.47 billion by 2032.
- In July 2025, a warehouse-automation blog on eShipz cited that automation in warehouse operations can reduce costs by up to 30 % and boost throughput by over 40 %, making automation a strategic necessity in dynamic, high-volume markets such as India.
- The growing adoption of automation and right-sizing systems in e-commerce fulfillment is creating a structural opportunity for packaging suppliers and technology providers. Automation reduces cost per package, accelerates throughput, improves accuracy and supports scalability. As fulfillment centers invest in robotics and right-sizing technology, demand for automated packaging lines, modular packaging systems and smart packaging solutions is expected to rise substantially, driving growth and innovation within the Middle East and Africa E-Commerce Packaging Market
Middle East and Africa E-Commerce Packaging Market Dynamics
Driver
“Regional Internet & Smartphone Penetration in Emerging Markets”
- Regional increases in internet and smartphone penetration across emerging markets have emerged as a key driver for growth in the Middle East and Africa E-Commerce Packaging Market. As more consumers gain reliable access to mobile internet—and smartphones become the primary gateway to online shopping—online retail penetration expands rapidly, generating greater demand for packaging across diverse geographies. This digital penetration fuels higher volumes of small-parcel shipments, frequent order cycles and amplified cross-border commerce, all of which increase the need for varied, scalable packaging solutions aligned with e-commerce logistics requirements.
- In October 2023, the International Telecommunication Union (ITU) reported that 78 per cent of the Middle East and Africa population aged 10 and over owned a mobile phone, a share 11 percentage points higher than Middle East and Africa Internet-use penetration.
- In October 2024, the GSMA State of Mobile Internet Connectivity report indicated that 4.6 billion people—approximately 57 per cent of the Middle East and Africa population—were using mobile internet on personal devices, pointing to accelerating digital penetration in emerging regions.
- In July 2025, the World Bank Middle East and Africa Findex Digital Connectivity Tracker revealed that in low- and middle-income countries, smartphone adoption and digital payment usage rose markedly, reflecting broader digital commerce capabilities and enabling e-commerce growth outside high-income regions.
- In October 2025, Middle East and Africa estimates indicated that approximately 6.04 billion individuals—about 73 per cent of the world population—used the Internet, underscoring the expanding digital consumer base that underpins demand for e-commerce packaging.
- Rising internet and smartphone penetration in emerging markets is expanding the addressable base for online retail, thereby driving higher demand for e-commerce packaging. As digital inclusion broadens, packaging suppliers can anticipate sustained volume growth and diversification of packaging formats, reinforcing packaging volume expansion as a structural growth lever for the Middle East and Africa E-Commerce Packaging Market
Restraint/Challenge
“Packaging Waste Regulations and Compliance Costs”
- Packaging waste regulations and compliance costs have emerged as a significant restraining factor for the Middle East and Africa E-Commerce Packaging Market. As regulators worldwide tighten rules on packaging design, material composition, recyclability, and waste responsibility, e-commerce companies face growing pressures, from redesigning packaging to meet new standards, increasing use of recycled materials, reducing empty space, and extending producer responsibility (EPR). These regulatory burdens raise compliance costs, complicate cross-border shipments, and can force firms to re-engineer supply chains or pass costs to consumers. For a market driven by speed, convenience and low-cost shipping, stricter packaging waste laws may dampen growth or limit margin expansion.
- In December 2024, India’s Environment Ministry introduced a draft of the Environment Protection (Extended Producer Responsibility for Packaging) Rules, 2024, which, once implemented from April 2026, will require producers, importers and brand-owners to manage the full lifecycle of packaging.
- In April 2024, the European Parliament reached a provisional agreement to adopt tougher packaging rules, including targets to reduce packaging waste by 5% by 2030 (10% by 2035, 15% by 2040), bans on many single-use plastic packaging formats, and requirements that all packaging be recyclable.
- In March 2024, the Council of the European Union and European Parliament reached a provisional deal to overhaul packaging and packaging waste regulation, tightening design, recyclability, and labelling standards for all packaging, including e-commerce shipments.
- In December 2024, the Council formally adopted the new Packaging and Packaging Waste Regulation 2025/40 (PPWR), setting binding re-use and recycled-content targets, restricting single-use plastics, and requiring minimised packaging weight/volume.
- On 11 February 2025, the PPWR entered into force, thereby establishing a harmonised legal framework across the EU for all packaging placed on the market, which includes e-commerce packaging, and signalling a shift toward circular-economy compliance burdens for online retailers.
- Packaging-waste regulations have been tightened across major economies, increasing mandatory requirements for recyclability, reuse, reporting and material reduction. These measures elevate compliance costs for e-commerce packaging producers through stricter design standards, traceability obligations, recycled-content mandates and expanded producer responsibility. As regulatory thresholds rise, firms face higher operational, auditing and redesign expenses, narrowing margins and complicating market entry for smaller suppliers. Consequently, escalating compliance demands are expected to act as a structural restraint on the Middle East and Africa E-Commerce Packaging Market by increasing cost burdens and limiting flexibility in material and format selection
Middle East and Africa E-Commerce Packaging Market Scope
The Middle East and Africa E-Commerce Packaging Market is segmented into four segments based on Packaging, Material, End user, Distribution channel.
- By Packaging
On the basis of packaging, the Middle East and Africa E-Commerce Packaging Market is segmented into corrugated boxes, bags, mailers, labels, protective packaging, pallet boxes, tapes, postal packaging, and shrink film. In 2026, the Corrugated Boxes segment is expected to dominate the market with a 36.53% market share, driven by rising online shopping volumes, increasing demand for durable and cost-efficient packaging, and the rapid expansion of omnichannel retail networks. Corrugated boxes remain the preferred choice due to their high strength, recyclability, customization flexibility, and suitability for a wide range of products—from electronics and household goods to apparel, cosmetics, and consumer essentials. Additionally, the growth of subscription-based e-commerce models, improved printing technologies, and heightened sustainability requirements are reinforcing the segment’s leadership.
The Corrugated Boxes segment is the fastest-growing in the Middle East and Africa E-Commerce Packaging Market, with a CAGR of 10.7%, driven by the surge in parcel shipments, increasing adoption of sustainable and lightweight packaging solutions, and rising consumer expectations for secure, damage-free delivery. The expansion of fulfillment centers, advancements in automated box-making systems, and the shift toward right-sized packaging are further accelerating demand. Moreover, increased emphasis on recyclable materials, eco-friendly packaging mandates, and the growing presence of major e-commerce players across the U.S., Canada, and Mexico are expected to strengthen the dominance of corrugated packaging in the coming years.
- By Material
On the basis of material, the Middle East and Africa E-Commerce Packaging Market is segmented into fiber-based, recycled content and post-consumer recycled (PCR) plastics, bio-based materials, conventional plastics (virgin plastics), and others. In 2026, the fiber-based segment is expected to dominate with a 49.85% market share, driven by strong demand for sustainable, recyclable, and lightweight packaging solutions across major e-commerce categories. The shift toward eco-friendly packaging, rising environmental awareness among consumers, and the implementation of stricter sustainability regulations in the U.S. and Canada are accelerating the adoption of fiber-based materials. Additionally, the expansion of corrugated packaging production, advancements in paper strength and lightweighting technologies, and the growing preference for plastic-free packaging among brands and retailers further support the segment’s leadership.
The Bio-Based Materials segment is the fastest-growing segment in the Middle East and Africa E-Commerce Packaging Market, with a CAGR of 10.9%, driven by increasing investment in biodegradable and compostable packaging, heightened corporate sustainability commitments, and consumer preference for low-impact alternatives. Bio-based mailers, films, cushioning materials, and molded fiber solutions are gaining traction as companies work toward reducing carbon footprints and meeting ESG goals. Furthermore, innovations in plant-based polymers, government-backed green initiatives, and the rapid expansion of eco-conscious direct-to-consumer brands are accelerating market adoption across the region.
- By End User
On the basis of end-user, the Middle East and Africa E-Commerce Packaging Market is segmented into apparels and accessories (excluding leather-based), electronics and electrical, textile, household, personal care, food and beverages, pharmaceuticals, automotive, fabricated metal products, chemical products, agriculture, furniture, wood and wood products (excluding furniture), leather and leather goods, construction materials, tobacco products, and others. In 2026, the Apparels and Accessories (Ex. leather based) segment is expected to dominate the market with 14.50% market share, driven by rapid growth of online fashion retail, fast-fashion brands, and D2C apparel companies. Increasing consumer preference for convenient returns, personalized fashion subscriptions, and seasonal product launches is pushing demand for durable and lightweight packaging solutions. The rise of social commerce, influencer-led apparel promotions, and high-volume shipping cycles further reinforces the segment’s leadership in the Middle East and Africa e-commerce packaging industry.
Electronics & Electrical is the fastest-growing segment with CAGR of 11.0% in the Middle East and Africa E-Commerce Packaging Market driven by increasing online sales of consumer electronics, smart devices, home automation products, and small appliances. As these items require protective, shock-resistant, and tamper-proof packaging, demand for specialized materials such as protective mailers, molded fiber inserts, corrugated boxes, and multi-layered packaging continues to rise. Additionally, rapid product innovation, frequent device upgrades, and growing adoption of e-commerce platforms for high-value electronics—combined with the expansion of refurbished electronics marketplaces—are accelerating the need for advanced and sustainable packaging solutions across the region.
- By Distribution Channel
On the basis of distribution channel, the Middle East and Africa E-Commerce Packaging Market is segmented into direct and indirect channels. In 2026, the Direct segment is expected to dominate the market with 68.94% market share, driven by strong procurement volumes from large-scale e-commerce companies, third-party logistics (3PL) providers, and major retail organizations that prefer purchasing packaging materials directly from manufacturers. Direct channels offer benefits such as bulk pricing, customized packaging solutions, faster lead times, and long-term supplier partnerships, which are increasingly preferred by high-volume e-commerce operators. Additionally, the growing trend of vertically integrated supply chains, subscription-based packaging procurement, and automation-enabled packaging lines further strengthens the dominance of the direct distribution channel.
Direct is the fastest-growing segment with a CAGR of 10.2% in the Middle East and Africa E-Commerce Packaging Market driven by the increasing preference of e-commerce companies, fulfillment centers, and 3PL providers to source packaging materials directly from manufacturers for better cost efficiency, consistent quality, and supply reliability. Direct procurement enables large buyers to secure bulk orders, benefit from negotiated pricing, access customized packaging solutions, and streamline inventory management—critical advantages in a market where order volumes and shipment frequencies continue to rise.
Middle East and Africa E-Commerce Packaging Market Regional Analysis
- Saudi Arabia is expected to dominate the Middle East and Africa E-Commerce Packaging Market with the largest revenue share of 16.06% in 2026, supported by the country’s highly mature retail and e-commerce ecosystem, strong consumer spending power, and the presence of major online retailers, logistics providers, and packaging manufacturers. Large-scale operations by companies such as Amazon, Walmart, Target, UPS, and FedEx drive substantial demand for corrugated boxes, mailers, protective packaging, and sustainable materials. Additionally, the U.S. continues to invest heavily in automation, warehouse optimization, supply chain digitalization, and environmentally responsible packaging, further solidifying its dominant position in the region.
- United Arab Emirates (UAE) is expected to be the fastest-growing region in the Middle East and Africa E-Commerce Packaging Market during the forecast period with a CAGR of 10.7%, fueled by rapid expansion of e-commerce penetration, increasing cross-border trade, rising adoption of digital payment systems, and improving last-mile delivery infrastructure. Investments in modern logistics centers, packaging production facilities, and government initiatives supporting manufacturing competitiveness further accelerate market development. Moreover, the growth of SMEs and D2C brands in Mexico is contributing to increased consumption of flexible mailers, corrugated boxes, and protective packaging.
- Overall, increasing digital retail adoption, growth in cross-border e-commerce, sustainability-driven product innovation, and ongoing investments in logistics and fulfillment technologies are collectively strengthening the Middle East and African Middle East and Africa E-Commerce Packaging Market.
The Major Market Leaders Operating in the Market Are:
- International Paper Company (U.S.)
- Amcor PLC (Switzerland)
- DS Smith PLC (U.K.)
- Smurfit WestRock (U.S.)
- Packaging Corporation of America (PCA) (U.S.)
- Mondi PLC (U.K.)
- Klabin S.A. (Brazil)
- Oji Holdings Corporation (Japan)
- Sealed Air Corporation (U.S.)
- Nine Dragons Paper Holdings Ltd. (Hong Kong)
- 3M Company (U.S.)
- Avery Dennison Corporation (U.S.)
- Green Bay Packaging Inc. (U.S.)
- Cosmo Films (India)
- Georgia-Pacific LLC (U.S.)
- Ranpak Holdings Corp. (U.S.)
- Boxon Group AB (Sweden)
- Stora Enso (Finland)
- Pratt Industries (U.S.)
- Prem Industries India Limited (India)
- Pregis LLC (U.S.)
- Packtek (India)
- Packman Packaging Private Limited (India)
- Packhelp (Poland)
- IPG (U.S.)
- Filmar Group (Poland)
- ECB (U.S.)
- Ecom Packaging (India)
- Blue Box Packaging (U.S.)
- Altpac (India)
Latest Developments in Middle East and Africa E-Commerce Packaging
- In July 2022, Packhelp launched “carbon‑labelling” for its packaging products allowing customers to see the estimated carbon footprint of packaging orders. This aligns with growing demand for sustainable packaging in e‑commerce. Packhelp continues to position itself as a custom‑packaging marketplace with low minimum order quantities which remains attractive for e‑commerce sellers, startups, and small D2C brands who need custom packaging but don’t order in large volumes
- In April 2025, Pratt Industries, Inc. announced a commitment to invest US$ 5 billion in U.S. recycling, clean‑energy infrastructure, and manufacturing jobs, supporting a broad re‑industrialization drive.
- In September 2025, Pregis opened a new 477,000-square-foot paper converting center in Elgin, Illinois. The facility will support over 500 manufacturing jobs and can produce more than 1 billion curbside recyclable paper packaging solutions annually.
- In August 2025, Ranpak Holdings Corp. announced a major expansion of its existing relationship with Walmart. Under the terms of this strategic agreement, Walmart will install numerous Ranpak AutoFill systems across its five Next Generation Fulfillment Centers, streamlining its fulfillment process, reducing packaging waste, and simplifying work for associates.
- In September 2025, Sealed Air Corporation is advancing its strategy as a one-stop shop for fulfillment operations with the launch of the AUTOBAG 850HB Hybrid Bagging Machine, a new automated bagging system engineered to run both poly and paper mailers.
SKU-

- Interactive Data Analysis Dashboard
- Company Analysis Dashboard for high growth potential opportunities
- Research Analyst Access for customization & queries
- Competitor Analysis with Interactive dashboard
- Latest News, Updates & Trend analysis
- Harness the Power of Benchmark Analysis for Comprehensive Competitor Tracking
Table of Content
1 INTRODUCTION
1.1 OBJECTIVES OF THE STUDY
1.2 MARKET DEFINITION
1.3 OVERVIEW
1.4 LIMITATIONS
1.5 MARKETS COVERED
2 MARKET SEGMENTATION
2.1 MARKETS COVERED
2.2 GEOGRAPHICAL SCOPE
2.3 YEARS CONSIDERED FOR THE STUDY
2.4 CURRENCY AND PRICING
2.5 DBMR TRIPOD DATA VALIDATION MODEL
2.6 MULTIVARIATE MODELING
2.7 PRIMARY INTERVIEWS WITH KEY OPINION LEADERS
2.8 DBMR MARKET POSITION GRID
2.9 DBMR VENDOR SHARE ANALYSIS
2.1 MARKET APPLICATION COVERAGE GRID
2.11 SECONDARY SOURCES
2.12 ASSUMPTIONS
3 EXECUTIVE SUMMARY
4 PREMIUM INSIGHTS
4.1 PORTER’S FIVE FORCES
4.2 COMPANY EVALUATION QUADRANT
4.3 PATENT ANALYSIS
4.3.1 PATENT FILING DISTRIBUTION BY COUNTRY
4.3.2 KEY APPLICANTS (TOP INNOVATORS)
4.3.3 TECHNOLOGY SEGMENTATION BY IPC CODES
4.3.4 PATENT TREND OVER TIME (2016–2025)
4.4 PRICING ANALYSIS
4.5 PRODUCTION CAPACITY OF KEY MANUFACTURERS
4.6 BRAND OUTLOOK
4.7 CLIMATE CHANGE SCENARIO
4.7.1 ENVIRONMENTAL CONCERNS
4.7.1.1 Packaging waste volumes and landfill pressure
4.7.1.2 Plastic pollution & microplastics
4.7.1.3 Deforestation and pulp supply stress
4.7.1.4 Greenhouse gas (GHG) emissions across the lifecycle
4.7.1.5 Water and chemical pollution
4.7.1.6 Supply chain vulnerability to extreme weather
4.7.1.7 Regulatory and consumer pressure
4.7.2 INDUSTRY RESPONSE
4.7.2.1 Material substitution and lightweighting
4.7.2.2 Design for recycling & circularity
4.7.2.3 Adoption of recycled and bio-based feedstocks
4.7.2.4 Investment in recycling & recovery partnerships
4.7.2.5 Supply-chain optimization & right-sizing
4.7.2.6 Process & energy efficiency at converters
4.7.2.7 Certification & eco-labeling
4.7.2.8 Innovation in protective solutions
4.7.3 GOVERNMENT’S ROLE
4.7.3.1 Regulation & mandates
4.7.3.2 Standards, labelling & transparency
4.7.3.3 Fiscal instruments & incentives
4.7.3.4 Infrastructure investment
4.7.3.5 Public procurement leadership
4.7.3.6 R&D & standards support
4.7.4 ANALYST RECOMMENDATIONS
4.8 CONSUMER BUYING BEHAVIOR
4.8.1 DEMAND FOR SUSTAINABLE AND ECO-FRIENDLY PACKAGING
4.8.2 PREFERENCE FOR SECURE AND DAMAGE-RESISTANT PACKAGING
4.8.3 RISING IMPORTANCE OF CONVENIENCE AND EASE OF UNBOXING
4.8.4 INFLUENCE OF AESTHETIC APPEAL AND BRAND IDENTITY
4.8.5 INCREASING CONSUMER NEED FOR TRANSPARENCY AND INFORMATION
4.8.6 SHIFT TOWARD PERSONALIZED PACKAGING EXPERIENCES
4.8.7 CONCERNS ABOUT PACKAGING WASTE AND RECYCLING CONVENIENCE
4.8.8 WILLINGNESS TO PAY FOR PREMIUM PACKAGING IN CERTAIN CATEGORIES
4.8.9 CONCLUSION
4.9 COST ANALYSIS BREAKDOWN
4.9.1 TOP-LEVEL COST BUCKETS
4.9.1.1 Raw Materials
4.9.1.2 Manufacturing & Converting
4.9.1.3 Protective Inserts & Cushioning
4.9.1.4 Labour & Fulfilment Handling
4.9.1.5 Packaging Design / Customization / Printing
4.9.1.6 Logistics & Dimensional Weight Impact
4.9.1.7 Returns & Reverse Logistics
4.9.1.8 Sustainability Premium & Compliance Costs
4.9.1.9 Overheads & CAPEX Amortization
4.9.1.10 Supplier Margin / Distributor Markup
4.9.2 TYPICAL COST SHARES
4.9.2.1 Raw Materials + Converting: 50-65% of Total Packaging Cost
4.9.2.2 Labour & Fulfilment Handling: 10-20%
4.9.2.3 Protective Inserts & Void Fill: 5-15%
4.9.2.4 Design / Printing / Customization: 3-10%
4.9.2.5 Sustainability Premium / Compliance: 5-15%
4.9.2.6 Packaging as % of Fulfilment Cost: 15-20%
4.1 INDUSTRY ECOSYSTEM ANALYSIS
4.10.1 PROMINENT COMPANIES
4.10.2 SMALL & MEDIUM-SIZED COMPANIES
4.10.3 END USERS
4.11 INNOVATION TRACKER AND STRATEGIC ANALYSIS
4.11.1 MAJOR DEALS AND STRATEGIC ALLIANCES ANALYSIS
4.11.2 NUMBER OF PRODUCTS IN DEVELOPMENT
4.11.3 STAGE OF DEVELOPMENT
4.11.4 TIMELINES AND MILESTONES
4.11.5 INNOVATION STRATEGIES AND METHODOLOGIES
4.11.6 17.6 RISK ASSESSMENT AND MITIGATION
4.11.7 FUTURE OUTLOOK
4.12 PROFIT MARGIN OUTLOOK AND SCENARIO ASSESSMENT
4.12.1 INTRODUCTION
4.12.2 EXPECTED MARGIN PERFORMANCE (BASE CASE)
4.12.3 MARGIN UPSIDE POTENTIAL (FAVOURABLE MARKET ENVIRONMENT)
4.12.4 MARGIN COMPRESSION RISKS (ADVERSE MARKET CONDITIONS)
4.12.5 EXPOSURE TO RAW MATERIAL PRICE VOLATILITY
4.12.6 MARGIN VARIATION BY PRODUCT CATEGORY
4.12.7 INFLUENCE OF SCALE AND AUTOMATION ON COST EFFICIENCY
4.12.8 SENSITIVITY TO DEMAND CYCLICALITY AND PRICING DYNAMICS
4.12.9 FINANCIAL IMPACT OF SUSTAINABILITY REQUIREMENTS
4.12.10 COMPETITIVE INTENSITY AND ITS EFFECT ON MARGIN STRUCTURE
4.12.11 STRATEGIC MARGIN ENHANCEMENT OPPORTUNITIES
4.12.12 CONCLUSION
4.13 RAW MATERIAL COVERAGE
4.13.1 PAPER AND PAPERBOARD: THE DOMINANT RAW MATERIAL
4.13.2 PLASTICS: FLEXIBLE, PROTECTIVE, AND LIGHTWEIGHT
4.13.3 BIODEGRADABLE AND COMPOSTABLE MATERIALS
4.13.4 MOLDED FIBER AND PULP-BASED MATERIALS
4.13.5 FOAMS AND CUSHIONING MATERIALS
4.13.6 ADHESIVES, COATINGS, AND INKS
4.13.7 EMERGING RAW MATERIALS FOR SMARTER PACKAGING
4.13.8 CONCLUSION
4.14 SUPPLY CHAIN ANALYSIS
4.14.1 OVERVIEW
4.14.2 LOGISTIC COST SCENARIO
4.14.3 IMPORTANCE OF LOGISTICS SERVICE PROVIDERS
4.15 TECHNOLOGICAL ADVANCEMENTS
4.15.1 SMART PACKAGING AND IOT INTEGRATION
4.15.2 AUTOMATION AND ROBOTICS IN FULFILMENT CENTRES
4.15.3 RIGHT-SIZING AND ON-DEMAND PACKAGING TECHNOLOGIES
4.15.4 SUSTAINABLE AND ADVANCED MATERIAL INNOVATIONS
4.15.5 ARTIFICIAL INTELLIGENCE AND DATA-DRIVEN DESIGN
4.15.6 ANTI-COUNTERFEIT AND SECURITY TECHNOLOGIES
4.15.7 ENHANCED CUSTOMIZATION AND DIGITAL PRINTING
4.15.8 CONCLUSION
4.16 VALUE CHAIN ANALYSIS
4.16.1 OVERVIEW
4.16.2 RAW MATERIAL SUPPLY
4.16.3 COMPONENT MANUFACTURING AND PROCESSING
4.16.4 EQUIPMENT & TECHNOLOGY PROVIDERS
4.16.5 DISTRIBUTION AND LOGISTICS
4.16.6 END-USERS
4.16.7 CONCLUSION
4.17 VENDOR SELECTION CRITERIA
4.17.1 PRODUCT QUALITY, DURABILITY, AND COMPLIANCE
4.17.2 SUSTAINABILITY AND ENVIRONMENTAL CERTIFICATIONS
4.17.3 TECHNOLOGICAL CAPABILITIES AND INNOVATION
4.17.4 CUSTOMIZATION, BRANDING, AND CONSUMER EXPERIENCE
4.17.5 COST EFFICIENCY AND TOTAL COST OF OWNERSHIP (TCO)
4.17.6 SUPPLY CHAIN STRENGTH AND MIDDLE EAST AND AFRICA REACH
4.17.7 CERTIFICATIONS, SAFETY STANDARDS, AND INDUSTRY EXPERTISE
4.17.8 AFTER-SALES SUPPORT AND TECHNICAL ASSISTANCE
4.17.9 CONCLUSION
5 TARIFFS AND IMPACT ANALYSIS
5.1 CURRENT TARIFF RATE(S) IN TOP-5 COUNTRY MARKETS
5.2 OUTLOOK: LOCAL PRODUCTION VS IMPORT RELIANCE
5.3 VENDOR SELECTION CRITERIA DYNAMICS
5.4 IMPACT ON SUPPLY CHAIN
5.4.1 RAW MATERIAL PROCUREMENT
5.4.2 MANUFACTURING AND PRODUCTION
5.4.3 LOGISTICS AND DISTRIBUTION
5.4.4 PRICE PITCHING AND POSITION OF MARKET
5.5 INDUSTRY PARTICIPANTS: PROACTIVE MOVES
5.5.1 SUPPLY CHAIN OPTIMIZATION
5.5.2 JOINT VENTURE ESTABLISHMENTS
5.6 IMPACT ON PRICES
5.7 REGULATORY INCLINATION
5.7.1 GEOPOLITICAL SITUATION
5.7.2 TRADE PARTNERSHIPS BETWEEN COUNTRIES
5.7.2.1 FREE TRADE AGREEMENTS
5.7.2.2 ALLIANCES ESTABLISHMENTS
5.7.3 STATUS ACCREDITATION (INCLUDING MFN)
5.7.4 DOMESTIC COURSE OF CORRECTION
5.7.4.1 INCENTIVE SCHEMES TO BOOST PRODUCTION OUTPUTS
5.7.4.2 ESTABLISHMENT OF SEZs/INDUSTRIAL PARKS
6 REGULATORY COVERAGE
7 MARKET OVERVIEW
7.1 DRIVERS
7.1.1 REGIONAL INTERNET & SMARTPHONE PENETRATION IN EMERGING MARKETS
7.1.2 RISING CONSUMER EXPECTATIONS FOR PRODUCT PROTECTION AND DELIVERY EXPERIENCE
7.1.3 RAPID GROWTH OF ONLINE RETAIL AND FULFILLMENT NETWORKS
7.1.4 SUSTAINABILITY SHIFT TOWARD RECYCLABLE AND FIBER-BASED FORMATS
7.2 RESTRAINS
7.2.1 VOLATILITY IN RAW MATERIAL PRICES (PAPER, RESINS, ADHESIVES)
7.2.2 PACKAGING WASTE REGULATIONS AND COMPLIANCE COSTS
7.3 OPPORTUNITY
7.3.1 ADOPTION OF AUTOMATION AND RIGHT-SIZING SYSTEMS IN FULFILLMENT
7.3.2 PREMIUMIZATION VIA DIGITAL PRINTING AND BRAND PERSONALIZATION
7.4 CHALLENGES
7.4.1 BALANCING PROTECTION WITH MATERIAL REDUCTION TARGETS
7.4.2 REVERSE LOGISTICS AND RETURNS PACKAGING OPTIMIZATION
8 MIDDLE EAST AND AFRICA E-COMMERCE PACKAGING MARKET, BY PACKAGING.
8.1 OVERVIEW
8.2 MIDDLE EAST AND AFRICA E-COMMERCE PACKAGING MARKET, BY PACKAGING, 2018-2033 (USD THOUSAND)
8.2.1 CORRUGATED BOXES
8.2.2 BAGS
8.2.3 MAILER
8.2.4 LABELS
8.2.5 PROTECTIVE PACKAGING
8.2.6 PALLET BOXES
8.2.7 TAPES
8.2.8 POSTAL PACKAGING
8.2.9 SHRINK FILM
8.3 MIDDLE EAST AND AFRICA E-COMMERCE PACKAGING MARKET, BY PACKAGING, 2018-2033 (THOUSAND UNITS)
8.3.1 CORRUGATED BOXES
8.3.2 BAGS
8.3.3 MAILER
8.3.4 LABELS
8.3.5 PROTECTIVE PACKAGING
8.3.6 PALLET BOXES
8.3.7 TAPES
8.3.8 POSTAL PACKAGING
8.3.9 SHRINK FILM
8.4 MIDDLE EAST AND AFRICA CORRUGATED BOXES IN E-COMMERCE PACKAGING MARKET, BY REGION, 2018-2033 (USD THOUSAND)
8.4.1 ASIA-PACIFIC
8.4.2 NORTH AMERICA
8.4.3 EUROPE
8.4.4 SOUTH AMERICA
8.4.5 MIDDLE EAST & AFRICA
8.5 MIDDLE EAST AND AFRICA CORRUGATED BOXES IN E-COMMERCE PACKAGING MARKET, BY REGION, 2018-2033 (THOUSAND UNITS)
8.5.1 ASIA-PACIFIC
8.5.2 NORTH AMERICA
8.5.3 EUROPE
8.5.4 SOUTH AMERICA
8.5.5 MIDDLE EAST & AFRICA
8.6 MIDDLE EAST AND AFRICA BAGS IN E-COMMERCE PACKAGING MARKET, BY TYPE, 2018-2033 (USD THOUSAND)
8.6.1 POLYTHENE BAGS
8.6.2 COURIER BAGS
8.6.3 WOVEN SACK BAGS
8.6.4 FOAM BAGS
8.6.5 TEMPER PROOF BAGS
8.6.6 LOCK BAGS
8.6.7 OTHERS
8.7 MIDDLE EAST AND AFRICA BAGS IN E-COMMERCE PACKAGING MARKET, BY TYPE, 2018-2033 (THOUSAND UNITS)
8.7.1 POLYTHENE BAGS
8.7.2 COURIER BAGS
8.7.3 WOVEN SACK BAGS
8.7.4 FOAM BAGS
8.7.5 TEMPER PROOF BAGS
8.7.6 LOCK BAGS
8.7.7 OTHERS
8.8 MIDDLE EAST AND AFRICA BAGS IN E-COMMERCE PACKAGING MARKET, BY REGION, 2018-2033 (USD THOUSAND)
8.8.1 ASIA-PACIFIC
8.8.2 NORTH AMERICA
8.8.3 EUROPE
8.8.4 SOUTH AMERICA
8.8.5 MIDDLE EAST & AFRICA
8.9 MIDDLE EAST AND AFRICA BAGS IN E-COMMERCE PACKAGING MARKET, BY REGION, 2018-2033 (THOUSAND UNITS)
8.9.1 ASIA-PACIFIC
8.9.2 NORTH AMERICA
8.9.3 EUROPE
8.9.4 SOUTH AMERICA
8.9.5 MIDDLE EAST & AFRICA
8.1 MIDDLE EAST AND AFRICA MAILER IN E-COMMERCE PACKAGING MARKET, BY REGION, 2018-2033 (USD THOUSAND)
8.10.1 ASIA-PACIFIC
8.10.2 NORTH AMERICA
8.10.3 EUROPE
8.10.4 SOUTH AMERICA
8.10.5 MIDDLE EAST & AFRICA
8.11 MIDDLE EAST AND AFRICA MAILER IN E-COMMERCE PACKAGING MARKET, BY REGION, 2018-2033 (THOUSAND UNITS)
8.11.1 ASIA-PACIFIC
8.11.2 NORTH AMERICA
8.11.3 EUROPE
8.11.4 SOUTH AMERICA
8.11.5 MIDDLE EAST & AFRICA
8.12 MIDDLE EAST AND AFRICA LABELS IN E-COMMERCE PACKAGING MARKET, BY REGION, 2018-2033 (USD THOUSAND)
8.12.1 ASIA-PACIFIC
8.12.2 NORTH AMERICA
8.12.3 EUROPE
8.12.4 SOUTH AMERICA
8.12.5 MIDDLE EAST & AFRICA
8.13 MIDDLE EAST AND AFRICA LABELS IN E-COMMERCE PACKAGING MARKET, BY REGION, 2018-2033 (THOUSAND UNITS)
8.13.1 ASIA-PACIFIC
8.13.2 NORTH AMERICA
8.13.3 EUROPE
8.13.4 SOUTH AMERICA
8.13.5 MIDDLE EAST & AFRICA
8.14 MIDDLE EAST AND AFRICA TAPES IN E-COMMERCE PACKAGING MARKET, BY TYPE, 2018-2033 (USD THOUSAND)
8.14.1 SELF-ADHESIVE BOPP TAPES
8.14.2 PRINTED TAPES
8.14.3 REINFORCED PAPER TAPES
8.14.4 PVC PACKING TAPES
8.14.5 PACKAGING SEALING ADHESIVE TAPES
8.14.6 RESEALABLE BAG SEALING TAPES
8.14.7 OTHERS
8.15 MIDDLE EAST AND AFRICA TAPES IN E-COMMERCE PACKAGING MARKET, BY TYPE, 2018-2033 (THOUSAND UNITS)
8.15.1 SELF-ADHESIVE BOPP TAPES
8.15.2 PRINTED TAPES
8.15.3 REINFORCED PAPER TAPES
8.15.4 PVC PACKING TAPES
8.15.5 PACKAGING SEALING ADHESIVE TAPES
8.15.6 RESEALABLE BAG SEALING TAPES
8.15.7 OTHERS
8.16 MIDDLE EAST AND AFRICA TAPES IN E-COMMERCE PACKAGING MARKET, BY REGION, 2018-2033 (USD THOUSAND)
8.16.1 ASIA-PACIFIC
8.16.2 NORTH AMERICA
8.16.3 EUROPE
8.16.4 SOUTH AMERICA
8.16.5 MIDDLE EAST & AFRICA
8.17 MIDDLE EAST AND AFRICA TAPES IN E-COMMERCE PACKAGING MARKET, BY REGION, 2018-2033 (THOUSAND UNITS)
8.17.1 ASIA-PACIFIC
8.17.2 NORTH AMERICA
8.17.3 EUROPE
8.17.4 SOUTH AMERICA
8.17.5 MIDDLE EAST & AFRICA
8.18 MIDDLE EAST AND AFRICA PROTECTIVE PACKAGING IN E-COMMERCE PACKAGING MARKET, BY TYPE, 2018-2033 (USD THOUSAND)
8.18.1 AIR BUBBLE ROLLS
8.18.2 CORRUGATED ROLLS
8.18.3 OTHERS
8.19 MIDDLE EAST AND AFRICA PROTECTIVE PACKAGING IN E-COMMERCE PACKAGING MARKET, BY TYPE, 2018-2033 (THOUSAND UNITS )
8.19.1 AIR BUBBLE ROLLS
8.19.2 CORRUGATED ROLLS
8.19.3 OTHERS
8.2 MIDDLE EAST AND AFRICA PROTECTIVE PACKAGING IN E-COMMERCE PACKAGING MARKET, BY REGION, 2018-2033 (USD THOUSAND)
8.20.1 ASIA-PACIFIC
8.20.2 NORTH AMERICA
8.20.3 EUROPE
8.20.4 SOUTH AMERICA
8.20.5 MIDDLE EAST & AFRICA
8.21 MIDDLE EAST AND AFRICA PROTECTIVE PACKAGING IN E-COMMERCE PACKAGING MARKET, BY REGION, 2018-2033 (THOUSAND UNITS)
8.21.1 ASIA-PACIFIC
8.21.2 NORTH AMERICA
8.21.3 EUROPE
8.21.4 SOUTH AMERICA
8.21.5 MIDDLE EAST & AFRICA
8.22 MIDDLE EAST AND AFRICA PALLET BOXES IN E-COMMERCE PACKAGING MARKET, BY REGION, 2018-2033 (USD THOUSAND)
8.22.1 ASIA-PACIFIC
8.22.2 NORTH AMERICA
8.22.3 EUROPE
8.22.4 SOUTH AMERICA
8.22.5 MIDDLE EAST & AFRICA
8.23 MIDDLE EAST AND AFRICA PALLET BOXES IN E-COMMERCE PACKAGING MARKET, BY REGION, 2018-2033 (THOUSAND UNITS)
8.23.1 ASIA-PACIFIC
8.23.2 NORTH AMERICA
8.23.3 EUROPE
8.23.4 SOUTH AMERICA
8.23.5 MIDDLE EAST & AFRICA
8.24 MIDDLE EAST AND AFRICA POSTAL PACKAGING IN E-COMMERCE PACKAGING MARKET, BY REGION, 2018-2033 (USD THOUSAND)
8.24.1 ASIA-PACIFIC
8.24.2 NORTH AMERICA
8.24.3 EUROPE
8.24.4 SOUTH AMERICA
8.24.5 MIDDLE EAST & AFRICA
8.25 MIDDLE EAST AND AFRICA POSTAL PACKAGING IN E-COMMERCE PACKAGING MARKET, BY REGION, 2018-2033 (THOUSAND UNITS)
8.25.1 ASIA-PACIFIC
8.25.2 NORTH AMERICA
8.25.3 EUROPE
8.25.4 SOUTH AMERICA
8.25.5 MIDDLE EAST & AFRICA
8.26 MIDDLE EAST AND AFRICA SHRINK FILM IN E-COMMERCE PACKAGING MARKET, BY REGION, 2018-2033 (USD THOUSAND)
8.26.1 ASIA-PACIFIC
8.26.2 NORTH AMERICA
8.26.3 EUROPE
8.26.4 SOUTH AMERICA
8.26.5 MIDDLE EAST & AFRICA
8.27 MIDDLE EAST AND AFRICA SHRINK FILMING E-COMMERCE PACKAGING MARKET, BY REGION, 2018-2033 (THOUSAND UNITS)
8.27.1 ASIA-PACIFIC
8.27.2 NORTH AMERICA
8.27.3 EUROPE
8.27.4 SOUTH AMERICA
8.27.5 MIDDLE EAST & AFRICA
9 MIDDLE EAST AND AFRICA E-COMMERCE PACKAGING MARKET, BY MATERIAL.
9.1 OVERVIEW
9.2 MIDDLE EAST AND AFRICA E-COMMERCE PACKAGING MARKET, BY MATERIAL, 2018-2033 (USD THOUSAND)
9.2.1 FIBER-BASED
9.2.2 RECYCLED CONTENT & POST-CONSUMER RECYCLED (PCR) PLASTICS
9.2.3 BIO-BASED MATERIALS
9.2.4 CONVENTIONAL PLASTICS (VIRGIN PLASTICS)
9.2.5 OTHERS
9.3 MIDDLE EAST AND AFRICA FIBER-BASED IN E-COMMERCE PACKAGING MARKET, BY TYPE, 2018-2033 (USD THOUSAND)
9.3.1 CORRUGATED BOARD
9.3.2 PAPER & PAPERBOARD
9.4 MIDDLE EAST AND AFRICA CORRUGATED BOARD IN E-COMMERCE PACKAGING MARKET, BY TYPE, 2018-2033 (USD THOUSAND)
9.4.1 SINGLE WALL
9.4.2 DOUBLE WALL
9.4.3 SINGLE FACE
9.4.4 TRIPLE WALL
9.4.5 OTHERS
9.5 MIDDLE EAST AND AFRICA FIBER-BASED IN E-COMMERCE PACKAGING MARKET, BY REGION, 2018-2033 (USD THOUSAND)
9.5.1 ASIA-PACIFIC
9.5.2 NORTH AMERICA
9.5.3 EUROPE
9.5.4 SOUTH AMERICA
9.5.5 MIDDLE EAST & AFRICA
9.6 MIDDLE EAST AND AFRICA RECYCLED CONTENT & POST-CONSUMER RECYCLED (PCR) PLASTICS IN E-COMMERCE PACKAGING MARKET, BY REGION, 2018-2033 (USD THOUSAND)
9.6.1 ASIA-PACIFIC
9.6.2 NORTH AMERICA
9.6.3 EUROPE
9.6.4 SOUTH AMERICA
9.6.5 MIDDLE EAST & AFRICA
9.7 MIDDLE EAST AND AFRICA BIO-BASED MATERIALS IN E-COMMERCE PACKAGING MARKET, BY REGION, 2018-2033 (USD THOUSAND)
9.7.1 ASIA-PACIFIC
9.7.2 NORTH AMERICA
9.7.3 EUROPE
9.7.4 SOUTH AMERICA
9.7.5 MIDDLE EAST & AFRICA
9.8 MIDDLE EAST AND AFRICA CONVENTIONAL PLASTICS (VIRGIN PLASTICS) IN E-COMMERCE PACKAGING MARKET, BY REGION, 2018-2033 (USD THOUSAND)
9.8.1 ASIA-PACIFIC
9.8.2 NORTH AMERICA
9.8.3 EUROPE
9.8.4 SOUTH AMERICA
9.8.5 MIDDLE EAST & AFRICA
9.9 MIDDLE EAST AND AFRICA OTHERS IN E-COMMERCE PACKAGING MARKET, BY REGION, 2018-2033 (USD THOUSAND)
9.9.1 ASIA-PACIFIC
9.9.2 NORTH AMERICA
9.9.3 EUROPE
9.9.4 SOUTH AMERICA
9.9.5 MIDDLE EAST & AFRICA
10 MIDDLE EAST AND AFRICA E-COMMERCE PACKAGING MARKET, BY END-USER.
10.1 OVERVIEW
10.2 MIDDLE EAST AND AFRICA E-COMMERCE PACKAGING MARKET, BY END-USER, 2018-2033 (USD THOUSAND)
10.2.1 APPARELS AND ACCESSORIES (EX. LEATHER BASED) (0001)
10.2.2 ELECTRONICS & ELECTRICAL (2500)
10.2.3 TEXTILE (0001)
10.2.4 HOUSEHOLD (2000,0001)
10.2.5 PERSONAL CARE (2000,0001)
10.2.6 FOOD AND BEVERAGES (1000,1100)
10.2.7 PHARMACEUTICALS (2100)
10.2.8 AUTOMOTIVE (4600)
10.2.9 FABRICATED METAL PRODUCTS (2500)
10.2.10 CHEMICAL PRODUCTS (2000)
10.2.11 AGRICULTURE (0100)
10.2.12 FURNITURE (0001)
10.2.13 WOOD AND WOOD PRODUCTS (EX. FURNITURE) (0001)
10.2.14 LEATHER AND LEATHER GOODS (0001)
10.2.15 CONSTRUCTION MATERIALS (2000,0001)
10.2.16 TOBACCO PRODUCTS (0001)
10.3 MIDDLE EAST AND AFRICA APPAREL & ACCESSORIES IN E-COMMERCE PACKAGING MARKET, BY CHANNEL TYPE, 2018-2033 (USD THOUSAND)
10.3.1 RETAIL
10.3.2 WHOLESALE
10.4 MIDDLE EAST AND AFRICA APPAREL & ACCESSORIES IN E-COMMERCE PACKAGING MARKET, BY PACKAGING, 2018-2033 (USD THOUSAND)
10.4.1 CORRUGATED BOXES
10.4.2 BAGS
10.4.3 MAILER
10.4.4 LABELS
10.4.5 PROTECTIVE PACKAGING
10.4.6 PALLET BOXES
10.4.7 TAPES
10.4.8 POSTAL PACKAGING
10.4.9 SHRINK FILM
10.5 MIDDLE EAST AND AFRICA APPAREL & ACCESSORIES IN E-COMMERCE PACKAGING MARKET, BY REGION, 2018-2033 (USD THOUSAND)
10.5.1 ASIA-PACIFIC
10.5.2 NORTH AMERICA
10.5.3 EUROPE
10.5.4 SOUTH AMERICA
10.5.5 MIDDLE EAST & AFRICA
10.6 MIDDLE EAST AND AFRICA ELECTRONICS & ELECTRICAL IN E-COMMERCE PACKAGING MARKET, BY CHANNEL TYPE, 2018-2033 (USD THOUSAND)
10.6.1 RETAIL
10.6.2 WHOLESALE
10.7 MIDDLE EAST AND AFRICA ELECTRONICS & ELECTRICAL IN E-COMMERCE PACKAGING MARKET, BY PACKAGING, 2018-2033 (USD THOUSAND)
10.7.1 CORRUGATED BOXES
10.7.2 BAGS
10.7.3 MAILER
10.7.4 LABELS
10.7.5 PROTECTIVE PACKAGING
10.7.6 PALLET BOXES
10.7.7 TAPES
10.7.8 POSTAL PACKAGING
10.7.9 SHRINK FILM
10.8 MIDDLE EAST AND AFRICA ELECTRONICS & ELECTRICAL IN E-COMMERCE PACKAGING MARKET, BY TYPE, 2018-2033 (USD THOUSAND)
10.8.1 COMPUTERS, ELECTRONIC AND OPTICAL PRODUCTS
10.8.2 ELECTRICAL EQUIPMENT
10.8.3 OTHERS
10.9 MIDDLE EAST AND AFRICA ELECTRONICS & ELECTRICAL IN E-COMMERCE PACKAGING MARKET, BY REGION, 2018-2033 (USD THOUSAND)
10.9.1 ASIA-PACIFIC
10.9.2 NORTH AMERICA
10.9.3 EUROPE
10.9.4 SOUTH AMERICA
10.9.5 MIDDLE EAST & AFRICA
10.1 MIDDLE EAST AND AFRICA TEXTILE IN E-COMMERCE PACKAGING MARKET, BY CHANNEL TYPE, 2018-2033 (USD THOUSAND)
10.10.1 RETAIL
10.10.2 WHOLESALE
10.11 MIDDLE EAST AND AFRICA TEXTILE IN E-COMMERCE PACKAGING MARKET, BY PACKAGING, 2018-2033 (USD THOUSAND)
10.11.1 CORRUGATED BOXES
10.11.2 BAGS
10.11.3 MAILER
10.11.4 LABELS
10.11.5 PROTECTIVE PACKAGING
10.11.6 PALLET BOXES
10.11.7 TAPES
10.11.8 POSTAL PACKAGING
10.11.9 SHRINK FILM
10.12 MIDDLE EAST AND AFRICA TEXTILE IN E-COMMERCE PACKAGING MARKET, BY REGION, 2018-2033 (USD THOUSAND)
10.12.1 ASIA-PACIFIC
10.12.2 NORTH AMERICA
10.12.3 EUROPE
10.12.4 SOUTH AMERICA
10.12.5 MIDDLE EAST & AFRICA
10.13 MIDDLE EAST AND AFRICA HOUSEHOLD IN E-COMMERCE PACKAGING MARKET, BY CHANNEL TYPE, 2018-2033 (USD THOUSAND)
10.13.1 RETAIL
10.13.2 WHOLESALE
10.14 MIDDLE EAST AND AFRICA HOUSEHOLD IN E-COMMERCE PACKAGING MARKET, BY PACKAGING, 2018-2033 (USD THOUSAND)
10.14.1 CORRUGATED BOXES
10.14.2 BAGS
10.14.3 MAILER
10.14.4 LABELS
10.14.5 PROTECTIVE PACKAGING
10.14.6 PALLET BOXES
10.14.7 TAPES
10.14.8 POSTAL PACKAGING
10.14.9 SHRINK FILM
10.15 MIDDLE EAST AND AFRICA HOUSEHOLD IN E-COMMERCE PACKAGING MARKET, BY REGION, 2018-2033 (USD THOUSAND)
10.15.1 ASIA-PACIFIC
10.15.2 NORTH AMERICA
10.15.3 EUROPE
10.15.4 SOUTH AMERICA
10.15.5 MIDDLE EAST & AFRICA
10.16 MIDDLE EAST AND AFRICA PERSONAL CARE IN E-COMMERCE PACKAGING MARKET, BY CHANNEL TYPE, 2018-2033 (USD THOUSAND)
10.16.1 RETAIL
10.16.2 WHOLESALE
10.17 MIDDLE EAST AND AFRICA PERSONAL CARE IN E-COMMERCE PACKAGING MARKET, BY PACKAGING, 2018-2033 (USD THOUSAND)
10.17.1 CORRUGATED BOXES
10.17.2 BAGS
10.17.3 MAILER
10.17.4 LABELS
10.17.5 PROTECTIVE PACKAGING
10.17.6 PALLET BOXES
10.17.7 TAPES
10.17.8 POSTAL PACKAGING
10.17.9 SHRINK FILM
10.18 MIDDLE EAST AND AFRICA PERSONAL CARE IN E-COMMERCE PACKAGING MARKET, BY REGION, 2018-2033 (USD THOUSAND)
10.18.1 ASIA-PACIFIC
10.18.2 NORTH AMERICA
10.18.3 EUROPE
10.18.4 SOUTH AMERICA
10.18.5 MIDDLE EAST & AFRICA
10.19 MIDDLE EAST AND AFRICA FOOD AND BEVERAGES IN E-COMMERCE PACKAGING MARKET, BY CHANNEL TYPE, 2018-2033 (USD THOUSAND)
10.19.1 RETAIL
10.19.2 WHOLESALE
10.2 MIDDLE EAST AND AFRICA FOOD AND BEVERAGES IN E-COMMERCE PACKAGING MARKET, BY PACKAGING, 2018-2033 (USD THOUSAND)
10.20.1 CORRUGATED BOXES
10.20.2 BAGS
10.20.3 MAILER
10.20.4 LABELS
10.20.5 PROTECTIVE PACKAGING
10.20.6 PALLET BOXES
10.20.7 TAPES
10.20.8 POSTAL PACKAGING
10.20.9 SHRINK FILM
10.21 MIDDLE EAST AND AFRICA FOOD AND BEVERAGES IN E-COMMERCE PACKAGING MARKET, BY TYPE, 2018-2033 (USD THOUSAND)
10.21.1 FOOD
10.21.2 BEVERAGES
10.22 MIDDLE EAST AND AFRICA FOOD AND BEVERAGES IN E-COMMERCE PACKAGING MARKET, BY REGION, 2018-2033 (USD THOUSAND)
10.22.1 ASIA-PACIFIC
10.22.2 NORTH AMERICA
10.22.3 EUROPE
10.22.4 SOUTH AMERICA
10.22.5 MIDDLE EAST & AFRICA
10.23 MIDDLE EAST AND AFRICA PHARMACEUTICALS IN E-COMMERCE PACKAGING MARKET, BY CHANNEL TYPE, 2018-2033 (USD THOUSAND)
10.23.1 RETAIL
10.23.2 WHOLESALE
10.24 MIDDLE EAST AND AFRICA PHARMACEUTICALS IN E-COMMERCE PACKAGING MARKET, BY PACKAGING, 2018-2033 (USD THOUSAND)
10.24.1 CORRUGATED BOXES
10.24.2 BAGS
10.24.3 MAILER
10.24.4 LABELS
10.24.5 PROTECTIVE PACKAGING
10.24.6 PALLET BOXES
10.24.7 TAPES
10.24.8 POSTAL PACKAGING
10.24.9 SHRINK FILM
10.25 MIDDLE EAST AND AFRICA PHARMACEUTICALS IN E-COMMERCE PACKAGING MARKET, BY REGION, 2018-2033 (USD THOUSAND)
10.25.1 ASIA-PACIFIC
10.25.2 NORTH AMERICA
10.25.3 EUROPE
10.25.4 SOUTH AMERICA
10.25.5 MIDDLE EAST & AFRICA
10.26 MIDDLE EAST AND AFRICA AUTOMOTIVE IN E-COMMERCE PACKAGING MARKET, BY CHANNEL TYPE, 2018-2033 (USD THOUSAND)
10.26.1 RETAIL
10.26.2 WHOLESALE
10.27 MIDDLE EAST AND AFRICA AUTOMOTIVE IN E-COMMERCE PACKAGING MARKET, BY PACKAGING, 2018-2033 (USD THOUSAND)
10.27.1 CORRUGATED BOXES
10.27.2 BAGS
10.27.3 MAILER
10.27.4 LABELS
10.27.5 PROTECTIVE PACKAGING
10.27.6 PALLET BOXES
10.27.7 TAPES
10.27.8 POSTAL PACKAGING
10.27.9 SHRINK FILM
10.28 MIDDLE EAST AND AFRICA AUTOMOTIVE IN E-COMMERCE PACKAGING MARKET, BY COMMODITY TYPE, 2018-2033 (USD THOUSAND)
10.28.1 SPARE PARTS
10.28.2 VEHICLE MODIFICATION PARTS
10.29 MIDDLE EAST AND AFRICA AUTOMOTIVE IN E-COMMERCE PACKAGING MARKET, BY REGION, 2018-2033 (USD THOUSAND)
10.29.1 ASIA-PACIFIC
10.29.2 NORTH AMERICA
10.29.3 EUROPE
10.29.4 SOUTH AMERICA
10.29.5 MIDDLE EAST & AFRICA
10.3 MIDDLE EAST AND AFRICA FABRICATED METAL PRODUCTS IN E-COMMERCE PACKAGING MARKET, BY CHANNEL TYPE, 2018-2033 (USD THOUSAND)
10.30.1 RETAIL
10.30.2 WHOLESALE
10.31 MIDDLE EAST AND AFRICA FABRICATED METAL PRODUCTS IN E-COMMERCE PACKAGING MARKET, BY REGION, 2018-2033 (USD THOUSAND)
10.32 ASIA-PACIFIC
10.32.1 NORTH AMERICA
10.32.2 EUROPE
10.32.3 SOUTH AMERICA
10.32.4 MIDDLE EAST & AFRICA
10.33 MIDDLE EAST AND AFRICA CHEMICAL PRODUCTS IN E-COMMERCE PACKAGING MARKET, BY CHANNEL TYPE, 2018-2033 (USD THOUSAND)
10.33.1 RETAIL
10.33.2 WHOLESALE
10.34 MIDDLE EAST AND AFRICA CHEMICAL PRODUCTS IN E-COMMERCE PACKAGING MARKET, BY REGION, 2018-2033 (USD THOUSAND)
10.34.1 ASIA-PACIFIC
10.34.2 NORTH AMERICA
10.34.3 EUROPE
10.34.4 SOUTH AMERICA
10.34.5 MIDDLE EAST & AFRICA
10.35 MIDDLE EAST AND AFRICA AGRICULTURE IN E-COMMERCE PACKAGING MARKET, BY CHANNEL TYPE, 2018-2033 (USD THOUSAND)
10.35.1 RETAIL
10.35.2 WHOLESALE
10.36 MIDDLE EAST AND AFRICA AGRICULTURE IN E-COMMERCE PACKAGING MARKET, BY TYPE, 2018-2033 (USD THOUSAND)
10.36.1 FERTILIZERS
10.36.2 FISHING AND AQUACULTURE PRODUCTS
10.36.3 PLANTS
10.36.4 SEEDS
10.36.5 OTHERS
10.37 MIDDLE EAST AND AFRICA AGRICULTURE IN E-COMMERCE PACKAGING MARKET, BY REGION, 2018-2033 (USD THOUSAND)
10.37.1 ASIA-PACIFIC
10.37.2 NORTH AMERICA
10.37.3 EUROPE
10.37.4 SOUTH AMERICA
10.37.5 MIDDLE EAST & AFRICA
10.38 MIDDLE EAST AND AFRICA FURNITURE IN E-COMMERCE PACKAGING MARKET, BY CHANNEL TYPE, 2018-2033 (USD THOUSAND)
10.38.1 RETAIL
10.38.2 WHOLESALE
10.39 MIDDLE EAST AND AFRICA FURNITURE IN E-COMMERCE PACKAGING MARKET, BY REGION, 2018-2033 (USD THOUSAND)
10.39.1 ASIA-PACIFIC
10.39.2 NORTH AMERICA
10.39.3 EUROPE
10.39.4 SOUTH AMERICA
10.39.5 MIDDLE EAST & AFRICA
10.4 MIDDLE EAST AND AFRICA WOOD AND WOOD PRODUCTS (EX. FURNITURE) IN E-COMMERCE PACKAGING MARKET, BY CHANNEL TYPE, 2018-2033 (USD THOUSAND)
10.40.1 RETAIL
10.40.2 WHOLESALE
10.41 MIDDLE EAST AND AFRICA WOOD AND WOOD PRODUCTS (EX. FURNITURE) IN E-COMMERCE PACKAGING MARKET, BY REGION, 2018-2033 (USD THOUSAND)
10.41.1 ASIA-PACIFIC
10.41.2 NORTH AMERICA
10.41.3 EUROPE
10.41.4 SOUTH AMERICA
10.41.5 MIDDLE EAST & AFRICA
10.42 MIDDLE EAST AND AFRICA LEATHER AND LEATHER GOODS PRODUCTS IN E-COMMERCE PACKAGING MARKET, BY CHANNEL TYPE, 2018-2033 (USD THOUSAND)
10.42.1 RETAIL
10.42.2 WHOLESALE
10.43 MIDDLE EAST AND AFRICA LEATHER AND LEATHER GOODS PRODUCTS IN E-COMMERCE PACKAGING MARKET, BY REGION, 2018-2033 (USD THOUSAND)
10.43.1 ASIA-PACIFIC
10.43.2 NORTH AMERICA
10.43.3 EUROPE
10.43.4 SOUTH AMERICA
10.43.5 MIDDLE EAST & AFRICA
10.44 MIDDLE EAST AND AFRICA CONSTRUCTION MATERIALS IN E-COMMERCE PACKAGING MARKET, BY CHANNEL TYPE, 2018-2033 (USD THOUSAND)
10.44.1 RETAIL
10.44.2 WHOLESALE
10.45 MIDDLE EAST AND AFRICA CONSTRUCTION MATERIALS IN E-COMMERCE PACKAGING MARKET, BY REGION, 2018-2033 (USD THOUSAND)
10.45.1 ASIA-PACIFIC
10.45.2 NORTH AMERICA
10.45.3 EUROPE
10.45.4 SOUTH AMERICA
10.45.5 MIDDLE EAST & AFRICA
10.46 MIDDLE EAST AND AFRICA TOBACCO PRODUCTS IN E-COMMERCE PACKAGING MARKET, BY CHANNEL TYPE, 2018-2033 (USD THOUSAND)
10.46.1 RETAIL
10.46.2 WHOLESALE
10.47 MIDDLE EAST AND AFRICA TOBACCO PRODUCTS IN E-COMMERCE PACKAGING MARKET, BY REGION, 2018-2033 (USD THOUSAND)
10.47.1 ASIA-PACIFIC
10.47.2 NORTH AMERICA
10.47.3 EUROPE
10.47.4 SOUTH AMERICA
10.47.5 MIDDLE EAST & AFRICA
10.48 MIDDLE EAST AND AFRICA OTHERS IN E-COMMERCE PACKAGING MARKET, BY CHANNEL TYPE, 2018-2033 (USD THOUSAND)
10.48.1 CORRUGATED BOXES
10.48.2 BAGS
10.48.3 MAILER
10.48.4 LABELS
10.48.5 PROTECTIVE PACKAGING
10.48.6 PALLET BOXES
10.48.7 TAPES
10.48.8 POSTAL PACKAGING
10.48.9 SHRINK FILM
10.49 MIDDLE EAST AND AFRICA OTHERS IN E-COMMERCE PACKAGING MARKET, BY REGION, 2018-2033 (USD THOUSAND)
10.49.1 ASIA-PACIFIC
10.49.2 NORTH AMERICA
10.49.3 EUROPE
10.49.4 SOUTH AMERICA
10.49.5 MIDDLE EAST & AFRICA
11 MIDDLE EAST AND AFRICA E-COMMERCE PACKAGING MARKET, BY DISTRIBUTION CHANNEL.
11.1 OVERVIEW
11.2 MIDDLE EAST AND AFRICA E-COMMERCE PACKAGING MARKET, BY DISTRIBUTION CHANNEL, 2018-2033 (USD THOUSAND)
11.2.1 DIRECT
11.2.2 INDIRECT
11.3 MIDDLE EAST AND AFRICA DIRECT SALES IN E-COMMERCE PACKAGING MARKET, BY TYPE, 2018-2033 (USD THOUSAND)
11.3.1 COMPANY OWNED WEBSITES
11.3.2 FIELD AGENTS
11.3.3 DIRECT CONTRACTS
11.4 MIDDLE EAST AND AFRICA INDIRECT SALES IN E-COMMERCE PACKAGING MARKET, BY TYPE, 2018-2033 (USD THOUSAND)
11.4.1 DISTRIBUTORS / WHOLESALERS
11.4.2 VALUE-ADDED RESELLERS (VARS)
11.4.3 THIRD-PARTY ONLINE MARKETPLACES
11.5 MIDDLE EAST AND AFRICA DIRECT SALE IN E-COMMERCE PACKAGING MARKET, BY REGION, 2018-2033 (USD THOUSAND)
11.5.1 ASIA-PACIFIC
11.5.2 NORTH AMERICA
11.5.3 EUROPE
11.5.4 SOUTH AMERICA
11.5.5 MIDDLE EAST & AFRICA
11.6 MIDDLE EAST AND AFRICA INDIRECT SALE IN E-COMMERCE PACKAGING MARKET, BY REGION, 2018-2033 (USD THOUSAND)
11.6.1 ASIA-PACIFIC
11.6.2 NORTH AMERICA
11.6.3 EUROPE
11.6.4 SOUTH AMERICA
11.6.5 MIDDLE EAST & AFRICA
12 MIDDLE EAST AND AFRICA E-COMMERCE PACKAGING MARKET, BY GEOGRAPHY
12.1 MIDDLE EAST AND AFRICA
12.1.1 SAUDI ARABIA
12.1.2 UNITED ARAB EMIRATES (UAE)
12.1.3 EGYPT
12.1.4 ISRAEL
12.1.5 SOUTH AFRICA
12.1.6 QATAR
12.1.7 KUWAIT
12.1.8 BAHRAIN
12.1.9 OMAN
12.1.10 REST OF MIDDLE EAST AND AFRICA
13 MIDDLE EAST AND AFRICA E-COMMERCE PACKAGING MARKET: COMPANY LANDSCAPE
13.1 MANUFACTURER COMPANY SHARE ANALYSIS: GLOBAL
14 SWOT ANALYSIS
15 MANUFACTURERS COMPANY PROFILE
15.1 INTERNATIONAL PAPER
15.1.1 COMPANY SNAPSHOT
15.1.2 REVENUE ANALYSIS
15.1.3 COMPANY SHARE ANALYSIS
15.1.4 PRODUCT PORTFOLIO
15.1.5 RECENT DEVELOPMENT
15.2 AMCOR PLC
15.2.1 COMPANY SNAPSHOT
15.2.2 REVENUE ANALYSIS
15.2.3 COMPANY SHARE ANALYSIS
15.2.4 PRODUCT PORTFOLIO
15.2.5 RECENT DEVELOPMENT
15.3 DS SMITH
15.3.1 COMPANY SNAPSHOT
15.3.2 COMPANY SHARE ANALYSIS
15.3.3 PRODUCT PORTFOLIO
15.3.4 RECENT DEVELOPMENT
15.4 SMURFIT WESTROCK
15.4.1 COMPANY SNAPSHOT
15.4.2 REVENUE ANALYSIS
15.4.3 COMPANY SHARE ANALYSIS
15.4.4 PRODUCT PORTFOLIO
15.4.5 RECENT DEVELOPMENT
15.5 PACKAGING CORPORATION OF AMERICA.
15.5.1 COMPANY SNAPSHOT
15.5.2 REVENUE ANALYSIS
15.5.3 COMPANY SHARE ANALYSIS
15.5.4 PRODUCT PORTFOLIO
15.5.5 RECENT DEVELOPMENT
15.6 3M
15.6.1 COMPANY SNAPSHOT
15.6.2 REVENUE ANALYSIS
15.6.3 PRODUCT PORTFOLIO
15.6.4 RECENT DEVELOPMENT
15.7 ALTPAC
15.7.1 COMPANY SNAPSHOT
15.7.2 PRODUCT PORTFOLIO
15.7.3 RECENT DEVELOPMENT
15.8 AVERY DENNISON CORPORATION
15.8.1 COMPANY SNAPSHOT
15.8.2 REVENUE ANALYSIS
15.8.3 PRODUCT PORTFOLIO
15.8.4 RECENT DEVELOPMENT
15.9 BLUE BOX PACKAGING
15.9.1 COMPANY SNAPSHOT
15.9.2 PRODUCT PORTFOLIO
15.9.3 RECENT DEVELOPMENT
15.1 BOXON AB
15.10.1 COMPANY SNAPSHOT
15.10.2 PRODUCT PORTFOLIO
15.10.3 RECENT DEVELOPMENT
15.11 COSMO FILMS
15.11.1 COMPANY SNAPSHOT
15.11.2 REVENUE ANALYSIS
15.11.3 PRODUCT PORTFOLIO
15.11.4 RECENT DEVELOPMENT
15.12 ECOM PACKAGING
15.12.1 COMPANY SNAPSHOT
15.12.2 PRODUCT PORTFOLIO
15.12.3 RECENT DEVELOPMENT
15.13 ECB
15.13.1 COMPANY SNAPSHOT
15.13.2 PRODUCT PORTFOLIO
15.13.3 RECENT DEVELOPMENT
15.14 FILMAR GROUP
15.14.1 COMPANY SNAPSHOT
15.14.2 PRODUCT PORTFOLIO
15.14.3 RECENT DEVELOPMENT
15.15 GEORGIA-PACIFIC LLC
15.15.1 COMPANY SNAPSHOT
15.15.2 PRODUCT PORTFOLIO
15.15.3 RECENT DEVELOPMENT
15.16 GREEN BAY PACKAGING INC
15.16.1 COMPANY SNAPSHOT
15.16.2 PRODUCT PORTFOLIO
15.16.3 RECENT DEVELOPMENT
15.17 IPG
15.17.1 COMPANY SNAPSHOT
15.17.2 PRODUCT PORTFOLIO
15.17.3 RECENT DEVELOPMENT
15.18 KLABIN S.A
15.18.1 COMPANY SNAPSHOT
15.18.2 REVENUE ANALYSIS
15.18.3 PRODUCT PORTFOLIO
15.18.4 RECENT DEVELOPMENT
15.19 MONDI
15.19.1 COMPANY SNAPSHOT
15.19.2 REVENUE ANALYSIS
15.19.3 PRODUCT PORTFOLIO
15.19.4 RECENT DEVELOPMENT
15.2 NINE DRAGONS WORLDWIDE (CHINA) INVESTMENT GROUP CO., LTD.
15.20.1 COMPANY SNAPSHOT
15.20.2 REVENUE ANALYSIS
15.20.3 PRODUCT PORTFOLIO
15.20.4 RECENT DEVELOPMENT
15.21 OJI HOLDINGS CORPORATION.
15.21.1 COMPANY SNAPSHOT
15.21.2 REVENUE ANALYSIS
15.21.3 PRODUCT PORTFOLIO
15.21.4 RECENT DEVELOPMENT
15.22 PACKHELP
15.22.1 COMPANY SNAPSHOT
15.22.2 PRODUCT PORTFOLIO
15.22.3 RECENT DEVELOPMENT
15.23 PACKMAN PACKAGING PRIVATE LIMITED.
15.23.1 COMPANY SNAPSHOT
15.23.2 PRODUCT PORTFOLIO
15.23.3 RECENT DEVELOPMENT
15.24 PACKTEK
15.24.1 COMPANY SNAPSHOT
15.24.2 PRODUCT PORTFOLIO
15.24.3 RECENT DEVELOPMENT
15.25 PRATT INDUSTRIES INC.
15.25.1 COMPANY SNAPSHOT
15.25.2 PRODUCT PORTFOLIO
15.25.3 RECENT DEVELOPMENT
15.26 PREGIS LLC
15.26.1 COMPANY SNAPSHOT
15.26.2 PRODUCT PORTFOLIO
15.26.3 RECENT DEVELOPMENT
15.27 PREM INDUSTRIES INDIA LIMITED
15.27.1 COMPANY SNAPSHOT
15.27.2 PRODUCT PORTFOLIO
15.27.3 RECENT DEVELOPMENT
15.28 RANPAK
15.28.1 COMPANY SNAPSHOT
15.28.2 REVENUE ANALYSIS
15.28.3 PRODUCT PORTFOLIO
15.28.4 RECENT DEVELOPMENT
15.29 SEALED AIR
15.29.1 COMPANY SNAPSHOT
15.29.2 REVENUE ANALYSIS
15.29.3 PRODUCT PORTFOLIO
15.29.4 RECENT DEVELOPMENT
15.3 STORA ENSO
15.30.1 COMPANY SNAPSHOT
15.30.2 REVENUE ANALYSIS
15.30.3 PRODUCT PORTFOLIO
15.30.4 RECENT DEVELOPMENT
16 DISTRIBUTOR COMPANY PROFILE
16.1 BUNZL PLC
16.1.1 COMPANY SNAPSHOT
16.1.2 REVENUE ANALYSIS
16.1.3 PRODUCT PORTFOLIO
16.1.4 RECENT DEVELOPMENT
16.2 MACFARLANE PACKAGING (A SUBSIDIARY COMPANY OF MACFARLANE GROUP PLC)
16.2.1 COMPANY SNAPSHOT
16.2.2 REVENUE ANALYSIS
16.2.3 PRODUCT PORTFOLIO
16.2.4 RECENT DEVELOPMENT
16.3 RAJAPACK LTD
16.3.1 COMPANY SNAPSHOT
16.3.2 PRODUCT PORTFOLIO
16.3.3 RECENT DEVELOPMENT
16.4 ULINE
16.4.1 COMPANY SNAPSHOT
16.4.2 PRODUCT PORTFOLIO
16.4.3 RECENT DEVELOPMENT
16.5 VERITIV OPERATING COMPANY
16.5.1 COMPANY SNAPSHOT
16.5.2 PRODUCT PORTFOLIO
16.5.3 RECENT DEVELOPMENT
17 QUESTIONNAIRE
18 RELATED REPORTS
List of Table
TABLE 1 PRODUCTION CAPACITY OF KEY MANUFACTURERS
TABLE 2 BRAND COMPARATIVE ANALYSIS
TABLE 3 CONSUMER PREFERENCE MATRIX
TABLE 4 REGULATORY COVERAGE
TABLE 5 MIDDLE EAST AND AFRICA E-COMMERCE PACKAGING MARKET, BY PACKAGING, 2018-2033 (USD THOUSAND)
TABLE 6 MIDDLE EAST AND AFRICA E-COMMERCE PACKAGING MARKET, BY PACKAGING, 2018-2033 (THOUSAND UNITS)
TABLE 7 MIDDLE EAST AND AFRICA CORRUGATED BOXES IN E-COMMERCE PACKAGING MARKET, BY REGION, 2018-2033 (USD THOUSAND)
TABLE 8 MIDDLE EAST AND AFRICA CORRUGATED BOXES IN E-COMMERCE PACKAGING MARKET, BY REGION, 2018-2033 (THOUSAND UNITS)
TABLE 9 MIDDLE EAST AND AFRICA BAGS IN E-COMMERCE PACKAGING MARKET, BY TYPE, 2018-2033 (USD THOUSAND)
TABLE 10 MIDDLE EAST AND AFRICA BAGS IN E-COMMERCE PACKAGING MARKET, BY TYPE, 2018-2033 (THOUSAND UNITS)
TABLE 11 MIDDLE EAST AND AFRICA BAGS IN E-COMMERCE PACKAGING MARKET, BY REGION, 2018-2033 (USD THOUSAND)
TABLE 12 MIDDLE EAST AND AFRICA BAGS IN E-COMMERCE PACKAGING MARKET, BY REGION, 2018-2033 (THOUSAND UNITS)
TABLE 13 MIDDLE EAST AND AFRICA MAILER IN E-COMMERCE PACKAGING MARKET, BY REGION, 2018-2033 (USD THOUSAND)
TABLE 14 MIDDLE EAST AND AFRICA MAILER IN E-COMMERCE PACKAGING MARKET, BY REGION, 2018-2033 (THOUSAND UNITS)
TABLE 15 MIDDLE EAST AND AFRICA LABELS IN E-COMMERCE PACKAGING MARKET, BY REGION, 2018-2033 (USD THOUSAND)
TABLE 16 MIDDLE EAST AND AFRICA LABELS IN E-COMMERCE PACKAGING MARKET, BY REGION, 2018-2033 (THOUSAND UNITS)
TABLE 17 MIDDLE EAST AND AFRICA TAPES IN E-COMMERCE PACKAGING MARKET, BY TYPE, 2018-2033 (USD THOUSAND)
TABLE 18 MIDDLE EAST AND AFRICA TAPES IN E-COMMERCE PACKAGING MARKET, BY TYPE, 2018-2033 (THOUSAND UNITS)
TABLE 19 MIDDLE EAST AND AFRICA TAPES IN E-COMMERCE PACKAGING MARKET, BY REGION, 2018-2033 (USD THOUSAND)
TABLE 20 MIDDLE EAST AND AFRICA TAPES IN E-COMMERCE PACKAGING MARKET, BY REGION, 2018-2033 (THOUSAND UNITS)
TABLE 21 MIDDLE EAST AND AFRICA PROTECTIVE PACKAGING IN E-COMMERCE PACKAGING MARKET, BY TYPE, 2018-2033 (USD THOUSAND)
TABLE 22 MIDDLE EAST AND AFRICA PROTECTIVE PACKAGING IN E-COMMERCE PACKAGING MARKET, BY TYPE, 2018-2033 (THOUSAND UNITS )
TABLE 23 MIDDLE EAST AND AFRICA PROTECTIVE PACKAGING IN E-COMMERCE PACKAGING MARKET, BY REGION, 2018-2033 (USD THOUSAND)
TABLE 24 MIDDLE EAST AND AFRICA PROTECTIVE PACKAGING IN E-COMMERCE PACKAGING MARKET, BY REGION, 2018-2033 (THOUSAND UNITS)
TABLE 25 MIDDLE EAST AND AFRICA PALLET BOXES IN E-COMMERCE PACKAGING MARKET, BY REGION, 2018-2033 (USD THOUSAND)
TABLE 26 MIDDLE EAST AND AFRICA PALLET BOXES IN E-COMMERCE PACKAGING MARKET, BY REGION, 2018-2033 (THOUSAND UNITS)
TABLE 27 MIDDLE EAST AND AFRICA POSTAL PACKAGING IN E-COMMERCE PACKAGING MARKET, BY REGION, 2018-2033 (USD THOUSAND)
TABLE 28 MIDDLE EAST AND AFRICA POSTAL PACKAGING IN E-COMMERCE PACKAGING MARKET, BY REGION, 2018-2033 (THOUSAND UNITS)
TABLE 29 MIDDLE EAST AND AFRICA SHRINK FILM IN E-COMMERCE PACKAGING MARKET, BY REGION, 2018-2033 (USD THOUSAND)
TABLE 30 MIDDLE EAST AND AFRICA SHRINK FILMING E-COMMERCE PACKAGING MARKET, BY REGION, 2018-2033 (THOUSAND UNITS)
TABLE 31 MIDDLE EAST AND AFRICA E-COMMERCE PACKAGING MARKET, BY MATERIAL, 2018-2033 (USD THOUSAND)
TABLE 32 MIDDLE EAST AND AFRICA FIBER-BASED IN E-COMMERCE PACKAGING MARKET, BY TYPE, 2018-2033 (USD THOUSAND)
TABLE 33 MIDDLE EAST AND AFRICA CORRUGATED BOARD IN E-COMMERCE PACKAGING MARKET, BY TYPE, 2018-2033 (USD THOUSAND)
TABLE 34 MIDDLE EAST AND AFRICA FIBER-BASED IN E-COMMERCE PACKAGING MARKET, BY REGION, 2018-2033 (USD THOUSAND)
TABLE 35 MIDDLE EAST AND AFRICA RECYCLED CONTENT & POST-CONSUMER RECYCLED (PCR) PLASTICS IN E-COMMERCE PACKAGING MARKET, BY REGION, 2018-2033 (USD THOUSAND)
TABLE 36 MIDDLE EAST AND AFRICA BIO-BASED MATERIALS IN E-COMMERCE PACKAGING MARKET, BY REGION, 2018-2033 (USD THOUSAND)
TABLE 37 MIDDLE EAST AND AFRICA CONVENTIONAL PLASTICS (VIRGIN PLASTICS) IN E-COMMERCE PACKAGING MARKET, BY REGION, 2018-2033 (USD THOUSAND)
TABLE 38 MIDDLE EAST AND AFRICA OTHERS IN E-COMMERCE PACKAGING MARKET, BY REGION, 2018-2033 (USD THOUSAND)
TABLE 39 MIDDLE EAST AND AFRICA E-COMMERCE PACKAGING MARKET, BY END-USER, 2018-2033 (USD THOUSAND)
TABLE 40 MIDDLE EAST AND AFRICA APPAREL & ACCESSORIES IN E-COMMERCE PACKAGING MARKET, BY CHANNEL TYPE, 2018-2033 (USD THOUSAND)
TABLE 41 MIDDLE EAST AND AFRICA APPAREL & ACCESSORIES IN E-COMMERCE PACKAGING MARKET, BY PACKAGING, 2018-2033 (USD THOUSAND)
TABLE 42 MIDDLE EAST AND AFRICA APPAREL & ACCESSORIES IN E-COMMERCE PACKAGING MARKET, BY REGION, 2018-2033 (USD THOUSAND)
TABLE 43 MIDDLE EAST AND AFRICA ELECTRONICS & ELECTRICAL IN E-COMMERCE PACKAGING MARKET, BY CHANNEL TYPE, 2018-2033 (USD THOUSAND)
TABLE 44 MIDDLE EAST AND AFRICA ELECTRONICS & ELECTRICAL IN E-COMMERCE PACKAGING MARKET, BY PACKAGING, 2018-2033 (USD THOUSAND)
TABLE 45 MIDDLE EAST AND AFRICA ELECTRONICS & ELECTRICAL IN E-COMMERCE PACKAGING MARKET, BY TYPE, 2018-2033 (USD THOUSAND)
TABLE 46 MIDDLE EAST AND AFRICA ELECTRONICS & ELECTRICAL IN E-COMMERCE PACKAGING MARKET, BY REGION, 2018-2033 (USD THOUSAND)
TABLE 47 MIDDLE EAST AND AFRICA TEXTILE IN E-COMMERCE PACKAGING MARKET, BY CHANNEL TYPE, 2018-2033 (USD THOUSAND)
TABLE 48 MIDDLE EAST AND AFRICA TEXTILE IN E-COMMERCE PACKAGING MARKET, BY PACKAGING, 2018-2033 (USD THOUSAND)
TABLE 49 MIDDLE EAST AND AFRICA TEXTILE IN E-COMMERCE PACKAGING MARKET, BY REGION, 2018-2033 (USD THOUSAND)
TABLE 50 MIDDLE EAST AND AFRICA HOUSEHOLD IN E-COMMERCE PACKAGING MARKET, BY CHANNEL TYPE, 2018-2033 (USD THOUSAND)
TABLE 51 MIDDLE EAST AND AFRICA HOUSEHOLD IN E-COMMERCE PACKAGING MARKET, BY PACKAGING, 2018-2033 (USD THOUSAND)
TABLE 52 MIDDLE EAST AND AFRICA HOUSEHOLD IN E-COMMERCE PACKAGING MARKET, BY REGION, 2018-2033 (USD THOUSAND)
TABLE 53 MIDDLE EAST AND AFRICA PERSONAL CARE IN E-COMMERCE PACKAGING MARKET, BY CHANNEL TYPE, 2018-2033 (USD THOUSAND)
TABLE 54 MIDDLE EAST AND AFRICA PERSONAL CARE IN E-COMMERCE PACKAGING MARKET, BY PACKAGING, 2018-2033 (USD THOUSAND)
TABLE 55 MIDDLE EAST AND AFRICA PERSONAL CARE IN E-COMMERCE PACKAGING MARKET, BY REGION, 2018-2033 (USD THOUSAND)
TABLE 56 MIDDLE EAST AND AFRICA FOOD AND BEVERAGES IN E-COMMERCE PACKAGING MARKET, BY CHANNEL TYPE, 2018-2033 (USD THOUSAND)
TABLE 57 MIDDLE EAST AND AFRICA FOOD AND BEVERAGES IN E-COMMERCE PACKAGING MARKET, BY PACKAGING, 2018-2033 (USD THOUSAND)
TABLE 58 MIDDLE EAST AND AFRICA FOOD AND BEVERAGES IN E-COMMERCE PACKAGING MARKET, BY TYPE, 2018-2033 (USD THOUSAND)
TABLE 59 MIDDLE EAST AND AFRICA FOOD AND BEVERAGES IN E-COMMERCE PACKAGING MARKET, BY REGION, 2018-2033 (USD THOUSAND)
TABLE 60 MIDDLE EAST AND AFRICA PHARMACEUTICALS IN E-COMMERCE PACKAGING MARKET, BY CHANNEL TYPE, 2018-2033 (USD THOUSAND)
TABLE 61 MIDDLE EAST AND AFRICA PHARMACEUTICALS IN E-COMMERCE PACKAGING MARKET, BY PACKAGING, 2018-2033 (USD THOUSAND)
TABLE 62 MIDDLE EAST AND AFRICA PHARMACEUTICALS IN E-COMMERCE PACKAGING MARKET, BY REGION, 2018-2033 (USD THOUSAND)
TABLE 63 MIDDLE EAST AND AFRICA AUTOMOTIVE IN E-COMMERCE PACKAGING MARKET, BY CHANNEL TYPE, 2018-2033 (USD THOUSAND)
TABLE 64 MIDDLE EAST AND AFRICA AUTOMOTIVE IN E-COMMERCE PACKAGING MARKET, BY PACKAGING, 2018-2033 (USD THOUSAND)
TABLE 65 MIDDLE EAST AND AFRICA AUTOMOTIVE IN E-COMMERCE PACKAGING MARKET, BY COMMODITY TYPE, 2018-2033 (USD THOUSAND)
TABLE 66 MIDDLE EAST AND AFRICA AUTOMOTIVE IN E-COMMERCE PACKAGING MARKET, BY REGION, 2018-2033 (USD THOUSAND)
TABLE 67 MIDDLE EAST AND AFRICA FABRICATED METAL PRODUCTS IN E-COMMERCE PACKAGING MARKET, BY CHANNEL TYPE, 2018-2033 (USD THOUSAND)
TABLE 68 MIDDLE EAST AND AFRICA FABRICATED METAL PRODUCTS IN E-COMMERCE PACKAGING MARKET, BY REGION, 2018-2033 (USD THOUSAND)
TABLE 69 MIDDLE EAST AND AFRICA CHEMICAL PRODUCTS IN E-COMMERCE PACKAGING MARKET, BY CHANNEL TYPE, 2018-2033 (USD THOUSAND)
TABLE 70 MIDDLE EAST AND AFRICA CHEMICAL PRODUCTS IN E-COMMERCE PACKAGING MARKET, BY REGION, 2018-2033 (USD THOUSAND)
TABLE 71 MIDDLE EAST AND AFRICA AGRICULTURE IN E-COMMERCE PACKAGING MARKET, BY CHANNEL TYPE, 2018-2033 (USD THOUSAND)
TABLE 72 MIDDLE EAST AND AFRICA AGRICULTURE IN E-COMMERCE PACKAGING MARKET, BY TYPE, 2018-2033 (USD THOUSAND)
TABLE 73 MIDDLE EAST AND AFRICA AGRICULTURE IN E-COMMERCE PACKAGING MARKET, BY REGION, 2018-2033 (USD THOUSAND)
TABLE 74 MIDDLE EAST AND AFRICA FURNITURE IN E-COMMERCE PACKAGING MARKET, BY CHANNEL TYPE, 2018-2033 (USD THOUSAND)
TABLE 75 MIDDLE EAST AND AFRICA FURNITURE IN E-COMMERCE PACKAGING MARKET, BY REGION, 2018-2033 (USD THOUSAND)
TABLE 76 MIDDLE EAST AND AFRICA WOOD AND WOOD PRODUCTS (EX. FURNITURE) IN E-COMMERCE PACKAGING MARKET, BY CHANNEL TYPE, 2018-2033 (USD THOUSAND)
TABLE 77 MIDDLE EAST AND AFRICA WOOD AND WOOD PRODUCTS (EX. FURNITURE) IN E-COMMERCE PACKAGING MARKET, BY REGION, 2018-2033 (USD THOUSAND)
TABLE 78 MIDDLE EAST AND AFRICA LEATHER AND LEATHER GOODS PRODUCTS IN E-COMMERCE PACKAGING MARKET, BY CHANNEL TYPE, 2018-2033 (USD THOUSAND)
TABLE 79 MIDDLE EAST AND AFRICA LEATHER AND LEATHER GOODS PRODUCTS IN E-COMMERCE PACKAGING MARKET, BY REGION, 2018-2033 (USD THOUSAND)
TABLE 80 MIDDLE EAST AND AFRICA CONSTRUCTION MATERIALS IN E-COMMERCE PACKAGING MARKET, BY CHANNEL TYPE, 2018-2033 (USD THOUSAND)
TABLE 81 MIDDLE EAST AND AFRICA CONSTRUCTION MATERIALS IN E-COMMERCE PACKAGING MARKET, BY REGION, 2018-2033 (USD THOUSAND)
TABLE 82 MIDDLE EAST AND AFRICA TOBACCO PRODUCTS IN E-COMMERCE PACKAGING MARKET, BY CHANNEL TYPE, 2018-2033 (USD THOUSAND)
TABLE 83 MIDDLE EAST AND AFRICA TOBACCO PRODUCTS IN E-COMMERCE PACKAGING MARKET, BY REGION, 2018-2033 (USD THOUSAND)
TABLE 84 MIDDLE EAST AND AFRICA OTHERS IN E-COMMERCE PACKAGING MARKET, BY CHANNEL TYPE, 2018-2033 (USD THOUSAND)
TABLE 85 MIDDLE EAST AND AFRICA OTHERS IN E-COMMERCE PACKAGING MARKET, BY PACKAGING, 2018-2033 (USD THOUSAND)
TABLE 86 MIDDLE EAST AND AFRICA OTHERS IN E-COMMERCE PACKAGING MARKET, BY REGION, 2018-2033 (USD THOUSAND)
TABLE 87 MIDDLE EAST AND AFRICA E-COMMERCE PACKAGING MARKET, BY DISTRIBUTION CHANNEL, 2018-2033 (USD THOUSAND)
TABLE 88 MIDDLE EAST AND AFRICA DIRECT SALES IN E-COMMERCE PACKAGING MARKET, BY TYPE, 2018-2033 (USD THOUSAND)
TABLE 89 MIDDLE EAST AND AFRICA INDIRECT SALES IN E-COMMERCE PACKAGING MARKET, BY TYPE, 2018-2033 (USD THOUSAND)
TABLE 90 MIDDLE EAST AND AFRICA DIRECT SALE IN E-COMMERCE PACKAGING MARKET, BY REGION, 2018-2033 (USD THOUSAND)
TABLE 91 MIDDLE EAST AND AFRICA INDIRECT SALE IN E-COMMERCE PACKAGING MARKET, BY REGION, 2018-2033 (USD THOUSAND)
TABLE 92 MIDDLE EAST AND AFRICA
TABLE 93 MIDDLE EAST AND AFRICA E-COMMERCE PACKAGING MARKET, BY COUNTRY, 2018-2033 (USD THOUSAND)
TABLE 94 MIDDLE EAST AND AFRICA
TABLE 95 MIDDLE EAST AND AFRICA E-COMMERCE PACKAGING MARKET, BY COUNTRY, 2018-2033 (THOUSAND UNITS)
TABLE 96 THOUSAND
TABLE 97 MIDDLE EAST AND AFRICA E-COMMERCE PACKAGING MARKET, BY PACKAGING, 2018-2033 (USD THOUSAND)
TABLE 98 MIDDLE EAST AND AFRICA E-COMMERCE PACKAGING MARKET, BY PACKAGING, 2018-2033 (THOUSAND UNITS)
TABLE 99 MIDDLE EAST AND AFRICA BAGS IN E-COMMERCE PACKAGING MARKET, BY TYPE, 2018-2033 (USD THOUSAND)
TABLE 100 MIDDLE EAST AND AFRICA BAGS IN E-COMMERCE PACKAGING MARKET, BY TYPE, 2018-2033 (THOUSAND UNITS)
TABLE 101 MIDDLE EAST AND AFRICA TAPES IN E-COMMERCE PACKAGING MARKET, BY TYPE, 2018-2033 (USD THOUSAND)
TABLE 102 MIDDLE EAST AND AFRICA TAPES IN E-COMMERCE PACKAGING MARKET, BY TYPE, 2018-2033 (THOUSAND UNITS)
TABLE 103 MIDDLE EAST AND AFRICA PROTECTIVE PACKAGING IN E-COMMERCE PACKAGING MARKET, BY TYPE, 2018-2033 (USD THOUSAND)
TABLE 104 MIDDLE EAST AND AFRICA PROTECTIVE PACKAGING IN E-COMMERCE PACKAGING MARKET, BY TYPE, 2018-2033 (THOUSAND UNITS )
TABLE 105 MIDDLE EAST AND AFRICA E-COMMERCE PACKAGING MARKET, BY MATERIAL, 2018-2033 (USD THOUSAND)
TABLE 106 MIDDLE EAST AND AFRICA FIBER-BASED IN E-COMMERCE PACKAGING MARKET, BY TYPE, 2018-2033 (USD THOUSAND)
TABLE 107 MIDDLE EAST AND AFRICA CORRUGATED BOARD IN E-COMMERCE PACKAGING MARKET, BY TYPE, 2018-2033 (USD THOUSAND)
TABLE 108 MIDDLE EAST AND AFRICA E-COMMERCE PACKAGING MARKET, BY END-USER, 2018-2033 (USD THOUSAND)
TABLE 109 MIDDLE EAST AND AFRICA APPAREL & ACCESSORIES IN E-COMMERCE PACKAGING MARKET, BY CHANNEL TYPE, 2018-2033 (USD THOUSAND)
TABLE 110 MIDDLE EAST AND AFRICA APPAREL & ACCESSORIES IN E-COMMERCE PACKAGING MARKET, BY PACKAGING, 2018-2033 (USD THOUSAND)
TABLE 111 MIDDLE EAST AND AFRICA ELECTRONICS & ELECTRICAL IN E-COMMERCE PACKAGING MARKET, BY CHANNEL TYPE, 2018-2033 (USD THOUSAND)
TABLE 112 MIDDLE EAST AND AFRICA ELECTRONICS & ELECTRICAL IN E-COMMERCE PACKAGING MARKET, BY PACKAGING, 2018-2033 (USD THOUSAND)
TABLE 113 MIDDLE EAST AND AFRICA ELECTRONICS & ELECTRICAL IN E-COMMERCE PACKAGING MARKET, BY TYPE, 2018-2033 (USD THOUSAND)
TABLE 114 MIDDLE EAST AND AFRICA TEXTILE IN E-COMMERCE PACKAGING MARKET, BY CHANNEL TYPE, 2018-2033 (USD THOUSAND)
TABLE 115 MIDDLE EAST AND AFRICA TEXTILE IN E-COMMERCE PACKAGING MARKET, BY PACKAGING, 2018-2033 (USD THOUSAND)
TABLE 116 MIDDLE EAST AND AFRICA HOUSEHOLD IN E-COMMERCE PACKAGING MARKET, BY CHANNEL TYPE, 2018-2033 (USD THOUSAND)
TABLE 117 MIDDLE EAST AND AFRICA HOUSEHOLD IN E-COMMERCE PACKAGING MARKET, BY PACKAGING, 2018-2033 (USD THOUSAND)
TABLE 118 MIDDLE EAST AND AFRICA PERSONAL CARE IN E-COMMERCE PACKAGING MARKET, BY CHANNEL TYPE, 2018-2033 (USD THOUSAND)
TABLE 119 MIDDLE EAST AND AFRICA PERSONAL CARE IN E-COMMERCE PACKAGING MARKET, BY PACKAGING, 2018-2033 (USD THOUSAND)
TABLE 120 MIDDLE EAST AND AFRICA FOOD AND BEVERAGES IN E-COMMERCE PACKAGING MARKET, BY CHANNEL TYPE, 2018-2033 (USD THOUSAND)
TABLE 121 MIDDLE EAST AND AFRICA FOOD AND BEVERAGES IN E-COMMERCE PACKAGING MARKET, BY PACKAGING, 2018-2033 (USD THOUSAND)
TABLE 122 MIDDLE EAST AND AFRICA FOOD AND BEVERAGES IN E-COMMERCE PACKAGING MARKET, BY TYPE, 2018-2033 (USD THOUSAND)
TABLE 123 MIDDLE EAST AND AFRICA PHARMACEUTICALS IN E-COMMERCE PACKAGING MARKET, BY CHANNEL TYPE, 2018-2033 (USD THOUSAND)
TABLE 124 MIDDLE EAST AND AFRICA PHARMACEUTICALS IN E-COMMERCE PACKAGING MARKET, BY PACKAGING, 2018-2033 (USD THOUSAND)
TABLE 125 MIDDLE EAST AND AFRICA AUTOMOTIVE IN E-COMMERCE PACKAGING MARKET, BY CHANNEL TYPE, 2018-2033 (USD THOUSAND)
TABLE 126 MIDDLE EAST AND AFRICA AUTOMOTIVE IN E-COMMERCE PACKAGING MARKET, BY PACKAGING, 2018-2033 (USD THOUSAND)
TABLE 127 MIDDLE EAST AND AFRICA AUTOMOTIVE IN E-COMMERCE PACKAGING MARKET, BY COMMODITY TYPE, 2018-2033 (USD THOUSAND)
TABLE 128 MIDDLE EAST AND AFRICA FABRICATED METAL PRODUCTS IN E-COMMERCE PACKAGING MARKET, BY CHANNEL TYPE, 2018-2033 (USD THOUSAND)
TABLE 129 MIDDLE EAST AND AFRICA CHEMICAL PRODUCTS IN E-COMMERCE PACKAGING MARKET, BY CHANNEL TYPE, 2018-2033 (USD THOUSAND)
TABLE 130 MIDDLE EAST AND AFRICA AGRICULTURE IN E-COMMERCE PACKAGING MARKET, BY CHANNEL TYPE, 2018-2033 (USD THOUSAND)
TABLE 131 MIDDLE EAST AND AFRICA AGRICULTURE IN E-COMMERCE PACKAGING MARKET, BY TYPE, 2018-2033 (USD THOUSAND)
TABLE 132 MIDDLE EAST AND AFRICA FURNITURE IN E-COMMERCE PACKAGING MARKET, BY CHANNEL TYPE, 2018-2033 (USD THOUSAND)
TABLE 133 MIDDLE EAST AND AFRICA WOOD AND WOOD PRODUCTS (EX. FURNITURE) IN E-COMMERCE PACKAGING MARKET, BY CHANNEL TYPE, 2018-2033 (USD THOUSAND)
TABLE 134 MIDDLE EAST AND AFRICA LEATHER AND LEATHER GOODS PRODUCTS IN E-COMMERCE PACKAGING MARKET, BY CHANNEL TYPE, 2018-2033 (USD THOUSAND)
TABLE 135 MIDDLE EAST AND AFRICA CONSTRUCTION MATERIALS IN E-COMMERCE PACKAGING MARKET, BY CHANNEL TYPE, 2018-2033 (USD THOUSAND)
TABLE 136 MIDDLE EAST AND AFRICA TOBACCO PRODUCTS IN E-COMMERCE PACKAGING MARKET, BY CHANNEL TYPE, 2018-2033 (USD THOUSAND)
TABLE 137 MIDDLE EAST AND AFRICA OTHERS IN E-COMMERCE PACKAGING MARKET, BY CHANNEL TYPE, 2018-2033 (USD THOUSAND)
TABLE 138 MIDDLE EAST AND AFRICA OTHERS IN E-COMMERCE PACKAGING MARKET, BY PACKAGING, 2018-2033 (USD THOUSAND)
TABLE 139 MIDDLE EAST AND AFRICA E-COMMERCE PACKAGING MARKET, BY DISTRIBUTION CHANNEL, 2018-2033 (USD THOUSAND)
TABLE 140 MIDDLE EAST AND AFRICA DIRECT SALES IN E-COMMERCE PACKAGING MARKET, BY TYPE, 2018-2033 (USD THOUSAND)
TABLE 141 MIDDLE EAST AND AFRICA INDIRECT SALES IN E-COMMERCE PACKAGING MARKET, BY TYPE, 2018-2033 (USD THOUSAND)
TABLE 142 SAUDI ARABIA E-COMMERCE PACKAGING MARKET, BY PACKAGING, 2018-2033 (USD THOUSAND)
TABLE 143 SAUDI ARABIA E-COMMERCE PACKAGING MARKET, BY PACKAGING, 2018-2033 (THOUSAND UNITS)
TABLE 144 SAUDI ARABIA BAGS IN E-COMMERCE PACKAGING MARKET, BY TYPE, 2018-2033 (USD THOUSAND)
TABLE 145 SAUDI ARABIA BAGS IN E-COMMERCE PACKAGING MARKET, BY TYPE, 2018-2033 (THOUSAND UNITS)
TABLE 146 SAUDI ARABIA TAPES IN E-COMMERCE PACKAGING MARKET, BY TYPE, 2018-2033 (USD THOUSAND)
TABLE 147 SAUDI ARABIA TAPES IN E-COMMERCE PACKAGING MARKET, BY TYPE, 2018-2033 (THOUSAND UNITS)
TABLE 148 SAUDI ARABIA PROTECTIVE PACKAGING IN E-COMMERCE PACKAGING MARKET, BY TYPE, 2018-2033 (USD THOUSAND)
TABLE 149 SAUDI ARABIA PROTECTIVE PACKAGING IN E-COMMERCE PACKAGING MARKET, BY TYPE, 2018-2033 (THOUSAND UNITS )
TABLE 150 SAUDI ARABIA E-COMMERCE PACKAGING MARKET, BY MATERIAL, 2018-2033 (USD THOUSAND)
TABLE 151 SAUDI ARABIA FIBER-BASED IN E-COMMERCE PACKAGING MARKET, BY TYPE, 2018-2033 (USD THOUSAND)
TABLE 152 SAUDI ARABIA CORRUGATED BOARD IN E-COMMERCE PACKAGING MARKET, BY TYPE, 2018-2033 (USD THOUSAND)
TABLE 153 SAUDI ARABIA E-COMMERCE PACKAGING MARKET, BY END-USER, 2018-2033 (USD THOUSAND)
TABLE 154 SAUDI ARABIA APPAREL & ACCESSORIES IN E-COMMERCE PACKAGING MARKET, BY CHANNEL TYPE, 2018-2033 (USD THOUSAND)
TABLE 155 SAUDI ARABIA APPAREL & ACCESSORIES IN E-COMMERCE PACKAGING MARKET, BY PACKAGING, 2018-2033 (USD THOUSAND)
TABLE 156 SAUDI ARABIA ELECTRONICS & ELECTRICAL IN E-COMMERCE PACKAGING MARKET, BY CHANNEL TYPE, 2018-2033 (USD THOUSAND)
TABLE 157 SAUDI ARABIA ELECTRONICS & ELECTRICAL IN E-COMMERCE PACKAGING MARKET, BY PACKAGING, 2018-2033 (USD THOUSAND)
TABLE 158 SAUDI ARABIA ELECTRONICS & ELECTRICAL IN E-COMMERCE PACKAGING MARKET, BY TYPE, 2018-2033 (USD THOUSAND)
TABLE 159 SAUDI ARABIA TEXTILE IN E-COMMERCE PACKAGING MARKET, BY CHANNEL TYPE, 2018-2033 (USD THOUSAND)
TABLE 160 SAUDI ARABIA TEXTILE IN E-COMMERCE PACKAGING MARKET, BY PACKAGING, 2018-2033 (USD THOUSAND)
TABLE 161 SAUDI ARABIA HOUSEHOLD IN E-COMMERCE PACKAGING MARKET, BY CHANNEL TYPE, 2018-2033 (USD THOUSAND)
TABLE 162 SAUDI ARABIA HOUSEHOLD IN E-COMMERCE PACKAGING MARKET, BY PACKAGING, 2018-2033 (USD THOUSAND)
TABLE 163 SAUDI ARABIA PERSONAL CARE IN E-COMMERCE PACKAGING MARKET, BY CHANNEL TYPE, 2018-2033 (USD THOUSAND)
TABLE 164 SAUDI ARABIA PERSONAL CARE IN E-COMMERCE PACKAGING MARKET, BY PACKAGING, 2018-2033 (USD THOUSAND)
TABLE 165 SAUDI ARABIA FOOD AND BEVERAGES IN E-COMMERCE PACKAGING MARKET, BY CHANNEL TYPE, 2018-2033 (USD THOUSAND)
TABLE 166 SAUDI ARABIA FOOD AND BEVERAGES IN E-COMMERCE PACKAGING MARKET, BY PACKAGING, 2018-2033 (USD THOUSAND)
TABLE 167 SAUDI ARABIA FOOD AND BEVERAGES IN E-COMMERCE PACKAGING MARKET, BY TYPE, 2018-2033 (USD THOUSAND)
TABLE 168 SAUDI ARABIA PHARMACEUTICALS IN E-COMMERCE PACKAGING MARKET, BY CHANNEL TYPE, 2018-2033 (USD THOUSAND)
TABLE 169 SAUDI ARABIA PHARMACEUTICALS IN E-COMMERCE PACKAGING MARKET, BY PACKAGING, 2018-2033 (USD THOUSAND)
TABLE 170 SAUDI ARABIA AUTOMOTIVE IN E-COMMERCE PACKAGING MARKET, BY CHANNEL TYPE, 2018-2033 (USD THOUSAND)
TABLE 171 SAUDI ARABIA AUTOMOTIVE IN E-COMMERCE PACKAGING MARKET, BY PACKAGING, 2018-2033 (USD THOUSAND)
TABLE 172 SAUDI ARABIA AUTOMOTIVE IN E-COMMERCE PACKAGING MARKET, BY COMMODITY TYPE, 2018-2033 (USD THOUSAND)
TABLE 173 SAUDI ARABIA FABRICATED METAL PRODUCTS IN E-COMMERCE PACKAGING MARKET, BY CHANNEL TYPE, 2018-2033 (USD THOUSAND)
TABLE 174 SAUDI ARABIA CHEMICAL PRODUCTS IN E-COMMERCE PACKAGING MARKET, BY CHANNEL TYPE, 2018-2033 (USD THOUSAND)
TABLE 175 SAUDI ARABIA AGRICULTURE IN E-COMMERCE PACKAGING MARKET, BY CHANNEL TYPE, 2018-2033 (USD THOUSAND)
TABLE 176 SAUDI ARABIA AGRICULTURE IN E-COMMERCE PACKAGING MARKET, BY TYPE, 2018-2033 (USD THOUSAND)
TABLE 177 SAUDI ARABIA FURNITURE IN E-COMMERCE PACKAGING MARKET, BY CHANNEL TYPE, 2018-2033 (USD THOUSAND)
TABLE 178 SAUDI ARABIA WOOD AND WOOD PRODUCTS (EX. FURNITURE) IN E-COMMERCE PACKAGING MARKET, BY CHANNEL TYPE, 2018-2033 (USD THOUSAND)
TABLE 179 SAUDI ARABIA LEATHER AND LEATHER GOODS IN E-COMMERCE PACKAGING MARKET, BY CHANNEL TYPE, 2018-2033 (USD THOUSAND)
TABLE 180 SAUDI ARABIA CONSTRUCTION MATERIALS IN E-COMMERCE PACKAGING MARKET, BY CHANNEL TYPE, 2018-2033 (USD THOUSAND)
TABLE 181 SAUDI ARABIA TOBACCO PRODUCTS IN E-COMMERCE PACKAGING MARKET, BY CHANNEL TYPE, 2018-2033 (USD THOUSAND)
TABLE 182 SAUDI ARABIA OTHERS IN E-COMMERCE PACKAGING MARKET, BY CHANNEL TYPE, 2018-2033 (USD THOUSAND)
TABLE 183 SAUDI ARABIA OTHERS IN E-COMMERCE PACKAGING MARKET, BY PACKAGING, 2018-2033 (USD THOUSAND)
TABLE 184 SAUDI ARABIA E-COMMERCE PACKAGING MARKET, BY DISTRIBUTION CHANNEL, 2018-2033 (USD THOUSAND)
TABLE 185 SAUDI ARABIA DIRECT SALES IN E-COMMERCE PACKAGING MARKET, BY TYPE, 2018-2033 (USD THOUSAND)
TABLE 186 SAUDI ARABIA INDIRECT SALES IN E-COMMERCE PACKAGING MARKET, BY TYPE, 2018-2033 (USD THOUSAND)
TABLE 187 UAE E-COMMERCE PACKAGING MARKET, BY PACKAGING, 2018-2033 (USD THOUSAND)
TABLE 188 UAE E-COMMERCE PACKAGING MARKET, BY PACKAGING, 2018-2033 (THOUSAND UNITS)
TABLE 189 UAE BAGS IN E-COMMERCE PACKAGING MARKET, BY TYPE, 2018-2033 (USD THOUSAND)
TABLE 190 UAE BAGS IN E-COMMERCE PACKAGING MARKET, BY TYPE, 2018-2033 (THOUSAND UNITS)
TABLE 191 UAE TAPES IN E-COMMERCE PACKAGING MARKET, BY TYPE, 2018-2033 (USD THOUSAND)
TABLE 192 UAE TAPES IN E-COMMERCE PACKAGING MARKET, BY TYPE, 2018-2033 (THOUSAND UNITS)
TABLE 193 UAE PROTECTIVE PACKAGING IN E-COMMERCE PACKAGING MARKET, BY TYPE, 2018-2033 (USD THOUSAND)
TABLE 194 UAE PROTECTIVE PACKAGING IN E-COMMERCE PACKAGING MARKET, BY TYPE, 2018-2033 (THOUSAND UNITS )
TABLE 195 UAE E-COMMERCE PACKAGING MARKET, BY MATERIAL, 2018-2033 (USD THOUSAND)
TABLE 196 UAE FIBER-BASED IN E-COMMERCE PACKAGING MARKET, BY TYPE, 2018-2033 (USD THOUSAND)
TABLE 197 UAE CORRUGATED BOARD IN E-COMMERCE PACKAGING MARKET, BY TYPE, 2018-2033 (USD THOUSAND)
TABLE 198 UAE E-COMMERCE PACKAGING MARKET, BY END-USER, 2018-2033 (USD THOUSAND)
TABLE 199 UAE APPAREL & ACCESSORIES IN E-COMMERCE PACKAGING MARKET, BY CHANNEL TYPE, 2018-2033 (USD THOUSAND)
TABLE 200 UAE APPAREL & ACCESSORIES IN E-COMMERCE PACKAGING MARKET, BY PACKAGING, 2018-2033 (USD THOUSAND)
TABLE 201 UAE ELECTRONICS & ELECTRICAL IN E-COMMERCE PACKAGING MARKET, BY CHANNEL TYPE, 2018-2033 (USD THOUSAND)
TABLE 202 UAE ELECTRONICS & ELECTRICAL IN E-COMMERCE PACKAGING MARKET, BY PACKAGING, 2018-2033 (USD THOUSAND)
TABLE 203 UAE ELECTRONICS & ELECTRICAL IN E-COMMERCE PACKAGING MARKET, BY TYPE, 2018-2033 (USD THOUSAND)
TABLE 204 UAE TEXTILE IN E-COMMERCE PACKAGING MARKET, BY CHANNEL TYPE, 2018-2033 (USD THOUSAND)
TABLE 205 UAE TEXTILE IN E-COMMERCE PACKAGING MARKET, BY PACKAGING, 2018-2033 (USD THOUSAND)
TABLE 206 UAE HOUSEHOLD IN E-COMMERCE PACKAGING MARKET, BY CHANNEL TYPE, 2018-2033 (USD THOUSAND)
TABLE 207 UAE HOUSEHOLD IN E-COMMERCE PACKAGING MARKET, BY PACKAGING, 2018-2033 (USD THOUSAND)
TABLE 208 UAE PERSONAL CARE IN E-COMMERCE PACKAGING MARKET, BY CHANNEL TYPE, 2018-2033 (USD THOUSAND)
TABLE 209 UAE PERSONAL CARE IN E-COMMERCE PACKAGING MARKET, BY PACKAGING, 2018-2033 (USD THOUSAND)
TABLE 210 UAE FOOD AND BEVERAGES IN E-COMMERCE PACKAGING MARKET, BY CHANNEL TYPE, 2018-2033 (USD THOUSAND)
TABLE 211 UAE FOOD AND BEVERAGES IN E-COMMERCE PACKAGING MARKET, BY PACKAGING, 2018-2033 (USD THOUSAND)
TABLE 212 UAE FOOD AND BEVERAGES IN E-COMMERCE PACKAGING MARKET, BY TYPE, 2018-2033 (USD THOUSAND)
TABLE 213 UAE PHARMACEUTICALS IN E-COMMERCE PACKAGING MARKET, BY CHANNEL TYPE, 2018-2033 (USD THOUSAND)
TABLE 214 UAE PHARMACEUTICALS IN E-COMMERCE PACKAGING MARKET, BY PACKAGING, 2018-2033 (USD THOUSAND)
TABLE 215 UAE AUTOMOTIVE IN E-COMMERCE PACKAGING MARKET, BY CHANNEL TYPE, 2018-2033 (USD THOUSAND)
TABLE 216 UAE AUTOMOTIVE IN E-COMMERCE PACKAGING MARKET, BY PACKAGING, 2018-2033 (USD THOUSAND)
TABLE 217 UAE AUTOMOTIVE IN E-COMMERCE PACKAGING MARKET, BY COMMODITY TYPE, 2018-2033 (USD THOUSAND)
TABLE 218 UAE FABRICATED METAL PRODUCTS IN E-COMMERCE PACKAGING MARKET, BY CHANNEL TYPE, 2018-2033 (USD THOUSAND)
TABLE 219 UAE CHEMICAL PRODUCTS IN E-COMMERCE PACKAGING MARKET, BY CHANNEL TYPE, 2018-2033 (USD THOUSAND)
TABLE 220 UAE AGRICULTURE IN E-COMMERCE PACKAGING MARKET, BY CHANNEL TYPE, 2018-2033 (USD THOUSAND)
TABLE 221 UAE AGRICULTURE IN E-COMMERCE PACKAGING MARKET, BY TYPE, 2018-2033 (USD THOUSAND)
TABLE 222 UAE FURNITURE IN E-COMMERCE PACKAGING MARKET, BY CHANNEL TYPE, 2018-2033 (USD THOUSAND)
TABLE 223 UAE WOOD AND WOOD PRODUCTS (EX. FURNITURE) IN E-COMMERCE PACKAGING MARKET, BY CHANNEL TYPE, 2018-2033 (USD THOUSAND)
TABLE 224 UAE LEATHER AND LEATHER GOODS IN E-COMMERCE PACKAGING MARKET, BY CHANNEL TYPE, 2018-2033 (USD THOUSAND)
TABLE 225 UAE CONSTRUCTION MATERIALS IN E-COMMERCE PACKAGING MARKET, BY CHANNEL TYPE, 2018-2033 (USD THOUSAND)
TABLE 226 UAE TOBACCO PRODUCTS IN E-COMMERCE PACKAGING MARKET, BY CHANNEL TYPE, 2018-2033 (USD THOUSAND)
TABLE 227 UAE OTHERS IN E-COMMERCE PACKAGING MARKET, BY CHANNEL TYPE, 2018-2033 (USD THOUSAND)
TABLE 228 UAE OTHERS IN E-COMMERCE PACKAGING MARKET, BY PACKAGING, 2018-2033 (USD THOUSAND)
TABLE 229 UAE E-COMMERCE PACKAGING MARKET, BY DISTRIBUTION CHANNEL, 2018-2033 (USD THOUSAND)
TABLE 230 UAE DIRECT SALES IN E-COMMERCE PACKAGING MARKET, BY TYPE, 2018-2033 (USD THOUSAND)
TABLE 231 UAE INDIRECT SALES IN E-COMMERCE PACKAGING MARKET, BY TYPE, 2018-2033 (USD THOUSAND)
TABLE 232 EGYPT E-COMMERCE PACKAGING MARKET, BY PACKAGING, 2018-2033 (USD THOUSAND)
TABLE 233 EGYPT E-COMMERCE PACKAGING MARKET, BY PACKAGING, 2018-2033 (THOUSAND UNITS)
TABLE 234 EGYPT BAGS IN E-COMMERCE PACKAGING MARKET, BY TYPE, 2018-2033 (USD THOUSAND)
TABLE 235 EGYPT BAGS IN E-COMMERCE PACKAGING MARKET, BY TYPE, 2018-2033 (THOUSAND UNITS)
TABLE 236 EGYPT TAPES IN E-COMMERCE PACKAGING MARKET, BY TYPE, 2018-2033 (USD THOUSAND)
TABLE 237 EGYPT TAPES IN E-COMMERCE PACKAGING MARKET, BY TYPE, 2018-2033 (THOUSAND UNITS)
TABLE 238 EGYPT PROTECTIVE PACKAGING IN E-COMMERCE PACKAGING MARKET, BY TYPE, 2018-2033 (USD THOUSAND)
TABLE 239 EGYPT PROTECTIVE PACKAGING IN E-COMMERCE PACKAGING MARKET, BY TYPE, 2018-2033 (THOUSAND UNITS )
TABLE 240 EGYPT E-COMMERCE PACKAGING MARKET, BY MATERIAL, 2018-2033 (USD THOUSAND)
TABLE 241 EGYPT FIBER-BASED IN E-COMMERCE PACKAGING MARKET, BY TYPE, 2018-2033 (USD THOUSAND)
TABLE 242 EGYPT CORRUGATED BOARD IN E-COMMERCE PACKAGING MARKET, BY TYPE, 2018-2033 (USD THOUSAND)
TABLE 243 EGYPT E-COMMERCE PACKAGING MARKET, BY END-USER, 2018-2033 (USD THOUSAND)
TABLE 244 EGYPT APPAREL & ACCESSORIES IN E-COMMERCE PACKAGING MARKET, BY CHANNEL TYPE, 2018-2033 (USD THOUSAND)
TABLE 245 EGYPT APPAREL & ACCESSORIES IN E-COMMERCE PACKAGING MARKET, BY PACKAGING, 2018-2033 (USD THOUSAND)
TABLE 246 EGYPT ELECTRONICS & ELECTRICAL IN E-COMMERCE PACKAGING MARKET, BY CHANNEL TYPE, 2018-2033 (USD THOUSAND)
TABLE 247 EGYPT ELECTRONICS & ELECTRICAL IN E-COMMERCE PACKAGING MARKET, BY PACKAGING, 2018-2033 (USD THOUSAND)
TABLE 248 EGYPT ELECTRONICS & ELECTRICAL IN E-COMMERCE PACKAGING MARKET, BY TYPE, 2018-2033 (USD THOUSAND)
TABLE 249 EGYPT TEXTILE IN E-COMMERCE PACKAGING MARKET, BY CHANNEL TYPE, 2018-2033 (USD THOUSAND)
TABLE 250 EGYPT TEXTILE IN E-COMMERCE PACKAGING MARKET, BY PACKAGING, 2018-2033 (USD THOUSAND)
TABLE 251 EGYPT HOUSEHOLD IN E-COMMERCE PACKAGING MARKET, BY CHANNEL TYPE, 2018-2033 (USD THOUSAND)
TABLE 252 EGYPT HOUSEHOLD IN E-COMMERCE PACKAGING MARKET, BY PACKAGING, 2018-2033 (USD THOUSAND)
TABLE 253 EGYPT PERSONAL CARE IN E-COMMERCE PACKAGING MARKET, BY CHANNEL TYPE, 2018-2033 (USD THOUSAND)
TABLE 254 EGYPT PERSONAL CARE IN E-COMMERCE PACKAGING MARKET, BY PACKAGING, 2018-2033 (USD THOUSAND)
TABLE 255 EGYPT FOOD AND BEVERAGES IN E-COMMERCE PACKAGING MARKET, BY CHANNEL TYPE, 2018-2033 (USD THOUSAND)
TABLE 256 EGYPT FOOD AND BEVERAGES IN E-COMMERCE PACKAGING MARKET, BY PACKAGING, 2018-2033 (USD THOUSAND)
TABLE 257 EGYPT FOOD AND BEVERAGES IN E-COMMERCE PACKAGING MARKET, BY TYPE, 2018-2033 (USD THOUSAND)
TABLE 258 EGYPT PHARMACEUTICALS IN E-COMMERCE PACKAGING MARKET, BY CHANNEL TYPE, 2018-2033 (USD THOUSAND)
TABLE 259 EGYPT PHARMACEUTICALS IN E-COMMERCE PACKAGING MARKET, BY PACKAGING, 2018-2033 (USD THOUSAND)
TABLE 260 EGYPT AUTOMOTIVE IN E-COMMERCE PACKAGING MARKET, BY CHANNEL TYPE, 2018-2033 (USD THOUSAND)
TABLE 261 EGYPT AUTOMOTIVE IN E-COMMERCE PACKAGING MARKET, BY PACKAGING, 2018-2033 (USD THOUSAND)
TABLE 262 UAE AUTOMOTIVE IN E-COMMERCE PACKAGING MARKET, BY COMMODITY TYPE, 2018-2033 (USD THOUSAND)
TABLE 263 EGYPT FABRICATED METAL PRODUCTS IN E-COMMERCE PACKAGING MARKET, BY CHANNEL TYPE, 2018-2033 (USD THOUSAND)
TABLE 264 EGYPT CHEMICAL PRODUCTS IN E-COMMERCE PACKAGING MARKET, BY CHANNEL TYPE, 2018-2033 (USD THOUSAND)
TABLE 265 EGYPT AGRICULTURE IN E-COMMERCE PACKAGING MARKET, BY CHANNEL TYPE, 2018-2033 (USD THOUSAND)
TABLE 266 EGYPT AGRICULTURE IN E-COMMERCE PACKAGING MARKET, BY TYPE, 2018-2033 (USD THOUSAND)
TABLE 267 EGYPT FURNITURE IN E-COMMERCE PACKAGING MARKET, BY CHANNEL TYPE, 2018-2033 (USD THOUSAND)
TABLE 268 EGYPT WOOD AND WOOD PRODUCTS (EX. FURNITURE) IN E-COMMERCE PACKAGING MARKET, BY CHANNEL TYPE, 2018-2033 (USD THOUSAND)
TABLE 269 EGYPT LEATHER AND LEATHER GOODS IN E-COMMERCE PACKAGING MARKET, BY CHANNEL TYPE, 2018-2033 (USD THOUSAND)
TABLE 270 EGYPT CONSTRUCTION MATERIALS IN E-COMMERCE PACKAGING MARKET, BY CHANNEL TYPE, 2018-2033 (USD THOUSAND)
TABLE 271 EGYPT TOBACCO PRODUCTS IN E-COMMERCE PACKAGING MARKET, BY CHANNEL TYPE, 2018-2033 (USD THOUSAND)
TABLE 272 EGYPT OTHERS IN E-COMMERCE PACKAGING MARKET, BY CHANNEL TYPE, 2018-2033 (USD THOUSAND)
TABLE 273 EGYPT OTHERS IN E-COMMERCE PACKAGING MARKET, BY PACKAGING, 2018-2033 (USD THOUSAND)
TABLE 274 EGYPT E-COMMERCE PACKAGING MARKET, BY DISTRIBUTION CHANNEL, 2018-2033 (USD THOUSAND)
TABLE 275 EGYPT DIRECT SALES IN E-COMMERCE PACKAGING MARKET, BY TYPE, 2018-2033 (USD THOUSAND)
TABLE 276 EGYPT INDIRECT SALES IN E-COMMERCE PACKAGING MARKET, BY TYPE, 2018-2033 (USD THOUSAND)
TABLE 277 ISRAEL E-COMMERCE PACKAGING MARKET, BY PACKAGING, 2018-2033 (USD THOUSAND)
TABLE 278 ISRAEL E-COMMERCE PACKAGING MARKET, BY PACKAGING, 2018-2033 (THOUSAND UNITS)
TABLE 279 ISRAEL BAGS IN E-COMMERCE PACKAGING MARKET, BY TYPE, 2018-2033 (USD THOUSAND)
TABLE 280 ISRAEL BAGS IN E-COMMERCE PACKAGING MARKET, BY TYPE, 2018-2033 (THOUSAND UNITS)
TABLE 281 ISRAEL TAPES IN E-COMMERCE PACKAGING MARKET, BY TYPE, 2018-2033 (USD THOUSAND)
TABLE 282 ISRAEL TAPES IN E-COMMERCE PACKAGING MARKET, BY TYPE, 2018-2033 (THOUSAND UNITS)
TABLE 283 ISRAEL PROTECTIVE PACKAGING IN E-COMMERCE PACKAGING MARKET, BY TYPE, 2018-2033 (USD THOUSAND)
TABLE 284 ISRAEL PROTECTIVE PACKAGING IN E-COMMERCE PACKAGING MARKET, BY TYPE, 2018-2033 (THOUSAND UNITS )
TABLE 285 ISRAEL E-COMMERCE PACKAGING MARKET, BY MATERIAL, 2018-2033 (USD THOUSAND)
TABLE 286 ISRAEL FIBER-BASED IN E-COMMERCE PACKAGING MARKET, BY TYPE, 2018-2033 (USD THOUSAND)
TABLE 287 ISRAEL CORRUGATED BOARD IN E-COMMERCE PACKAGING MARKET, BY TYPE, 2018-2033 (USD THOUSAND)
TABLE 288 ISRAEL E-COMMERCE PACKAGING MARKET, BY END-USER, 2018-2033 (USD THOUSAND)
TABLE 289 ISRAEL APPAREL & ACCESSORIES IN E-COMMERCE PACKAGING MARKET, BY CHANNEL TYPE, 2018-2033 (USD THOUSAND)
TABLE 290 ISRAEL APPAREL & ACCESSORIES IN E-COMMERCE PACKAGING MARKET, BY PACKAGING, 2018-2033 (USD THOUSAND)
TABLE 291 ISRAEL ELECTRONICS & ELECTRICAL IN E-COMMERCE PACKAGING MARKET, BY CHANNEL TYPE, 2018-2033 (USD THOUSAND)
TABLE 292 ISRAEL ELECTRONICS & ELECTRICAL IN E-COMMERCE PACKAGING MARKET, BY PACKAGING, 2018-2033 (USD THOUSAND)
TABLE 293 ISRAEL ELECTRONICS & ELECTRICAL IN E-COMMERCE PACKAGING MARKET, BY TYPE, 2018-2033 (USD THOUSAND)
TABLE 294 ISRAEL TEXTILE IN E-COMMERCE PACKAGING MARKET, BY CHANNEL TYPE, 2018-2033 (USD THOUSAND)
TABLE 295 ISRAEL TEXTILE IN E-COMMERCE PACKAGING MARKET, BY PACKAGING, 2018-2033 (USD THOUSAND)
TABLE 296 ISRAEL HOUSEHOLD IN E-COMMERCE PACKAGING MARKET, BY CHANNEL TYPE, 2018-2033 (USD THOUSAND)
TABLE 297 ISRAEL HOUSEHOLD IN E-COMMERCE PACKAGING MARKET, BY PACKAGING, 2018-2033 (USD THOUSAND)
TABLE 298 ISRAEL PERSONAL CARE IN E-COMMERCE PACKAGING MARKET, BY CHANNEL TYPE, 2018-2033 (USD THOUSAND)
TABLE 299 ISRAEL PERSONAL CARE IN E-COMMERCE PACKAGING MARKET, BY PACKAGING, 2018-2033 (USD THOUSAND)
TABLE 300 ISRAEL FOOD AND BEVERAGES IN E-COMMERCE PACKAGING MARKET, BY CHANNEL TYPE, 2018-2033 (USD THOUSAND)
TABLE 301 ISRAEL FOOD AND BEVERAGES IN E-COMMERCE PACKAGING MARKET, BY PACKAGING, 2018-2033 (USD THOUSAND)
TABLE 302 ISRAEL FOOD AND BEVERAGES IN E-COMMERCE PACKAGING MARKET, BY TYPE, 2018-2033 (USD THOUSAND)
TABLE 303 ISRAEL PHARMACEUTICALS IN E-COMMERCE PACKAGING MARKET, BY CHANNEL TYPE, 2018-2033 (USD THOUSAND)
TABLE 304 ISRAEL PHARMACEUTICALS IN E-COMMERCE PACKAGING MARKET, BY PACKAGING, 2018-2033 (USD THOUSAND)
TABLE 305 ISRAEL AUTOMOTIVE IN E-COMMERCE PACKAGING MARKET, BY CHANNEL TYPE, 2018-2033 (USD THOUSAND)
TABLE 306 ISRAEL AUTOMOTIVE IN E-COMMERCE PACKAGING MARKET, BY PACKAGING, 2018-2033 (USD THOUSAND)
TABLE 307 ISRAEL AUTOMOTIVE IN E-COMMERCE PACKAGING MARKET, BY COMMODITY TYPE, 2018-2033 (USD THOUSAND)
TABLE 308 ISRAEL FABRICATED METAL PRODUCTS IN E-COMMERCE PACKAGING MARKET, BY CHANNEL TYPE, 2018-2033 (USD THOUSAND)
TABLE 309 ISRAEL CHEMICAL PRODUCTS IN E-COMMERCE PACKAGING MARKET, BY CHANNEL TYPE, 2018-2033 (USD THOUSAND)
TABLE 310 ISRAEL AGRICULTURE IN E-COMMERCE PACKAGING MARKET, BY CHANNEL TYPE, 2018-2033 (USD THOUSAND)
TABLE 311 ISRAEL AGRICULTURE IN E-COMMERCE PACKAGING MARKET, BY TYPE, 2018-2033 (USD THOUSAND)
TABLE 312 ISRAEL FURNITURE IN E-COMMERCE PACKAGING MARKET, BY CHANNEL TYPE, 2018-2033 (USD THOUSAND)
TABLE 313 ISRAEL WOOD AND WOOD PRODUCTS (EX. FURNITURE) IN E-COMMERCE PACKAGING MARKET, BY CHANNEL TYPE, 2018-2033 (USD THOUSAND)
TABLE 314 ISRAEL LEATHER AND LEATHER GOODS IN E-COMMERCE PACKAGING MARKET, BY CHANNEL TYPE, 2018-2033 (USD THOUSAND)
TABLE 315 ISRAEL CONSTRUCTION MATERIALS IN E-COMMERCE PACKAGING MARKET, BY CHANNEL TYPE, 2018-2033 (USD THOUSAND)
TABLE 316 ISRAEL TOBACCO PRODUCTS IN E-COMMERCE PACKAGING MARKET, BY CHANNEL TYPE, 2018-2033 (USD THOUSAND)
TABLE 317 ISRAEL OTHERS IN E-COMMERCE PACKAGING MARKET, BY CHANNEL TYPE, 2018-2033 (USD THOUSAND)
TABLE 318 ISRAEL OTHERS IN E-COMMERCE PACKAGING MARKET, BY PACKAGING, 2018-2033 (USD THOUSAND)
TABLE 319 ISRAEL E-COMMERCE PACKAGING MARKET, BY DISTRIBUTION CHANNEL, 2018-2033 (USD THOUSAND)
TABLE 320 ISRAEL DIRECT SALES IN E-COMMERCE PACKAGING MARKET, BY TYPE, 2018-2033 (USD THOUSAND)
TABLE 321 ISRAEL INDIRECT SALES IN E-COMMERCE PACKAGING MARKET, BY TYPE, 2018-2033 (USD THOUSAND)
TABLE 322 SOUTH AFRICA E-COMMERCE PACKAGING MARKET, BY PACKAGING, 2018-2033 (USD THOUSAND)
TABLE 323 SOUTH AFRICA E-COMMERCE PACKAGING MARKET, BY PACKAGING, 2018-2033 (THOUSAND UNITS)
TABLE 324 SOUTH AFRICA BAGS IN E-COMMERCE PACKAGING MARKET, BY TYPE, 2018-2033 (USD THOUSAND)
TABLE 325 SOUTH AFRICA BAGS IN E-COMMERCE PACKAGING MARKET, BY TYPE, 2018-2033 (THOUSAND UNITS)
TABLE 326 SOUTH AFRICA TAPES IN E-COMMERCE PACKAGING MARKET, BY TYPE, 2018-2033 (USD THOUSAND)
TABLE 327 SOUTH AFRICA TAPES IN E-COMMERCE PACKAGING MARKET, BY TYPE, 2018-2033 (THOUSAND UNITS)
TABLE 328 SOUTH AFRICA PROTECTIVE PACKAGING IN E-COMMERCE PACKAGING MARKET, BY TYPE, 2018-2033 (USD THOUSAND)
TABLE 329 SOUTH AFRICA PROTECTIVE PACKAGING IN E-COMMERCE PACKAGING MARKET, BY TYPE, 2018-2033 (THOUSAND UNITS )
TABLE 330 SOUTH AFRICA E-COMMERCE PACKAGING MARKET, BY MATERIAL, 2018-2033 (USD THOUSAND)
TABLE 331 SOUTH AFRICA FIBER-BASED IN E-COMMERCE PACKAGING MARKET, BY TYPE, 2018-2033 (USD THOUSAND)
TABLE 332 SOUTH AFRICA CORRUGATED BOARD IN E-COMMERCE PACKAGING MARKET, BY TYPE, 2018-2033 (USD THOUSAND)
TABLE 333 SOUTH AFRICA E-COMMERCE PACKAGING MARKET, BY END-USER, 2018-2033 (USD THOUSAND)
TABLE 334 SOUTH AFRICA APPAREL & ACCESSORIES IN E-COMMERCE PACKAGING MARKET, BY CHANNEL TYPE, 2018-2033 (USD THOUSAND)
TABLE 335 SOUTH AFRICA APPAREL & ACCESSORIES IN E-COMMERCE PACKAGING MARKET, BY PACKAGING, 2018-2033 (USD THOUSAND)
TABLE 336 SOUTH AFRICA ELECTRONICS & ELECTRICAL IN E-COMMERCE PACKAGING MARKET, BY CHANNEL TYPE, 2018-2033 (USD THOUSAND)
TABLE 337 SOUTH AFRICA ELECTRONICS & ELECTRICAL IN E-COMMERCE PACKAGING MARKET, BY PACKAGING, 2018-2033 (USD THOUSAND)
TABLE 338 SOUTH AFRICA ELECTRONICS & ELECTRICAL IN E-COMMERCE PACKAGING MARKET, BY TYPE, 2018-2033 (USD THOUSAND)
TABLE 339 SOUTH AFRICA TEXTILE IN E-COMMERCE PACKAGING MARKET, BY CHANNEL TYPE, 2018-2033 (USD THOUSAND)
TABLE 340 SOUTH AFRICA TEXTILE IN E-COMMERCE PACKAGING MARKET, BY PACKAGING, 2018-2033 (USD THOUSAND)
TABLE 341 SOUTH AFRICA HOUSEHOLD IN E-COMMERCE PACKAGING MARKET, BY CHANNEL TYPE, 2018-2033 (USD THOUSAND)
TABLE 342 SOUTH AFRICA HOUSEHOLD IN E-COMMERCE PACKAGING MARKET, BY PACKAGING, 2018-2033 (USD THOUSAND)
TABLE 343 SOUTH AFRICA PERSONAL CARE IN E-COMMERCE PACKAGING MARKET, BY CHANNEL TYPE, 2018-2033 (USD THOUSAND)
TABLE 344 SOUTH AFRICA PERSONAL CARE IN E-COMMERCE PACKAGING MARKET, BY PACKAGING, 2018-2033 (USD THOUSAND)
TABLE 345 SOUTH AFRICA FOOD AND BEVERAGES IN E-COMMERCE PACKAGING MARKET, BY CHANNEL TYPE, 2018-2033 (USD THOUSAND)
TABLE 346 SOUTH AFRICA FOOD AND BEVERAGES IN E-COMMERCE PACKAGING MARKET, BY PACKAGING, 2018-2033 (USD THOUSAND)
TABLE 347 SOUTH AFRICA FOOD AND BEVERAGES IN E-COMMERCE PACKAGING MARKET, BY TYPE, 2018-2033 (USD THOUSAND)
TABLE 348 SOUTH AFRICA PHARMACEUTICALS IN E-COMMERCE PACKAGING MARKET, BY CHANNEL TYPE, 2018-2033 (USD THOUSAND)
TABLE 349 SOUTH AFRICA PHARMACEUTICALS IN E-COMMERCE PACKAGING MARKET, BY PACKAGING, 2018-2033 (USD THOUSAND)
TABLE 350 SOUTH AFRICA AUTOMOTIVE IN E-COMMERCE PACKAGING MARKET, BY CHANNEL TYPE, 2018-2033 (USD THOUSAND)
TABLE 351 SOUTH AFRICA AUTOMOTIVE IN E-COMMERCE PACKAGING MARKET, BY PACKAGING, 2018-2033 (USD THOUSAND)
TABLE 352 SOUTH AFRICA AUTOMOTIVE IN E-COMMERCE PACKAGING MARKET, BY COMMODITY TYPE, 2018-2033 (USD THOUSAND)
TABLE 353 SOUTH AFRICA FABRICATED METAL PRODUCTS IN E-COMMERCE PACKAGING MARKET, BY CHANNEL TYPE, 2018-2033 (USD THOUSAND)
TABLE 354 SOUTH AFRICA CHEMICAL PRODUCTS IN E-COMMERCE PACKAGING MARKET, BY CHANNEL TYPE, 2018-2033 (USD THOUSAND)
TABLE 355 SOUTH AFRICA AGRICULTURE IN E-COMMERCE PACKAGING MARKET, BY CHANNEL TYPE, 2018-2033 (USD THOUSAND)
TABLE 356 SOUTH AFRICA AGRICULTURE IN E-COMMERCE PACKAGING MARKET, BY TYPE, 2018-2033 (USD THOUSAND)
TABLE 357 SOUTH AFRICA FURNITURE IN E-COMMERCE PACKAGING MARKET, BY CHANNEL TYPE, 2018-2033 (USD THOUSAND)
TABLE 358 SOUTH AFRICA WOOD AND WOOD PRODUCTS (EX. FURNITURE) IN E-COMMERCE PACKAGING MARKET, BY CHANNEL TYPE, 2018-2033 (USD THOUSAND)
TABLE 359 SOUTH AFRICA LEATHER AND LEATHER GOODS IN E-COMMERCE PACKAGING MARKET, BY CHANNEL TYPE, 2018-2033 (USD THOUSAND)
TABLE 360 SOUTH AFRICA CONSTRUCTION MATERIALS IN E-COMMERCE PACKAGING MARKET, BY CHANNEL TYPE, 2018-2033 (USD THOUSAND)
TABLE 361 SOUTH AFRICA TOBACCO PRODUCTS IN E-COMMERCE PACKAGING MARKET, BY CHANNEL TYPE, 2018-2033 (USD THOUSAND)
TABLE 362 SOUTH AFRICA OTHERS IN E-COMMERCE PACKAGING MARKET, BY CHANNEL TYPE, 2018-2033 (USD THOUSAND)
TABLE 363 SOUTH AFRICA OTHERS IN E-COMMERCE PACKAGING MARKET, BY PACKAGING, 2018-2033 (USD THOUSAND)
TABLE 364 SOUTH AFRICA E-COMMERCE PACKAGING MARKET, BY DISTRIBUTION CHANNEL, 2018-2033 (USD THOUSAND)
TABLE 365 SOUTH AFRICA DIRECT SALES IN E-COMMERCE PACKAGING MARKET, BY TYPE, 2018-2033 (USD THOUSAND)
TABLE 366 SOUTH AFRICA INDIRECT SALES IN E-COMMERCE PACKAGING MARKET, BY TYPE, 2018-2033 (USD THOUSAND)
TABLE 367 QATAR E-COMMERCE PACKAGING MARKET, BY PACKAGING, 2018-2033 (USD THOUSAND)
TABLE 368 QATAR E-COMMERCE PACKAGING MARKET, BY PACKAGING, 2018-2033 (THOUSAND UNITS)
TABLE 369 QATAR BAGS IN E-COMMERCE PACKAGING MARKET, BY TYPE, 2018-2033 (USD THOUSAND)
TABLE 370 QATAR BAGS IN E-COMMERCE PACKAGING MARKET, BY TYPE, 2018-2033 (THOUSAND UNITS)
TABLE 371 QATAR TAPES IN E-COMMERCE PACKAGING MARKET, BY TYPE, 2018-2033 (USD THOUSAND)
TABLE 372 QATAR TAPES IN E-COMMERCE PACKAGING MARKET, BY TYPE, 2018-2033 (THOUSAND UNITS)
TABLE 373 QATAR PROTECTIVE PACKAGING IN E-COMMERCE PACKAGING MARKET, BY TYPE, 2018-2033 (USD THOUSAND)
TABLE 374 QATAR PROTECTIVE PACKAGING IN E-COMMERCE PACKAGING MARKET, BY TYPE, 2018-2033 (THOUSAND UNITS )
TABLE 375 QATAR E-COMMERCE PACKAGING MARKET, BY MATERIAL, 2018-2033 (USD THOUSAND)
TABLE 376 QATAR FIBER-BASED IN E-COMMERCE PACKAGING MARKET, BY TYPE, 2018-2033 (USD THOUSAND)
TABLE 377 QATAR CORRUGATED BOARD IN E-COMMERCE PACKAGING MARKET, BY TYPE, 2018-2033 (USD THOUSAND)
TABLE 378 QATAR E-COMMERCE PACKAGING MARKET, BY END-USER, 2018-2033 (USD THOUSAND)
TABLE 379 QATAR APPAREL & ACCESSORIES IN E-COMMERCE PACKAGING MARKET, BY CHANNEL TYPE, 2018-2033 (USD THOUSAND)
TABLE 380 QATAR APPAREL & ACCESSORIES IN E-COMMERCE PACKAGING MARKET, BY PACKAGING, 2018-2033 (USD THOUSAND)
TABLE 381 QATAR ELECTRONICS & ELECTRICAL IN E-COMMERCE PACKAGING MARKET, BY CHANNEL TYPE, 2018-2033 (USD THOUSAND)
TABLE 382 QATAR ELECTRONICS & ELECTRICAL IN E-COMMERCE PACKAGING MARKET, BY PACKAGING, 2018-2033 (USD THOUSAND)
TABLE 383 QATAR ELECTRONICS & ELECTRICAL IN E-COMMERCE PACKAGING MARKET, BY TYPE, 2018-2033 (USD THOUSAND)
TABLE 384 QATAR TEXTILE IN E-COMMERCE PACKAGING MARKET, BY CHANNEL TYPE, 2018-2033 (USD THOUSAND)
TABLE 385 QATAR TEXTILE IN E-COMMERCE PACKAGING MARKET, BY PACKAGING, 2018-2033 (USD THOUSAND)
TABLE 386 QATAR HOUSEHOLD IN E-COMMERCE PACKAGING MARKET, BY CHANNEL TYPE, 2018-2033 (USD THOUSAND)
TABLE 387 QATAR HOUSEHOLD IN E-COMMERCE PACKAGING MARKET, BY PACKAGING, 2018-2033 (USD THOUSAND)
TABLE 388 QATAR PERSONAL CARE IN E-COMMERCE PACKAGING MARKET, BY CHANNEL TYPE, 2018-2033 (USD THOUSAND)
TABLE 389 QATAR PERSONAL CARE IN E-COMMERCE PACKAGING MARKET, BY PACKAGING, 2018-2033 (USD THOUSAND)
TABLE 390 QATAR FOOD AND BEVERAGES IN E-COMMERCE PACKAGING MARKET, BY CHANNEL TYPE, 2018-2033 (USD THOUSAND)
TABLE 391 QATAR FOOD AND BEVERAGES IN E-COMMERCE PACKAGING MARKET, BY PACKAGING, 2018-2033 (USD THOUSAND)
TABLE 392 QATAR FOOD AND BEVERAGES IN E-COMMERCE PACKAGING MARKET, BY TYPE, 2018-2033 (USD THOUSAND)
TABLE 393 QATAR PHARMACEUTICALS IN E-COMMERCE PACKAGING MARKET, BY CHANNEL TYPE, 2018-2033 (USD THOUSAND)
TABLE 394 QATAR PHARMACEUTICALS IN E-COMMERCE PACKAGING MARKET, BY PACKAGING, 2018-2033 (USD THOUSAND)
TABLE 395 QATAR AUTOMOTIVE IN E-COMMERCE PACKAGING MARKET, BY CHANNEL TYPE, 2018-2033 (USD THOUSAND)
TABLE 396 QATAR AUTOMOTIVE IN E-COMMERCE PACKAGING MARKET, BY PACKAGING, 2018-2033 (USD THOUSAND)
TABLE 397 QATAR AUTOMOTIVE IN E-COMMERCE PACKAGING MARKET, BY COMMODITY TYPE, 2018-2033 (USD THOUSAND)
TABLE 398 QATAR FABRICATED METAL PRODUCTS IN E-COMMERCE PACKAGING MARKET, BY CHANNEL TYPE, 2018-2033 (USD THOUSAND)
TABLE 399 QATAR CHEMICAL PRODUCTS IN E-COMMERCE PACKAGING MARKET, BY CHANNEL TYPE, 2018-2033 (USD THOUSAND)
TABLE 400 QATAR AGRICULTURE IN E-COMMERCE PACKAGING MARKET, BY CHANNEL TYPE, 2018-2033 (USD THOUSAND)
TABLE 401 QATAR AGRICULTURE IN E-COMMERCE PACKAGING MARKET, BY TYPE, 2018-2033 (USD THOUSAND)
TABLE 402 QATAR FURNITURE IN E-COMMERCE PACKAGING MARKET, BY CHANNEL TYPE, 2018-2033 (USD THOUSAND)
TABLE 403 QATAR WOOD AND WOOD PRODUCTS (EX. FURNITURE) IN E-COMMERCE PACKAGING MARKET, BY CHANNEL TYPE, 2018-2033 (USD THOUSAND)
TABLE 404 QATAR LEATHER AND LEATHER GOODS IN E-COMMERCE PACKAGING MARKET, BY CHANNEL TYPE, 2018-2033 (USD THOUSAND)
TABLE 405 QATAR CONSTRUCTION MATERIALS IN E-COMMERCE PACKAGING MARKET, BY CHANNEL TYPE, 2018-2033 (USD THOUSAND)
TABLE 406 QATAR TOBACCO PRODUCTS IN E-COMMERCE PACKAGING MARKET, BY CHANNEL TYPE, 2018-2033 (USD THOUSAND)
TABLE 407 QATAR OTHERS IN E-COMMERCE PACKAGING MARKET, BY CHANNEL TYPE, 2018-2033 (USD THOUSAND)
TABLE 408 QATAR OTHERS IN E-COMMERCE PACKAGING MARKET, BY PACKAGING, 2018-2033 (USD THOUSAND)
TABLE 409 QATAR E-COMMERCE PACKAGING MARKET, BY DISTRIBUTION CHANNEL, 2018-2033 (USD THOUSAND)
TABLE 410 QATAR DIRECT SALES IN E-COMMERCE PACKAGING MARKET, BY TYPE, 2018-2033 (USD THOUSAND)
TABLE 411 QATAR INDIRECT SALES IN E-COMMERCE PACKAGING MARKET, BY TYPE, 2018-2033 (USD THOUSAND)
TABLE 412 KUWAIT E-COMMERCE PACKAGING MARKET, BY PACKAGING, 2018-2033 (USD THOUSAND)
TABLE 413 KUWAIT E-COMMERCE PACKAGING MARKET, BY PACKAGING, 2018-2033 (THOUSAND UNITS)
TABLE 414 KUWAIT BAGS IN E-COMMERCE PACKAGING MARKET, BY TYPE, 2018-2033 (USD THOUSAND)
TABLE 415 KUWAIT BAGS IN E-COMMERCE PACKAGING MARKET, BY TYPE, 2018-2033 (THOUSAND UNITS)
TABLE 416 KUWAIT TAPES IN E-COMMERCE PACKAGING MARKET, BY TYPE, 2018-2033 (USD THOUSAND)
TABLE 417 KUWAIT TAPES IN E-COMMERCE PACKAGING MARKET, BY TYPE, 2018-2033 (THOUSAND UNITS)
TABLE 418 KUWAIT PROTECTIVE PACKAGING IN E-COMMERCE PACKAGING MARKET, BY TYPE, 2018-2033 (USD THOUSAND)
TABLE 419 KUWAIT PROTECTIVE PACKAGING IN E-COMMERCE PACKAGING MARKET, BY TYPE, 2018-2033 (THOUSAND UNITS )
TABLE 420 KUWAIT E-COMMERCE PACKAGING MARKET, BY MATERIAL, 2018-2033 (USD THOUSAND)
TABLE 421 KUWAIT FIBER-BASED IN E-COMMERCE PACKAGING MARKET, BY TYPE, 2018-2033 (USD THOUSAND)
TABLE 422 KUWAIT CORRUGATED BOARD IN E-COMMERCE PACKAGING MARKET, BY TYPE, 2018-2033 (USD THOUSAND)
TABLE 423 KUWAIT E-COMMERCE PACKAGING MARKET, BY END-USER, 2018-2033 (USD THOUSAND)
TABLE 424 KUWAIT APPAREL & ACCESSORIES IN E-COMMERCE PACKAGING MARKET, BY CHANNEL TYPE, 2018-2033 (USD THOUSAND)
TABLE 425 KUWAIT APPAREL & ACCESSORIES IN E-COMMERCE PACKAGING MARKET, BY PACKAGING, 2018-2033 (USD THOUSAND)
TABLE 426 KUWAIT ELECTRONICS & ELECTRICAL IN E-COMMERCE PACKAGING MARKET, BY CHANNEL TYPE, 2018-2033 (USD THOUSAND)
TABLE 427 KUWAIT ELECTRONICS & ELECTRICAL IN E-COMMERCE PACKAGING MARKET, BY PACKAGING, 2018-2033 (USD THOUSAND)
TABLE 428 KUWAIT ELECTRONICS & ELECTRICAL IN E-COMMERCE PACKAGING MARKET, BY TYPE, 2018-2033 (USD THOUSAND)
TABLE 429 KUWAIT TEXTILE IN E-COMMERCE PACKAGING MARKET, BY CHANNEL TYPE, 2018-2033 (USD THOUSAND)
TABLE 430 KUWAIT TEXTILE IN E-COMMERCE PACKAGING MARKET, BY PACKAGING, 2018-2033 (USD THOUSAND)
TABLE 431 KUWAIT HOUSEHOLD IN E-COMMERCE PACKAGING MARKET, BY CHANNEL TYPE, 2018-2033 (USD THOUSAND)
TABLE 432 KUWAIT HOUSEHOLD IN E-COMMERCE PACKAGING MARKET, BY PACKAGING, 2018-2033 (USD THOUSAND)
TABLE 433 KUWAIT PERSONAL CARE IN E-COMMERCE PACKAGING MARKET, BY CHANNEL TYPE, 2018-2033 (USD THOUSAND)
TABLE 434 KUWAIT PERSONAL CARE IN E-COMMERCE PACKAGING MARKET, BY PACKAGING, 2018-2033 (USD THOUSAND)
TABLE 435 KUWAIT FOOD AND BEVERAGES IN E-COMMERCE PACKAGING MARKET, BY CHANNEL TYPE, 2018-2033 (USD THOUSAND)
TABLE 436 KUWAIT FOOD AND BEVERAGES IN E-COMMERCE PACKAGING MARKET, BY PACKAGING, 2018-2033 (USD THOUSAND)
TABLE 437 KUWAIT FOOD AND BEVERAGES IN E-COMMERCE PACKAGING MARKET, BY TYPE, 2018-2033 (USD THOUSAND)
TABLE 438 KUWAIT PHARMACEUTICALS IN E-COMMERCE PACKAGING MARKET, BY CHANNEL TYPE, 2018-2033 (USD THOUSAND)
TABLE 439 KUWAIT PHARMACEUTICALS IN E-COMMERCE PACKAGING MARKET, BY PACKAGING, 2018-2033 (USD THOUSAND)
TABLE 440 KUWAIT AUTOMOTIVE IN E-COMMERCE PACKAGING MARKET, BY CHANNEL TYPE, 2018-2033 (USD THOUSAND)
TABLE 441 KUWAIT AUTOMOTIVE IN E-COMMERCE PACKAGING MARKET, BY PACKAGING, 2018-2033 (USD THOUSAND)
TABLE 442 KUWAIT AUTOMOTIVE IN E-COMMERCE PACKAGING MARKET, BY COMMODITY TYPE, 2018-2033 (USD THOUSAND)
TABLE 443 KUWAIT FABRICATED METAL PRODUCTS IN E-COMMERCE PACKAGING MARKET, BY CHANNEL TYPE, 2018-2033 (USD THOUSAND)
TABLE 444 KUWAIT CHEMICAL PRODUCTS IN E-COMMERCE PACKAGING MARKET, BY CHANNEL TYPE, 2018-2033 (USD THOUSAND)
TABLE 445 KUWAIT AGRICULTURE IN E-COMMERCE PACKAGING MARKET, BY CHANNEL TYPE, 2018-2033 (USD THOUSAND)
TABLE 446 KUWAIT AGRICULTURE IN E-COMMERCE PACKAGING MARKET, BY TYPE, 2018-2033 (USD THOUSAND)
TABLE 447 KUWAIT FURNITURE IN E-COMMERCE PACKAGING MARKET, BY CHANNEL TYPE, 2018-2033 (USD THOUSAND)
TABLE 448 KUWAIT WOOD AND WOOD PRODUCTS (EX. FURNITURE) IN E-COMMERCE PACKAGING MARKET, BY CHANNEL TYPE, 2018-2033 (USD THOUSAND)
TABLE 449 KUWAIT LEATHER AND LEATHER GOODS IN E-COMMERCE PACKAGING MARKET, BY CHANNEL TYPE, 2018-2033 (USD THOUSAND)
TABLE 450 KUWAIT CONSTRUCTION MATERIALS IN E-COMMERCE PACKAGING MARKET, BY CHANNEL TYPE, 2018-2033 (USD THOUSAND)
TABLE 451 KUWAIT TOBACCO PRODUCTS IN E-COMMERCE PACKAGING MARKET, BY CHANNEL TYPE, 2018-2033 (USD THOUSAND)
TABLE 452 KUWAIT OTHERS IN E-COMMERCE PACKAGING MARKET, BY CHANNEL TYPE, 2018-2033 (USD THOUSAND)
TABLE 453 KUWAIT OTHERS IN E-COMMERCE PACKAGING MARKET, BY PACKAGING, 2018-2033 (USD THOUSAND)
TABLE 454 KUWAIT E-COMMERCE PACKAGING MARKET, BY DISTRIBUTION CHANNEL, 2018-2033 (USD THOUSAND)
TABLE 455 KUWAIT DIRECT SALES IN E-COMMERCE PACKAGING MARKET, BY TYPE, 2018-2033 (USD THOUSAND)
TABLE 456 KUWAIT INDIRECT SALES IN E-COMMERCE PACKAGING MARKET, BY TYPE, 2018-2033 (USD THOUSAND)
TABLE 457 BAHRAIN E-COMMERCE PACKAGING MARKET, BY PACKAGING, 2018-2033 (USD THOUSAND)
TABLE 458 BAHRAIN E-COMMERCE PACKAGING MARKET, BY PACKAGING, 2018-2033 (THOUSAND UNITS)
TABLE 459 BAHRAIN BAGS IN E-COMMERCE PACKAGING MARKET, BY TYPE, 2018-2033 (USD THOUSAND)
TABLE 460 BAHRAIN BAGS IN E-COMMERCE PACKAGING MARKET, BY TYPE, 2018-2033 (THOUSAND UNITS)
TABLE 461 BAHRAIN TAPES IN E-COMMERCE PACKAGING MARKET, BY TYPE, 2018-2033 (USD THOUSAND)
TABLE 462 BAHRAIN TAPES IN E-COMMERCE PACKAGING MARKET, BY TYPE, 2018-2033 (THOUSAND UNITS)
TABLE 463 BAHRAIN PROTECTIVE PACKAGING IN E-COMMERCE PACKAGING MARKET, BY TYPE, 2018-2033 (USD THOUSAND)
TABLE 464 BAHRAIN PROTECTIVE PACKAGING IN E-COMMERCE PACKAGING MARKET, BY TYPE, 2018-2033 (THOUSAND UNITS )
TABLE 465 BAHRAIN E-COMMERCE PACKAGING MARKET, BY MATERIAL, 2018-2033 (USD THOUSAND)
TABLE 466 BAHRAIN FIBER-BASED IN E-COMMERCE PACKAGING MARKET, BY TYPE, 2018-2033 (USD THOUSAND)
TABLE 467 BAHRAIN CORRUGATED BOARD IN E-COMMERCE PACKAGING MARKET, BY TYPE, 2018-2033 (USD THOUSAND)
TABLE 468 BAHRAIN E-COMMERCE PACKAGING MARKET, BY END-USER, 2018-2033 (USD THOUSAND)
TABLE 469 BAHRAIN APPAREL & ACCESSORIES IN E-COMMERCE PACKAGING MARKET, BY CHANNEL TYPE, 2018-2033 (USD THOUSAND)
TABLE 470 BAHRAIN APPAREL & ACCESSORIES IN E-COMMERCE PACKAGING MARKET, BY PACKAGING, 2018-2033 (USD THOUSAND)
TABLE 471 BAHRAIN ELECTRONICS & ELECTRICAL IN E-COMMERCE PACKAGING MARKET, BY CHANNEL TYPE, 2018-2033 (USD THOUSAND)
TABLE 472 BAHRAIN ELECTRONICS & ELECTRICAL IN E-COMMERCE PACKAGING MARKET, BY PACKAGING, 2018-2033 (USD THOUSAND)
TABLE 473 BAHRAIN ELECTRONICS & ELECTRICAL IN E-COMMERCE PACKAGING MARKET, BY TYPE, 2018-2033 (USD THOUSAND)
TABLE 474 BAHRAIN TEXTILE IN E-COMMERCE PACKAGING MARKET, BY CHANNEL TYPE, 2018-2033 (USD THOUSAND)
TABLE 475 BAHRAIN TEXTILE IN E-COMMERCE PACKAGING MARKET, BY PACKAGING, 2018-2033 (USD THOUSAND)
TABLE 476 BAHRAIN HOUSEHOLD IN E-COMMERCE PACKAGING MARKET, BY CHANNEL TYPE, 2018-2033 (USD THOUSAND)
TABLE 477 BAHRAIN HOUSEHOLD IN E-COMMERCE PACKAGING MARKET, BY PACKAGING, 2018-2033 (USD THOUSAND)
TABLE 478 BAHRAIN PERSONAL CARE IN E-COMMERCE PACKAGING MARKET, BY CHANNEL TYPE, 2018-2033 (USD THOUSAND)
TABLE 479 BAHRAIN PERSONAL CARE IN E-COMMERCE PACKAGING MARKET, BY PACKAGING, 2018-2033 (USD THOUSAND)
TABLE 480 BAHRAIN FOOD AND BEVERAGES IN E-COMMERCE PACKAGING MARKET, BY CHANNEL TYPE, 2018-2033 (USD THOUSAND)
TABLE 481 BAHRAIN FOOD AND BEVERAGES IN E-COMMERCE PACKAGING MARKET, BY PACKAGING, 2018-2033 (USD THOUSAND)
TABLE 482 BAHRAIN FOOD AND BEVERAGES IN E-COMMERCE PACKAGING MARKET, BY TYPE, 2018-2033 (USD THOUSAND)
TABLE 483 BAHRAIN PHARMACEUTICALS IN E-COMMERCE PACKAGING MARKET, BY CHANNEL TYPE, 2018-2033 (USD THOUSAND)
TABLE 484 BAHRAIN PHARMACEUTICALS IN E-COMMERCE PACKAGING MARKET, BY PACKAGING, 2018-2033 (USD THOUSAND)
TABLE 485 BAHRAIN AUTOMOTIVE IN E-COMMERCE PACKAGING MARKET, BY CHANNEL TYPE, 2018-2033 (USD THOUSAND)
TABLE 486 BAHRAIN AUTOMOTIVE IN E-COMMERCE PACKAGING MARKET, BY PACKAGING, 2018-2033 (USD THOUSAND)
TABLE 487 BAHRAIN AUTOMOTIVE IN E-COMMERCE PACKAGING MARKET, BY COMMODITY TYPE, 2018-2033 (USD THOUSAND)
TABLE 488 BAHRAIN FABRICATED METAL PRODUCTS IN E-COMMERCE PACKAGING MARKET, BY CHANNEL TYPE, 2018-2033 (USD THOUSAND)
TABLE 489 BAHRAIN CHEMICAL PRODUCTS IN E-COMMERCE PACKAGING MARKET, BY CHANNEL TYPE, 2018-2033 (USD THOUSAND)
TABLE 490 BAHRAIN AGRICULTURE IN E-COMMERCE PACKAGING MARKET, BY CHANNEL TYPE, 2018-2033 (USD THOUSAND)
TABLE 491 BAHRAIN AGRICULTURE IN E-COMMERCE PACKAGING MARKET, BY TYPE, 2018-2033 (USD THOUSAND)
TABLE 492 BAHRAIN FURNITURE IN E-COMMERCE PACKAGING MARKET, BY CHANNEL TYPE, 2018-2033 (USD THOUSAND)
TABLE 493 BAHRAIN WOOD AND WOOD PRODUCTS (EX. FURNITURE) IN E-COMMERCE PACKAGING MARKET, BY CHANNEL TYPE, 2018-2033 (USD THOUSAND)
TABLE 494 BAHRAIN LEATHER AND LEATHER GOODS IN E-COMMERCE PACKAGING MARKET, BY CHANNEL TYPE, 2018-2033 (USD THOUSAND)
TABLE 495 BAHRAIN CONSTRUCTION MATERIALS IN E-COMMERCE PACKAGING MARKET, BY CHANNEL TYPE, 2018-2033 (USD THOUSAND)
TABLE 496 BAHRAIN TOBACCO PRODUCTS IN E-COMMERCE PACKAGING MARKET, BY CHANNEL TYPE, 2018-2033 (USD THOUSAND)
TABLE 497 BAHRAIN OTHERS IN E-COMMERCE PACKAGING MARKET, BY CHANNEL TYPE, 2018-2033 (USD THOUSAND)
TABLE 498 BAHRAIN OTHERS IN E-COMMERCE PACKAGING MARKET, BY PACKAGING, 2018-2033 (USD THOUSAND)
TABLE 499 BAHRAIN E-COMMERCE PACKAGING MARKET, BY DISTRIBUTION CHANNEL, 2018-2033 (USD THOUSAND)
TABLE 500 BAHRAIN DIRECT SALES IN E-COMMERCE PACKAGING MARKET, BY TYPE, 2018-2033 (USD THOUSAND)
TABLE 501 BAHRAIN INDIRECT SALES IN E-COMMERCE PACKAGING MARKET, BY TYPE, 2018-2033 (USD THOUSAND)
TABLE 502 OMAN E-COMMERCE PACKAGING MARKET, BY PACKAGING, 2018-2033 (USD THOUSAND)
TABLE 503 OMAN E-COMMERCE PACKAGING MARKET, BY PACKAGING, 2018-2033 (THOUSAND UNITS)
TABLE 504 OMAN BAGS IN E-COMMERCE PACKAGING MARKET, BY TYPE, 2018-2033 (USD THOUSAND)
TABLE 505 OMAN BAGS IN E-COMMERCE PACKAGING MARKET, BY TYPE, 2018-2033 (THOUSAND UNITS)
TABLE 506 OMAN TAPES IN E-COMMERCE PACKAGING MARKET, BY TYPE, 2018-2033 (USD THOUSAND)
TABLE 507 OMAN TAPES IN E-COMMERCE PACKAGING MARKET, BY TYPE, 2018-2033 (THOUSAND UNITS)
TABLE 508 OMAN PROTECTIVE PACKAGING IN E-COMMERCE PACKAGING MARKET, BY TYPE, 2018-2033 (USD THOUSAND)
TABLE 509 OMAN PROTECTIVE PACKAGING IN E-COMMERCE PACKAGING MARKET, BY TYPE, 2018-2033 (THOUSAND UNITS )
TABLE 510 OMAN E-COMMERCE PACKAGING MARKET, BY MATERIAL, 2018-2033 (USD THOUSAND)
TABLE 511 OMAN FIBER-BASED IN E-COMMERCE PACKAGING MARKET, BY TYPE, 2018-2033 (USD THOUSAND)
TABLE 512 OMAN CORRUGATED BOARD IN E-COMMERCE PACKAGING MARKET, BY TYPE, 2018-2033 (USD THOUSAND)
TABLE 513 OMAN E-COMMERCE PACKAGING MARKET, BY END-USER, 2018-2033 (USD THOUSAND)
TABLE 514 OMAN APPAREL & ACCESSORIES IN E-COMMERCE PACKAGING MARKET, BY CHANNEL TYPE, 2018-2033 (USD THOUSAND)
TABLE 515 OMAN APPAREL & ACCESSORIES IN E-COMMERCE PACKAGING MARKET, BY PACKAGING, 2018-2033 (USD THOUSAND)
TABLE 516 OMAN ELECTRONICS & ELECTRICAL IN E-COMMERCE PACKAGING MARKET, BY CHANNEL TYPE, 2018-2033 (USD THOUSAND)
TABLE 517 OMAN ELECTRONICS & ELECTRICAL IN E-COMMERCE PACKAGING MARKET, BY PACKAGING, 2018-2033 (USD THOUSAND)
TABLE 518 OMAN ELECTRONICS & ELECTRICAL IN E-COMMERCE PACKAGING MARKET, BY TYPE, 2018-2033 (USD THOUSAND)
TABLE 519 OMAN TEXTILE IN E-COMMERCE PACKAGING MARKET, BY CHANNEL TYPE, 2018-2033 (USD THOUSAND)
TABLE 520 OMAN TEXTILE IN E-COMMERCE PACKAGING MARKET, BY PACKAGING, 2018-2033 (USD THOUSAND)
TABLE 521 OMAN HOUSEHOLD IN E-COMMERCE PACKAGING MARKET, BY CHANNEL TYPE, 2018-2033 (USD THOUSAND)
TABLE 522 OMAN HOUSEHOLD IN E-COMMERCE PACKAGING MARKET, BY PACKAGING, 2018-2033 (USD THOUSAND)
TABLE 523 OMAN PERSONAL CARE IN E-COMMERCE PACKAGING MARKET, BY CHANNEL TYPE, 2018-2033 (USD THOUSAND)
TABLE 524 OMAN PERSONAL CARE IN E-COMMERCE PACKAGING MARKET, BY PACKAGING, 2018-2033 (USD THOUSAND)
TABLE 525 OMAN FOOD AND BEVERAGES IN E-COMMERCE PACKAGING MARKET, BY CHANNEL TYPE, 2018-2033 (USD THOUSAND)
TABLE 526 OMAN FOOD AND BEVERAGES IN E-COMMERCE PACKAGING MARKET, BY PACKAGING, 2018-2033 (USD THOUSAND)
TABLE 527 OMAN FOOD AND BEVERAGES IN E-COMMERCE PACKAGING MARKET, BY TYPE, 2018-2033 (USD THOUSAND)
TABLE 528 OMAN PHARMACEUTICALS IN E-COMMERCE PACKAGING MARKET, BY CHANNEL TYPE, 2018-2033 (USD THOUSAND)
TABLE 529 OMAN PHARMACEUTICALS IN E-COMMERCE PACKAGING MARKET, BY PACKAGING, 2018-2033 (USD THOUSAND)
TABLE 530 OMAN AUTOMOTIVE IN E-COMMERCE PACKAGING MARKET, BY CHANNEL TYPE, 2018-2033 (USD THOUSAND)
TABLE 531 OMAN AUTOMOTIVE IN E-COMMERCE PACKAGING MARKET, BY PACKAGING, 2018-2033 (USD THOUSAND)
TABLE 532 OMAN AUTOMOTIVE IN E-COMMERCE PACKAGING MARKET, BY COMMODITY TYPE, 2018-2033 (USD THOUSAND)
TABLE 533 OMAN FABRICATED METAL PRODUCTS IN E-COMMERCE PACKAGING MARKET, BY CHANNEL TYPE, 2018-2033 (USD THOUSAND)
TABLE 534 OMAN CHEMICAL PRODUCTS IN E-COMMERCE PACKAGING MARKET, BY CHANNEL TYPE, 2018-2033 (USD THOUSAND)
TABLE 535 OMAN AGRICULTURE IN E-COMMERCE PACKAGING MARKET, BY CHANNEL TYPE, 2018-2033 (USD THOUSAND)
TABLE 536 OMAN AGRICULTURE IN E-COMMERCE PACKAGING MARKET, BY TYPE, 2018-2033 (USD THOUSAND)
TABLE 537 OMAN FURNITURE IN E-COMMERCE PACKAGING MARKET, BY CHANNEL TYPE, 2018-2033 (USD THOUSAND)
TABLE 538 OMAN WOOD AND WOOD PRODUCTS (EX. FURNITURE) IN E-COMMERCE PACKAGING MARKET, BY CHANNEL TYPE, 2018-2033 (USD THOUSAND)
TABLE 539 OMAN LEATHER AND LEATHER GOODS IN E-COMMERCE PACKAGING MARKET, BY CHANNEL TYPE, 2018-2033 (USD THOUSAND)
TABLE 540 OMAN CONSTRUCTION MATERIALS IN E-COMMERCE PACKAGING MARKET, BY CHANNEL TYPE, 2018-2033 (USD THOUSAND)
TABLE 541 OMAN TOBACCO PRODUCTS IN E-COMMERCE PACKAGING MARKET, BY CHANNEL TYPE, 2018-2033 (USD THOUSAND)
TABLE 542 OMAN OTHERS IN E-COMMERCE PACKAGING MARKET, BY CHANNEL TYPE, 2018-2033 (USD THOUSAND)
TABLE 543 OMAN OTHERS IN E-COMMERCE PACKAGING MARKET, BY PACKAGING, 2018-2033 (USD THOUSAND)
TABLE 544 OMAN E-COMMERCE PACKAGING MARKET, BY DISTRIBUTION CHANNEL, 2018-2033 (USD THOUSAND)
TABLE 545 OMAN DIRECT SALES IN E-COMMERCE PACKAGING MARKET, BY TYPE, 2018-2033 (USD THOUSAND)
TABLE 546 OMAN INDIRECT SALES IN E-COMMERCE PACKAGING MARKET, BY TYPE, 2018-2033 (USD THOUSAND)
TABLE 547 REST OF MIDDLE EAST & AFRICA E-COMMERCE PACKAGING MARKET, BY PACKAGING, 2018-2033 (USD THOUSAND)
TABLE 548 REST OF MIDDLE EAST & AFRICA E-COMMERCE PACKAGING MARKET, BY PACKAGING, 2018-2033 (THOUSAND UNITS)
TABLE 549 REST OF MIDDLE EAST & AFRICA BAGS IN E-COMMERCE PACKAGING MARKET, BY TYPE, 2018-2033 (USD THOUSAND)
TABLE 550 REST OF MIDDLE EAST & AFRICA BAGS IN E-COMMERCE PACKAGING MARKET, BY TYPE, 2018-2033 (THOUSAND UNITS)
TABLE 551 REST OF MIDDLE EAST & AFRICA TAPES IN E-COMMERCE PACKAGING MARKET, BY TYPE, 2018-2033 (USD THOUSAND)
TABLE 552 REST OF MIDDLE EAST & AFRICA TAPES IN E-COMMERCE PACKAGING MARKET, BY TYPE, 2018-2033 (THOUSAND UNITS)
TABLE 553 REST OF MIDDLE EAST & AFRICA PROTECTIVE PACKAGING IN E-COMMERCE PACKAGING MARKET, BY TYPE, 2018-2033 (USD THOUSAND)
TABLE 554 REST OF MIDDLE EAST & AFRICA PROTECTIVE PACKAGING IN E-COMMERCE PACKAGING MARKET, BY TYPE, 2018-2033 (THOUSAND UNITS )
TABLE 555 REST OF MIDDLE EAST & AFRICA E-COMMERCE PACKAGING MARKET, BY MATERIAL, 2018-2033 (USD THOUSAND)
TABLE 556 REST OF MIDDLE EAST & AFRICA FIBER-BASED IN E-COMMERCE PACKAGING MARKET, BY TYPE, 2018-2033 (USD THOUSAND)
TABLE 557 REST OF MIDDLE EAST & AFRICA CORRUGATED BOARD IN E-COMMERCE PACKAGING MARKET, BY TYPE, 2018-2033 (USD THOUSAND)
TABLE 558 REST OF MIDDLE EAST & AFRICA E-COMMERCE PACKAGING MARKET, BY END-USER, 2018-2033 (USD THOUSAND)
TABLE 559 REST OF MIDDLE EAST & AFRICA APPAREL & ACCESSORIES IN E-COMMERCE PACKAGING MARKET, BY CHANNEL TYPE, 2018-2033 (USD THOUSAND)
TABLE 560 REST OF MIDDLE EAST & AFRICA APPAREL & ACCESSORIES IN E-COMMERCE PACKAGING MARKET, BY PACKAGING, 2018-2033 (USD THOUSAND)
TABLE 561 REST OF MIDDLE EAST & AFRICA ELECTRONICS & ELECTRICAL IN E-COMMERCE PACKAGING MARKET, BY CHANNEL TYPE, 2018-2033 (USD THOUSAND)
TABLE 562 REST OF MIDDLE EAST & AFRICA ELECTRONICS & ELECTRICAL IN E-COMMERCE PACKAGING MARKET, BY PACKAGING, 2018-2033 (USD THOUSAND)
TABLE 563 REST OF MIDDLE EAST & AFRICA ELECTRONICS & ELECTRICAL IN E-COMMERCE PACKAGING MARKET, BY TYPE, 2018-2033 (USD THOUSAND)
TABLE 564 REST OF MIDDLE EAST & AFRICA TEXTILE IN E-COMMERCE PACKAGING MARKET, BY CHANNEL TYPE, 2018-2033 (USD THOUSAND)
TABLE 565 REST OF MIDDLE EAST & AFRICA TEXTILE IN E-COMMERCE PACKAGING MARKET, BY PACKAGING, 2018-2033 (USD THOUSAND)
TABLE 566 REST OF MIDDLE EAST & AFRICA HOUSEHOLD IN E-COMMERCE PACKAGING MARKET, BY CHANNEL TYPE, 2018-2033 (USD THOUSAND)
TABLE 567 REST OF MIDDLE EAST & AFRICA HOUSEHOLD IN E-COMMERCE PACKAGING MARKET, BY PACKAGING, 2018-2033 (USD THOUSAND)
TABLE 568 REST OF MIDDLE EAST & AFRICA PERSONAL CARE IN E-COMMERCE PACKAGING MARKET, BY CHANNEL TYPE, 2018-2033 (USD THOUSAND)
TABLE 569 REST OF MIDDLE EAST & AFRICA PERSONAL CARE IN E-COMMERCE PACKAGING MARKET, BY PACKAGING, 2018-2033 (USD THOUSAND)
TABLE 570 REST OF MIDDLE EAST & AFRICA FOOD AND BEVERAGES IN E-COMMERCE PACKAGING MARKET, BY CHANNEL TYPE, 2018-2033 (USD THOUSAND)
TABLE 571 REST OF MIDDLE EAST & AFRICA FOOD AND BEVERAGES IN E-COMMERCE PACKAGING MARKET, BY PACKAGING, 2018-2033 (USD THOUSAND)
TABLE 572 REST OF MIDDLE EAST & AFRICA FOOD AND BEVERAGES IN E-COMMERCE PACKAGING MARKET, BY TYPE, 2018-2033 (USD THOUSAND)
TABLE 573 REST OF MIDDLE EAST & AFRICA PHARMACEUTICALS IN E-COMMERCE PACKAGING MARKET, BY CHANNEL TYPE, 2018-2033 (USD THOUSAND)
TABLE 574 REST OF MIDDLE EAST & AFRICA PHARMACEUTICALS IN E-COMMERCE PACKAGING MARKET, BY PACKAGING, 2018-2033 (USD THOUSAND)
TABLE 575 REST OF MIDDLE EAST & AFRICA AUTOMOTIVE IN E-COMMERCE PACKAGING MARKET, BY CHANNEL TYPE, 2018-2033 (USD THOUSAND)
TABLE 576 REST OF MIDDLE EAST & AFRICA AUTOMOTIVE IN E-COMMERCE PACKAGING MARKET, BY PACKAGING, 2018-2033 (USD THOUSAND)
TABLE 577 REST OF MIDDLE EAST & AFRICA AUTOMOTIVE IN E-COMMERCE PACKAGING MARKET, BY COMMODITY TYPE, 2018-2033 (USD THOUSAND)
TABLE 578 REST OF MIDDLE EAST & AFRICA FABRICATED METAL PRODUCTS IN E-COMMERCE PACKAGING MARKET, BY CHANNEL TYPE, 2018-2033 (USD THOUSAND)
TABLE 579 REST OF MIDDLE EAST & AFRICA CHEMICAL PRODUCTS IN E-COMMERCE PACKAGING MARKET, BY CHANNEL TYPE, 2018-2033 (USD THOUSAND)
TABLE 580 REST OF MIDDLE EAST & AFRICA AGRICULTURE IN E-COMMERCE PACKAGING MARKET, BY CHANNEL TYPE, 2018-2033 (USD THOUSAND)
TABLE 581 REST OF MIDDLE EAST & AFRICA AGRICULTURE IN E-COMMERCE PACKAGING MARKET, BY TYPE, 2018-2033 (USD THOUSAND)
TABLE 582 REST OF MIDDLE EAST & AFRICA FURNITURE IN E-COMMERCE PACKAGING MARKET, BY CHANNEL TYPE, 2018-2033 (USD THOUSAND)
TABLE 583 REST OF MIDDLE EAST & AFRICA WOOD AND WOOD PRODUCTS (EX. FURNITURE) IN E-COMMERCE PACKAGING MARKET, BY CHANNEL TYPE, 2018-2033 (USD THOUSAND)
TABLE 584 REST OF MIDDLE EAST & AFRICA LEATHER AND LEATHER GOODS IN E-COMMERCE PACKAGING MARKET, BY CHANNEL TYPE, 2018-2033 (USD THOUSAND)
TABLE 585 REST OF MIDDLE EAST & AFRICA CONSTRUCTION MATERIALS IN E-COMMERCE PACKAGING MARKET, BY CHANNEL TYPE, 2018-2033 (USD THOUSAND)
TABLE 586 REST OF MIDDLE EAST & AFRICA TOBACCO PRODUCTS IN E-COMMERCE PACKAGING MARKET, BY CHANNEL TYPE, 2018-2033 (USD THOUSAND)
TABLE 587 REST OF MIDDLE EAST & AFRICA OTHERS IN E-COMMERCE PACKAGING MARKET, BY CHANNEL TYPE, 2018-2033 (USD THOUSAND)
TABLE 588 REST OF MIDDLE EAST & AFRICA OTHERS IN E-COMMERCE PACKAGING MARKET, BY PACKAGING, 2018-2033 (USD THOUSAND)
TABLE 589 REST OF MIDDLE EAST & AFRICA E-COMMERCE PACKAGING MARKET, BY DISTRIBUTION CHANNEL, 2018-2033 (USD THOUSAND)
TABLE 590 REST OF MIDDLE EAST & AFRICA DIRECT SALES IN E-COMMERCE PACKAGING MARKET, BY TYPE, 2018-2033 (USD THOUSAND)
TABLE 591 REST OF MIDDLE EAST & AFRICA INDIRECT SALES IN E-COMMERCE PACKAGING MARKET, BY TYPE, 2018-2033 (USD THOUSAND)
List of Figure
FIGURE 1 MIDDLE EAST AND AFRICA E-COMMERCE PACKAGING MARKET
FIGURE 2 MIDDLE EAST AND AFRICA E-COMMERCE PACKAGING MARKET: DATA TRIANGULATION
FIGURE 3 MIDDLE EAST AND AFRICA E-COMMERCE PACKAGING MARKET: DROC ANALYSIS
FIGURE 4 MIDDLE EAST AND AFRICA E-COMMERCE PACKAGING MARKET: COUNTRYWISE MARKET ANALYSIS
FIGURE 5 MIDDLE EAST AND AFRICA E-COMMERCE PACKAGING MARKET: COMPANY RESEARCH ANALYSIS
FIGURE 6 MIDDLE EAST AND AFRICA E-COMMERCE PACKAGING MARKET: MULTIVARIATE MODELLING
FIGURE 7 MIDDLE EAST AND AFRICA E-COMMERCE PACKAGING MARKET: INTERVIEW DEMOGRAPHICS
FIGURE 8 MIDDLE EAST AND AFRICA E-COMMERCE PACKAGING MARKET: DBMR MARKET POSITION GRID
FIGURE 9 MIDDLE EAST AND AFRICA E-COMMERCE PACKAGING MARKET: VENDOR SHARE ANALYSIS
FIGURE 10 MARKET APPLICATION COVERAGE GRID
FIGURE 11 EXECUTIVE SUMMARY
FIGURE 12 NINE SEGMENTS COMPRISE THE MIDDLE EAST AND AFRICA E-COMMERCE PACKAGING MARKET, BY PACKAGING (2025)
FIGURE 13 STRATEGIC DECISIONS
FIGURE 14 MIDDLE EAST AND AFRICA E-COMMERCE PACKAGING MARKET: SEGMENTATION
FIGURE 15 REGIONAL INTERNET AND SMARTPHONE PENETRATION IN EMERGING MARKETS IS EXPECTED TO DRIVE THE MIDDLE EAST AND AFRICA E-COMMERCE PACKAGING MARKET IN THE FORECAST PERIOD OF 2026 TO 2033
FIGURE 16 THE CORRUGATED BOXES IS EXPECTED TO ACCOUNT FOR THE LARGEST MARKET SHARE OF THE MIDDLE EAST AND AFRICA E-COMMERCE PACKAGING MARKET IN 2026 AND 2033
FIGURE 17 PATENTS BY COUNTRY/ REGION
FIGURE 18 PATENTS BY APPLICANTS
FIGURE 19 PATENTS BY IPC CODE
FIGURE 20 PATENT BY PUBLICATION YEARS
FIGURE 21 MIDDLE EAST AND AFRICA E-COMMERCE PACKAGING MARKET, 2025-2033, AVERAGE SELLING PRICE (USD/KG)
FIGURE 22 COMPANY VS BRAND OVERVIEW
FIGURE 23 MARKET DYNAMICS
FIGURE 24 MIDDLE EAST AND AFRICA E-COMMERCE PACKAGING MARKET, BY PACKAGING, 2025
FIGURE 25 MIDDLE EAST AND AFRICA E-COMMERCE PACKAGING MARKET, BY MATERIAL, 2025
FIGURE 26 MIDDLE EAST AND AFRICA E-COMMERCE PACKAGING MARKET, BY END-USER, 2025
FIGURE 27 MIDDLE EAST AND AFRICA E-COMMERCE PACKAGING MARKET, BY DISTRIBUTION CHANNEL, 2025
FIGURE 28 MIDDLE EAST AND AFRICA E-COMMERCE PACKAGING MARKET: SNAPSHOT
FIGURE 29 MIDDLE EAST AND AFRICA E-COMMERCE PACKAGING MARKET: COMPANY SHARE 2025 (%)
Middle East And Africa E Commerce Packaging Market, Supply Chain Analysis and Ecosystem Framework
To support market growth and help clients navigate the impact of geopolitical shifts, DBMR has integrated in-depth supply chain analysis into its Middle East And Africa E Commerce Packaging Market research reports. This addition empowers clients to respond effectively to global changes affecting their industries. The supply chain analysis section includes detailed insights such as Middle East And Africa E Commerce Packaging Market consumption and production by country, price trend analysis, the impact of tariffs and geopolitical developments, and import and export trends by country and HSN code. It also highlights major suppliers with data on production capacity and company profiles, as well as key importers and exporters. In addition to research, DBMR offers specialized supply chain consulting services backed by over a decade of experience, providing solutions like supplier discovery, supplier risk assessment, price trend analysis, impact evaluation of inflation and trade route changes, and comprehensive market trend analysis.
Data collection and base year analysis are done using data collection modules with large sample sizes. The stage includes obtaining market information or related data through various sources and strategies. It includes examining and planning all the data acquired from the past in advance. It likewise envelops the examination of information inconsistencies seen across different information sources. The market data is analysed and estimated using market statistical and coherent models. Also, market share analysis and key trend analysis are the major success factors in the market report. To know more, please request an analyst call or drop down your inquiry.
The key research methodology used by DBMR research team is data triangulation which involves data mining, analysis of the impact of data variables on the market and primary (industry expert) validation. Data models include Vendor Positioning Grid, Market Time Line Analysis, Market Overview and Guide, Company Positioning Grid, Patent Analysis, Pricing Analysis, Company Market Share Analysis, Standards of Measurement, Global versus Regional and Vendor Share Analysis. To know more about the research methodology, drop in an inquiry to speak to our industry experts.
Data Bridge Market Research is a leader in advanced formative research. We take pride in servicing our existing and new customers with data and analysis that match and suits their goal. The report can be customized to include price trend analysis of target brands understanding the market for additional countries (ask for the list of countries), clinical trial results data, literature review, refurbished market and product base analysis. Market analysis of target competitors can be analyzed from technology-based analysis to market portfolio strategies. We can add as many competitors that you require data about in the format and data style you are looking for. Our team of analysts can also provide you data in crude raw excel files pivot tables (Fact book) or can assist you in creating presentations from the data sets available in the report.


