
Middle East And Africa Electronic Components Market
Market Size in USD Billion
 USD
9.21 Billion
USD
14.03 Billion
2025
2033
USD
9.21 Billion
USD
14.03 Billion
2025
2033
| 2026 - 2033 | |
| USD 9.21 Billion | |
| USD 14.03 Billion | |
| % | |
|
Middle East and Africa Electronic Components Market Size
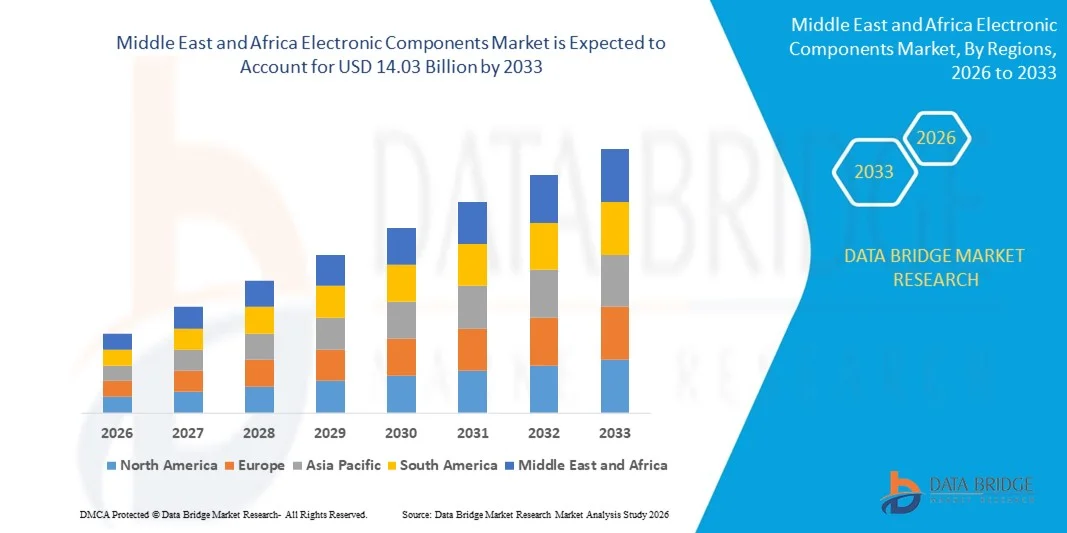
- The Middle East and Africa electronic components market size was valued at USD 9.21 billion in 2025 and is expected to reach USD 14.03 billion by 2033, at a CAGR of 5.40% during the forecast period
- The market growth is largely fuelled by the rapid expansion of consumer electronics manufacturing and increasing demand for components in smartphones, laptops, and wearable devices
- Rising adoption of advanced technologies such as 5G, IoT, and electric vehicles along with continuous investments in semiconductor and electronic manufacturing infrastructure is further supporting market expansion
Middle East and Africa Electronic Components Market Analysis
- The market is witnessing strong growth driven by increasing integration of electronic components in automotive, industrial automation, and communication equipment to enhance performance and functionality
- In addition, the presence of a robust electronics manufacturing ecosystem and growing demand for high-performance, compact, and energy-efficient components is accelerating market development across multiple industries
- Israel dominated the electronic components market in the Middle East and Africa with the largest revenue share in 2025, driven by its strong semiconductor design capabilities and advanced electronics manufacturing ecosystem
- Saudi Arabia is expected to witness the highest compound annual growth rate (CAGR) in the Middle East and Africa electronic components market due to increasing investments in industrial automation, smart infrastructure, and advanced electronic technologies
- The integrated circuits segment held the largest market revenue share in 2025 driven by their critical role in processing, control, and signal management across a wide range of electronic systems. These components are essential for enabling advanced features, compact design, and high operational efficiency in electronic devices. Their widespread adoption in communication equipment, computing systems, and embedded electronics is supporting consistent demand. In addition, continuous innovation in semiconductor technology is improving performance and supporting increased integration of multifunctional capabilities
Report Scope and Middle East and Africa Electronic Components Market Segmentation
|
Attributes |
Middle East and Africa Electronic Components Key Market Insights |
|
Segments Covered |
|
|
Countries Covered |
Middle East and Africa
|
|
Key Market Players |
|
|
Market Opportunities |
|
|
Value Added Data Infosets |
In addition to the insights on market scenarios such as market value, growth rate, segmentation, geographical coverage, and major players, the market reports curated by the Data Bridge Market Research also include in-depth expert analysis, geographically represented company-wise production and capacity, network layouts of distributors and partners, detailed and updated price trend analysis and deficit analysis of supply chain and demand. |
Middle East and Africa Electronic Components Market Trends
Increasing Integration Of Advanced Electronics Across Multiple Industries
- The growing integration of electronic components in modern devices is significantly shaping the electronic components market, as manufacturers increasingly focus on improving performance, efficiency, and functionality. Electronic components such as semiconductors, capacitors, and sensors are essential for enabling advanced features in consumer electronics, automotive systems, and industrial equipment. This trend is strengthening demand and encouraging continuous innovation to support evolving technology requirements
- Rising adoption of emerging technologies such as 5G, IoT, and artificial intelligence is accelerating the demand for high-performance electronic components. These technologies require reliable and compact components to ensure efficient data processing, connectivity, and power management. Manufacturers are actively developing advanced components that support faster communication, improved energy efficiency, and enhanced operational capabilities
- Increasing emphasis on miniaturization and energy efficiency is influencing product development and purchasing decisions. Manufacturers are focusing on producing smaller, lightweight, and energy-efficient components that meet the needs of compact electronic devices. These advancements help improve device portability, reduce power consumption, and enhance overall system performance, supporting widespread adoption across industries
- For instance, in 2024, Intel and Texas Instruments introduced advanced semiconductor components designed to improve processing efficiency and power management in electronic devices. These product developments supported enhanced device performance and enabled manufacturers to integrate more advanced features into electronic systems, strengthening competitive positioning
- While demand for electronic components continues to grow, sustained market expansion depends on continuous research and development, stable supply chains, and cost-effective manufacturing. Companies are focusing on improving production efficiency, ensuring component reliability, and developing innovative solutions to support long-term market growth
Middle East and Africa Electronic Components Market Dynamics
Driver
Growing Demand For Consumer Electronics And Connected Devices
- Increasing demand for consumer electronics such as smartphones, laptops, and wearable devices is a major driver for the electronic components market. Electronic components play a critical role in enabling device functionality, connectivity, and performance, encouraging manufacturers to increase production and introduce advanced component technologies
- Expanding adoption of connected devices and smart technologies is further supporting market growth. Electronic components are essential for enabling communication, automation, and data processing in connected systems. This trend is encouraging manufacturers to develop high-performance components that support reliable and efficient device operation
- Manufacturers are actively investing in innovation and product development to enhance component capabilities and meet evolving industry requirements. These efforts are supporting the introduction of advanced and efficient components, strengthening product competitiveness and expanding application scope
- For instance, in 2023, Samsung Electronics and NXP Semiconductors expanded their electronic component portfolios to support advanced electronic applications. These developments helped improve device functionality and supported increasing demand for high-performance electronic systems
- Although demand remains strong, continued growth depends on maintaining consistent supply, improving manufacturing efficiency, and supporting ongoing innovation. Investment in advanced production technologies will remain essential for sustaining market expansion
Restraint/Challenge
Supply Chain Disruptions And High Manufacturing Complexity
- Supply chain disruptions remain a significant challenge for the electronic components market, affecting the availability of raw materials and finished components. Manufacturing electronic components involves complex processes and precise material requirements, which can increase production risks and operational challenges
- High manufacturing complexity and production costs also limit market growth, as advanced electronic components require specialized equipment and technical expertise. These factors increase capital investment requirements and create barriers for new manufacturers entering the market
- Fluctuations in raw material availability and increasing demand can also impact production timelines and pricing stability. Manufacturers must ensure efficient supply chain management and production planning to maintain consistent market supply
- For instance, in 2024, Infineon Technologies and STMicroelectronics reported supply and production challenges while expanding their electronic component manufacturing capabilities. These challenges influenced delivery timelines and required strategic investments to stabilize production and supply
- Addressing these challenges will require investment in supply chain resilience, manufacturing efficiency, and advanced production technologies. Strengthening supplier networks and improving production capabilities will be essential for supporting long-term market growth
Middle East and Africa Electronic Components Market Scope
The market is segmented on the basis of components type, commodities type, product type, and end use type.
- By Components Type
On the basis of components type, the Middle East and Africa electronic components market is segmented into processors, motors, battery, microcontroller, integrated circuits, circuit breakers, transformer, capacitors, diodes, resistors, inductors, relays, switches, fuse and others. The integrated circuits segment held the largest market revenue share in 2025 driven by their critical role in processing, control, and signal management across a wide range of electronic systems. These components are essential for enabling advanced features, compact design, and high operational efficiency in electronic devices. Their widespread adoption in communication equipment, computing systems, and embedded electronics is supporting consistent demand. In addition, continuous innovation in semiconductor technology is improving performance and supporting increased integration of multifunctional capabilities.
The microcontroller segment is expected to witness the fastest growth rate from 2026 to 2033, driven by increasing adoption in smart electronics, automation systems, and intelligent control applications. Microcontrollers provide efficient processing and control functions within compact systems, making them suitable for modern electronic designs. They support real-time monitoring, automation, and improved device functionality. Growing demand for connected devices and intelligent electronic systems is accelerating their adoption. Furthermore, advancements in low-power microcontrollers are enhancing their use in energy-efficient applications.
- By Commodities Type
On the basis of commodities type, the Middle East and Africa electronic components market is segmented into brown goods, white goods and small white goods. The brown goods segment held the largest market revenue share in 2025 driven by strong consumer demand for televisions, audio systems, and home entertainment products. These devices require a variety of electronic components to enable processing, connectivity, and display functions. Increasing adoption of advanced entertainment technologies is further supporting segment growth. Manufacturers are focusing on improving product performance and adding advanced features, increasing the demand for high-quality components. In addition, rising consumer spending on entertainment devices is contributing to market expansion.
The small white goods segment is expected to witness the fastest growth rate from 2026 to 2033, driven by rising demand for compact and efficient household appliances. These products rely on electronic components for control, monitoring, and automation functions. Increasing consumer preference for convenience and smart features is supporting segment growth. Manufacturers are integrating advanced electronic systems to improve efficiency and functionality. Moreover, the trend toward energy-efficient appliances is increasing the need for advanced electronic components.
- By Product Type
On the basis of product type, the Middle East and Africa electronic components market is segmented into active, passive, electromechanical components and others. The active components segment held the largest market revenue share in 2025 driven by their essential role in controlling and amplifying electronic signals. These components are widely used in electronic devices to enable processing, switching, and signal transmission. Their importance in modern electronic systems is supporting strong demand across industries. Continuous technological advancements are improving their efficiency and performance. In addition, increasing production of advanced electronic devices is contributing to segment growth.
The electromechanical components segment is expected to witness the fastest growth rate from 2026 to 2033, driven by increasing use in automated equipment and advanced electronic systems. These components support switching, control, and mechanical movement functions in electronic devices. Growing adoption of automation and smart technologies is accelerating their demand. Manufacturers are developing advanced electromechanical components to improve reliability and operational performance. Furthermore, increasing integration in modern electronic systems is supporting segment expansion.
- By End Use Type
On the basis of end use type, the Middle East and Africa electronic components market is segmented into consumer electronics, networking and telecommunication, automotive, manufacturing, aerospace and defense, healthcare and others. The consumer electronics segment held the largest market revenue share in 2025 driven by increasing production and adoption of smartphones, laptops, and wearable devices. Electronic components are essential for enabling device functionality, connectivity, and performance. Rising demand for advanced and feature-rich devices is supporting segment growth. Manufacturers are continuously introducing new products with improved performance, increasing the need for advanced components. In addition, increasing consumer dependence on electronic devices is strengthening demand.
The automotive segment is expected to witness the fastest growth rate from 2026 to 2033, driven by increasing integration of electronic systems in vehicles. Electronic components are widely used to support vehicle control, monitoring, and safety functions. Growing adoption of electric vehicles and advanced vehicle technologies is supporting segment growth. Manufacturers are focusing on improving vehicle performance and efficiency through electronic integration. Furthermore, increasing demand for connected and intelligent vehicle systems is accelerating the adoption of electronic components.
Middle East and Africa Electronic Components Market Regional Analysis
- Israel dominated the electronic components market in the Middle East and Africa with the largest revenue share in 2025, driven by its strong semiconductor design capabilities and advanced electronics manufacturing ecosystem
- The country benefits from a well-established technology sector, supported by continuous innovation in microelectronics, integrated circuits, and advanced component development
- This leadership is further reinforced by significant investments in research and development, a highly skilled workforce, and strong collaboration between technology firms and component manufacturers, supporting widespread adoption across multiple electronic applications
Saudi Arabia Electronic Components Market Insight
The Saudi Arabia electronic components market is expected to witness the fastest growth rate from 2026 to 2033, driven by increasing investments in industrial automation, smart infrastructure, and advanced technologies. The country is actively expanding its electronics and manufacturing sectors to support economic diversification initiatives. Rising adoption of connected devices and advanced electronic systems is accelerating component demand. Moreover, government initiatives supporting local manufacturing and technology development are further contributing to market expansion and strengthening long-term growth potential.
Middle East and Africa Electronic Components Market Share
The Middle East and Africa electronic components industry is primarily led by well-established companies, including:
- STMicroelectronics (U.A.E.)
- Hikma Pharmaceuticals (Jordan)
- SABIC (Saudi Arabia)
- Orascom Construction (Egypt)
- Al-Futtaim Group (U.A.E.)
- Ezz Steel (Egypt)
- Saudi Arabian Airlines (Saudi Arabia)
- Arabian Cement Company (Egypt)
- Advanced Electronics Company (Saudi Arabia)
- Middle East Paper Company (U.A.E.)
- Dubai Investments (U.A.E.)
- Arabian Shield Insurance (Saudi Arabia)
- Jordan Phosphate Mines Company (Jordan)
- Egyptian Electric Utility & Consumer Protection Company (Egypt)
- Emirates Global Aluminium (U.A.E.)
SKU-

- Interactive Data Analysis Dashboard
- Company Analysis Dashboard for high growth potential opportunities
- Research Analyst Access for customization & queries
- Competitor Analysis with Interactive dashboard
- Latest News, Updates & Trend analysis
- Harness the Power of Benchmark Analysis for Comprehensive Competitor Tracking
Middle East And Africa Electronic Components Market, Supply Chain Analysis and Ecosystem Framework
To support market growth and help clients navigate the impact of geopolitical shifts, DBMR has integrated in-depth supply chain analysis into its Middle East And Africa Electronic Components Market research reports. This addition empowers clients to respond effectively to global changes affecting their industries. The supply chain analysis section includes detailed insights such as Middle East And Africa Electronic Components Market consumption and production by country, price trend analysis, the impact of tariffs and geopolitical developments, and import and export trends by country and HSN code. It also highlights major suppliers with data on production capacity and company profiles, as well as key importers and exporters. In addition to research, DBMR offers specialized supply chain consulting services backed by over a decade of experience, providing solutions like supplier discovery, supplier risk assessment, price trend analysis, impact evaluation of inflation and trade route changes, and comprehensive market trend analysis.
Data collection and base year analysis are done using data collection modules with large sample sizes. The stage includes obtaining market information or related data through various sources and strategies. It includes examining and planning all the data acquired from the past in advance. It likewise envelops the examination of information inconsistencies seen across different information sources. The market data is analysed and estimated using market statistical and coherent models. Also, market share analysis and key trend analysis are the major success factors in the market report. To know more, please request an analyst call or drop down your inquiry.
The key research methodology used by DBMR research team is data triangulation which involves data mining, analysis of the impact of data variables on the market and primary (industry expert) validation. Data models include Vendor Positioning Grid, Market Time Line Analysis, Market Overview and Guide, Company Positioning Grid, Patent Analysis, Pricing Analysis, Company Market Share Analysis, Standards of Measurement, Global versus Regional and Vendor Share Analysis. To know more about the research methodology, drop in an inquiry to speak to our industry experts.
Data Bridge Market Research is a leader in advanced formative research. We take pride in servicing our existing and new customers with data and analysis that match and suits their goal. The report can be customized to include price trend analysis of target brands understanding the market for additional countries (ask for the list of countries), clinical trial results data, literature review, refurbished market and product base analysis. Market analysis of target competitors can be analyzed from technology-based analysis to market portfolio strategies. We can add as many competitors that you require data about in the format and data style you are looking for. Our team of analysts can also provide you data in crude raw excel files pivot tables (Fact book) or can assist you in creating presentations from the data sets available in the report.


