
Middle East And Africa Emollient Esters Market
Market Size in USD Million
 USD
41.12 Million
USD
54.19 Million
2024
2032
USD
41.12 Million
USD
54.19 Million
2024
2032
| 2025 - 2032 | |
| USD 41.12 Million | |
| USD 54.19 Million | |
| % | |
|
Middle East and Africa Emollient Esters Market Analysis
Middle East and Africa emollient esters market includes the production and use of esters derived from fatty acids and alcohols that are primarily used in personal care and cosmetic products to improve skin feel, texture, and moisture retention. These emollient esters are also utilized in hair care products, sunscreens, and makeup for their ability to soften and condition the skin and hair. The demand for emollient esters is rising due to the growing consumer preference for natural and sustainable beauty products. The market is primarily driven by the increasing demand for high-quality, multifunctional, and eco-friendly formulations. Key trends include the shift towards bio-based emollient esters, and the growing adoption of these ingredients in premium and organic cosmetic products, as well as the development of multi-functional esters that offer both emollient and skin-conditioning properties.
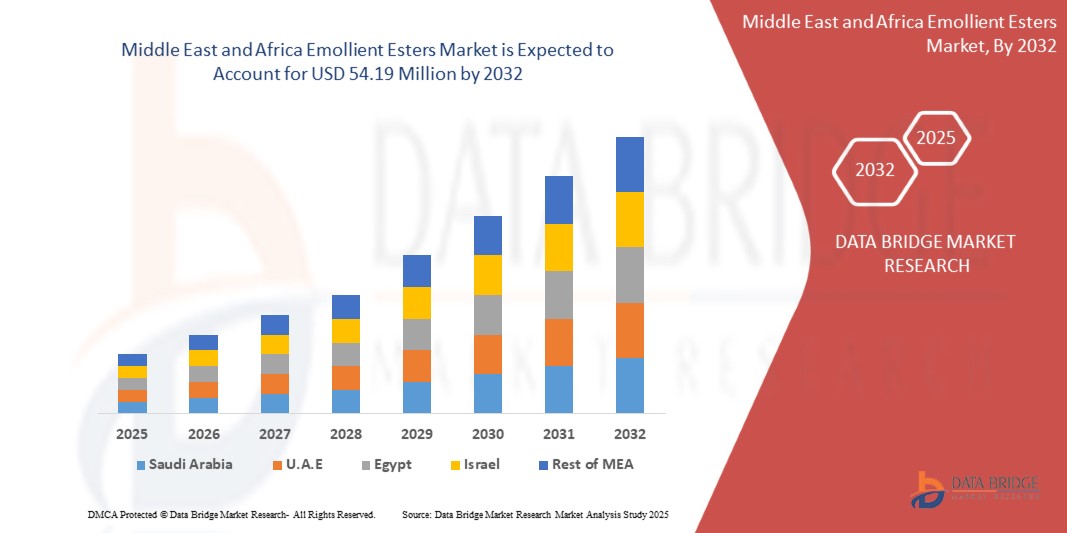
Middle East and Africa Emollient Esters Market Size
The Middle East and Africa emollient esters market is expected to reach USD 54.19 million by 2032 from USD 41.12 million in 2024, growing with a substantial CAGR of 5.02% in the forecast period of 2025 to 2032. In addition to the insights on market scenarios such as market value, growth rate, segmentation, geographical coverage, and major players, the market reports curated by the Data Bridge Market Research also include in-depth expert analysis, pricing analysis, brand share analysis, consumer survey, demography analysis, supply chain analysis, value chain analysis, raw material/consumables overview, vendor selection criteria, PESTLE Analysis, Porter Analysis, and regulatory framework.
Middle East and Africa Emollient Esters Market Trends
“Expanding Pharmaceutical and Dermatology Applications”
Pharmaceutical companies are using emollient esters in topical medications, wound care products, and transdermal drug delivery systems. They enhance the spreadability and penetration of active ingredients, making treatments more effective. In dermatology, these esters are found in creams, lotions, and serums, offering benefits such as long-lasting moisturization and skin barrier protection. These ingredients help improve the texture and absorption of skincare and medical formulations. Their ability to provide hydration and a smooth feel makes them valuable in products for dry skin, eczema, and other skin conditions.
The demand for natural and sustainable ingredients is also driving the use of bio-based emollient esters. These eco-friendly options appeal to consumers looking for safer and greener skincare solutions. As a result, manufacturers are focusing on plant-derived esters that provide the same benefits as synthetic alternatives.
For instance,
- Hydrofil Emollient, available on 1mg, is a paraben-free moisturizer designed to provide deep hydration and improve skin barrier function. Its emollient ester-based formulation enhances spreadability and absorption, making it effective for dry skin conditions
Overall, the growing demand for polyester in the American apparel and textile industries is driven by its versatility, affordability, and ability to adapt to changing consumer preferences. This trend positions polyester as a critical material in supporting innovation and growth within the Middle East and Africa emollient esters market.
Report Scope and Market Segmentation
|
Attributes |
Emollient Esters Market Key Market Insights |
|
Segments Covered |
|
|
Countries Covered |
China, Japan, India, South Korea, Indonesia, Malaysia, Thailand, Australia, Singapore, New Zealand, Philippines, Taiwan, Hong Kong, and Rest of Asia-Pacific, Germany, Russia, Italy, France, U.K., Spain, Netherlands, Turkey, Denmark, Belgium, Switzerland, Sweden, Norway, Finland, and Rest of Europe, U.S., Canada, and Mexico, Brazil, Argentina, Rest of South America, South Africa, Saudi Arabia, U.A.E., Qatar, Egypt, Israel, Kuwait, Oman, Bahrain, and Rest of Middle East And Africa |
|
Key Market Players |
Kao Corporation (Japan), Hefei TNJ Chemical Industry Co., Ltd. (China), PHOENIX CHEMICAL, INC (U.S.), ZhiShang Chemical (China), Rxchemicals.com (U.S.), Suriachem Sdn. Bhd. (Malaysia), Haihang Industry (China), ATAMAN KIMYA (Turkey), Matangi Industries (India), EMCO DYESTUFF (India), SIHAULI CHEMICALS PRIVATE LIMITED (India), Baoran (China), Mohini Organics Pvt. Ltd. (India), and Gravity Chemicals (India) |
|
Market Opportunities |
|
|
Value Added Data Infosets |
In addition to the insights on market scenarios such as market value, growth rate, segmentation, geographical coverage, and major players, the market reports curated by the Data Bridge Market Research also include in-depth expert analysis, pricing analysis, brand share analysis, consumer survey, demography analysis, supply chain analysis, value chain analysis, raw material/consumables overview, vendor selection criteria, PESTLE Analysis, Porter Analysis, and regulatory framework. |
Middle East and Africa Emollient Esters Market Definition
The Middle East and Africa emollient esters market includes the production and use of esters derived from fatty acids and alcohols that are primarily used in personal care and cosmetic products to improve skin feel, texture, and moisture retention. These emollient esters are also utilized in hair care products, sunscreens, and makeup for their ability to soften and condition the skin and hair.
Middle East and Africa Emollient Esters Market Dynamics
Drivers
- Expanding Pharmaceutical and Dermatology Applications
Pharmaceutical companies are using emollient esters in topical medications, wound care products, and transdermal drug delivery systems. They enhance the spreadability and penetration of active ingredients, making treatments more effective. In dermatology, these esters are found in creams, lotions, and serums, offering benefits such as long-lasting moisturization and skin barrier protection. These ingredients help improve the texture and absorption of skincare and medical formulations. Their ability to provide hydration and a smooth feel makes them valuable in products for dry skin, eczema, and other skin conditions.
The demand for natural and sustainable ingredients is also driving the use of bio-based emollient esters. These eco-friendly options appeal to consumers looking for safer and greener skincare solutions. As a result, manufacturers are focusing on plant-derived esters that provide the same benefits as synthetic alternatives.
With ongoing research and innovation, emollient esters are being developed for new applications, including anti-aging treatments and advanced drug formulations. Their role in improving product performance and consumer experience ensures continued growth in the pharmaceutical and dermatology sectors.
India's pharmaceutical industry, the world's largest generic drug provider, is projected to reach US$ 130 billion by 2030. It supplies over 50% of Middle East and Africa vaccine demand and 40% of generic demand in the US. The sector has grown at a 9.43% CAGR over nine years.
For instance,
Hydrofil Emollient, available on 1mg, is a paraben-free moisturizer designed to provide deep hydration and improve skin barrier function. Its emollient ester-based formulation enhances spreadability and absorption, making it effective for dry skin conditions
Esteem Industries highlights the role of emollients and conditioners in personal care formulations. Their emollient esters enhance moisturization, texture, and spreadability in skincare and haircare products. These ingredients improve absorption and provide a smooth, non-greasy feel, showcasing their importance in dermatological and cosmetic applications for enhanced consumer experience
Emollient esters enhance skincare and pharmaceutical formulations by improving hydration, absorption, and texture. They are widely used in topical medications, wound care, and dermatology products. Growing demand for natural, sustainable ingredients is driving innovation in bio-based esters. Their expanding applications ensure continued growth in pharmaceutical and dermatology industries.
- Growing Demand for Personal Care and Cosmetics
One major driver is the increasing preference for natural and sustainable ingredients. Many brands are switching to bio-based emollient esters to meet eco-conscious consumer expectations. In addition, the rise of skincare trends such as "skinimalism" (minimalist skincare) and clean beauty has fueled demand for lightweight and multifunctional ingredients, making emollient esters essential in product formulations. These key ingredients help make skincare and beauty products smoother, softer, and more luxurious. As consumers seek high-performance, non-greasy, and long-lasting formulations, the demand for emollient esters is rising.
The booming e-commerce sector is also playing a role in expanding access to personal care products worldwide. With influencers and beauty bloggers driving consumer choices, products with superior texture and skin feel—achieved using emollient esters—are gaining popularity. Moreover, as awareness of skin health increases, consumers are looking for products with moisturizing and barrier-enhancing properties, which emollient esters provide.
In regions such as Asia-Pacific, where beauty and skincare routines are deeply ingrained in culture, demand for innovative, fast-absorbing, and high-performance formulations continues to grow. In addition, the male grooming sector is expanding, further driving demand for lightweight, non-greasy products, where emollient esters excel.
With rising disposable incomes, evolving beauty trends, and a shift toward sustainable formulations, the demand for emollient esters in personal care and cosmetics will continue its upward trajectory.
India's cosmetics industry is projected to reach US$ 20 billion by 2025, growing at a 25% CAGR. This surge is driven by rising disposable incomes, urbanization, and a shift towards specialized products such as organic and herbal cosmetics. International brands are expanding their presence, intensifying market competition.
For instance,
In February 2025 an article published by NYP Holdings, Inc. highlighted the growing demand for emollient esters in luxury skincare, as seen in Guerlain Abeille Royale Youth Watery Oil Serum. This product reflects consumer preference for lightweight, nourishing formulations with superior absorption, reinforcing the market shift toward high-performance, sustainable, and non-greasy ingredients
In February 2025 an article published by NYP Holdings, Inc. highlighted the rising demand for emollient esters in premium skincare, as seen in Medik8 products, which are known for their lightweight, hydrating formulas. Consumers increasingly seek high-performance, non-greasy ingredients for superior skin nourishment, driving market growth
The growing personal care and cosmetics industry is driving demand for emollient esters, valued for their smooth, non-greasy feel. trends such as clean beauty, skinimalism, and e-commerce growth fuel this rise. increasing sustainability focus, expanding male grooming, and Asia-Pacific's beauty culture further boost market growth, ensuring continued demand.
Opportunities
- Rising Demand for Biodegradable and Sustainable Cosmetic Ingredients
The emollient esters market is experiencing strong growth due to the rising demand for biodegradable and sustainable cosmetic ingredients such as LexFeel N5 INOLEX, Sensolene Hallstar and Lipex SheaLight AAK. Consumers are increasingly looking for eco-friendly skincare and personal care products as awareness of environmental issues grows. This shift is driving cosmetic manufacturers to replace synthetic ingredients with natural, plant-based alternatives that are biodegradable and sustainable.
Emollient esters, known for their moisturizing and skin-softening properties, are widely used in lotions, creams, serums, and sunscreens. With stricter regulatory guidelines and bans on certain synthetic compounds, companies are innovating bio-based emollients that offer the same performance while being environmentally friendly. Ingredients derived from coconut oil, jojoba oil, and shea butter are gaining popularity.
In addition to environmental concerns, clean beauty trends are also influencing market growth. Consumers prefer paraben-free, sulfate-free, and silicone-free formulations, further boosting demand for plant-derived emollients. Brands that emphasize transparency, sustainability, and ethical sourcing are gaining a competitive edge.
Moreover, major cosmetic companies such as L’Oréal, Unilever, Estée Lauder and Procter & Gamble are investing in green chemistry to develop high-performance, biodegradable esters that ensure product stability and luxurious skin feel without harming the ecosystem. This trend is expanding the market scope, encouraging collaborations between cosmetic brands and raw material suppliers.
As sustainability remains a key priority, the emollient esters market is set for continuous growth, driven by evolving consumer preferences, regulatory pressures, and technological innovations in natural ingredient formulation.
For instance,
- According to C and A Healthcare Pvt Ltd, Possum's Body Lotion - Coconut & Vanilla contains shea butter, coconut oil, and vitamin E, highlighting the growing trend of bio-based emollients in skincare. This product exemplifies the shift towards natural, eco-friendly formulations, aligning with the increasing consumer demand for sustainable and moisturizing ingredients in lotions, creams, and personal care products
- According to Vanalaya, its Cocoa Butter & Shea Butter Moisturizing Lotion contains shea butter, coconut oil, and vitamin E, reflecting the growing demand for bio-based emollients in skincare. This product showcases the shift toward natural, eco-friendly formulations, catering to consumers seeking sustainable, deeply moisturizing ingredients in personal care products
In September 2024, a story published by Condé Nast highlighted the rise of upcycled beauty products, which use ingredients such as apple peels and coffee grounds, reflecting the growing demand for biodegradable and sustainable cosmetics. This trend is driving brands to adopt eco-friendly formulations, aligning with consumer preferences for natural, plant-based alternatives in skincare and personal care products
The emollient esters market is growing due to rising demand for biodegradable, plant-based cosmetic ingredients. Consumers prefer eco-friendly, clean beauty products, driving innovation in bio-based emollients from sources such as coconut and jojoba oil. Regulatory pressures and green chemistry advancements further boost market expansion and industry collaborations.
- Innovation in Multifunctional Esters
As consumers demand high-performance skincare products moisturizer, sunscreen and cleanser others, cosmetic brands such as L’Oréal, Unilever, Estée Lauder and Procter & Gamble are incorporating versatile emollient esters that provide moisturization, texture enhancement, and sensory appeal in a single ingredient.
Multifunctional esters improve skin hydration, spreadability, and product stability, making them essential in lotions, serums, sunscreens, and hair care formulations. Manufacturers are developing bio-based esters that not only replace synthetic alternatives but also deliver antioxidant, anti-aging, and UV protection properties. This innovation allows brands to create clean-label, high-efficacy products that meet growing consumer expectations for sustainable and multifunctional beauty solutions.
In addition, the rise of hybrid skincare and makeup products has further fueled demand for multifunctional esters. LexFeel N5 INOLEX, Sensolene (Hallstar, Lipex SheaLight AAK, ECOCERT-Certified Coco-Caprylate/Caprate and Heliofeel Lucas Meyer Cosmetics esters help in formulating long-lasting, lightweight, and non-greasy products while maintaining natural, eco-friendly credentials. With increasing regulatory restrictions on silicones and petrochemical-based emollients, green chemistry advancements are driving the adoption of plant-derived, biodegradable esters that offer similar or superior performance.
The ongoing R&D in ester technology is expanding market potential by enabling customized formulations tailored to specific skin types and consumer needs. As innovation continues, multifunctional emollient esters are set to play a key role in shaping the future of sustainable, high-performance personal care products, making them a lucrative opportunity for industry growth.
For instance,
- In April 2024, an article published by Advancion Corporation stated that its new bio-based multifunctional amino alcohol enhances skin hydration, spreadability, and product stability in lotions, serums, sunscreens, and hair care products. With antioxidant, anti-aging, and UV protection properties, this innovation supports clean-label, high-efficacy formulations, meeting consumer demand for sustainable and multifunctional beauty solutions in personal care products
- In February 2025, an article published by Dotdash Meredith stated that Versed Skincare launched the Skin Solution Multi-Serum Skin Tint, a hybrid product combining serum, foundation, and SPF 40. This innovation reflects the growing demand for multifunctional esters, enabling long-lasting, lightweight, and eco-friendly formulations that align with consumer preferences for sustainable, high-performance beauty products
According to Ruby’s Organics, its Moisturizing Primer features a silicone-free, antioxidant-rich formula with hyaluronic acid and bakuchiol, providing hydration while prolonging makeup wear. This product exemplifies the shift toward plant-derived, biodegradable esters, catering to consumer demand for eco-friendly, multifunctional beauty solutions in skincare and makeup formulations
The emollient esters market is growing due to multifunctional esters that enhance moisturization, stability, and sensory appeal in cosmetics. Rising demand for sustainable, high-performance formulations is driving innovation in bio-based, biodegradable esters. Advancements in green chemistry and hybrid skincare trends are expanding market opportunities for eco-friendly personal care products.
Restraints/Challenges
- Intense Competition From Alternative Emollients
As the demand for natural, sustainable, and high-performance skincare ingredients grows, various alternative emollients such as plant-based oils, butters, and silicone substitutes are gaining traction in the beauty and personal care industry.
Many cosmetic brands such as L’Oréal, Unilever, Estée Lauder and Procter & Gamble are experimenting with bio-based oils such as argan, jojoba, and coconut oil, which offer similar moisturizing and skin-conditioning properties as emollient esters. In addition, new-age plant-derived silicones and synthetic-free emollients are emerging as viable replacements for traditional ester-based formulations, appealing to brands focused on clean beauty and transparency.
Another challenge comes from cost-effectiveness and performance efficiency. Some alternative emollients provide enhanced stability, improved skin feel, and better penetration, making them attractive options for formulators. Moreover, with regulatory restrictions on certain ester compounds and growing consumer awareness about ingredient safety, brands are actively looking for non-toxic, allergen-free alternatives.
To maintain market relevance, emollient ester manufacturers are investing in research and innovation, focusing on biodegradable, multifunctional esters that provide better absorption, longevity, and eco-friendly benefits. Strategic collaborations with cosmetic brands, alongside the development of customized solutions for different skin types, can help counterbalance the competitive pressure.
As alternative emollients continue to evolve, the emollient esters market must adapt by enhancing performance, sustainability, and versatility to secure long-term market growth.
For instance,
- In February 2025, an article published by Dotdash, Meredith highlighted that Sofie Pavitt’s Omega Rich Moisturizer features argan and jojoba oils, offering deep hydration while remaining non-comedogenic. This product exemplifies the growing use of bio-based oils as alternatives to emollient esters, aligning with the clean beauty trend and consumer demand for natural, skin-conditioning ingredients in skincare formulations
- According to SOCRI S.r.l., SILGREEN is a 100% plant-derived silicone alternative that offers a dry, silky texture without synthetic silicones. This innovation reflects the rising demand for synthetic-free emollients, providing a sustainable, eco-friendly solution for cosmetic formulations while aligning with the clean beauty movement and consumer preference for natural ingredients
The emollient esters market faces growing competition from alternative emollients such as plant-based oils and silicone substitutes, affecting market share. With cost-efficiency, performance advantages, and regulatory shifts, brands seek non-toxic, sustainable alternatives. To stay competitive, manufacturers focus on biodegradable, multifunctional esters, innovation, and strategic collaborations for long-term growth.
- Complex Regulatory Compliance
The emollient esters market faces a significant challenge due to complex regulatory compliance, which creates high barriers for new entrants. Governments and regulatory bodies worldwide have strict guidelines on ingredient safety, environmental impact, and product labeling, making it difficult for new companies to enter the market.
One of the biggest hurdles is ingredient approval. Emollient esters used in skincare and personal care products must meet stringent safety standards set by organizations such as the FDA (U.S.), REACH (Europe), and other Middle East and Africa regulatory agencies. These approvals require extensive testing, documentation, and compliance with evolving regulations, leading to delays and increased costs for new businesses.
Another challenge is sustainability and environmental impact regulations. Many countries are enforcing restrictions on synthetic ingredients, microplastics, and non-biodegradable compounds, pushing companies to invest in eco-friendly alternatives. However, developing biodegradable, plant-based esters that meet performance standards while complying with regulations requires significant research and development (R&D) investments, making it harder for smaller players to compete.
In addition, regulations related to labeling, marketing claims, and product transparency are becoming stricter. Brands must accurately disclose ingredients, sustainability claims, and product efficacy, ensuring compliance with clean beauty standards and consumer safety laws. Any non-compliance can lead to product recalls, fines, or bans, posing a risk to new entrants.
For instances,
- In February 2022, according to the U.S. FDA, cosmetic products and ingredients (except color additives) do not require premarket approval. However, companies must ensure product safety, meeting stringent standards. This regulatory requirement increases testing, documentation, and compliance costs, posing challenges for new businesses entering the emollient esters market and the broader skincare industry
- According to an article published by the Financial Times, the European Chemicals Agency (ECHA) found that many cosmetics sold in the European Union contain toxic substances such as PFAS, leading to stricter regulations. This shift forces companies to invest in biodegradable, plant-based alternatives, increasing R&D costs and making market entry more challenging for smaller players
Strict regulatory compliance in the emollient esters market creates high barriers for new entrants. Ingredient approvals, sustainability regulations, and strict labeling laws demand extensive testing and R&D investments. Non-compliance risks fines or bans, making it crucial for companies to prioritize regulatory expertise, eco-friendly innovation, and transparency to compete effectively.
Impact and Current Market Scenario of Raw Material Shortage and Shipping Delays
Data Bridge Market Research offers a high-level analysis of the market and delivers information by keeping in account the impact and current market environment of raw material shortage and shipping delays. This translates into assessing strategic possibilities, creating effective action plans, and assisting businesses in making important decisions.
Apart from the standard report, we also offer in-depth analysis of the procurement level from forecasted shipping delays, distributor mapping by region, commodity analysis, production analysis, price mapping trends, sourcing, category performance analysis, supply chain risk management solutions, advanced benchmarking, and other services for procurement and strategic support.
Expected Impact of Economic Slowdown on the Pricing and Availability of Products
When economic activity slows, industries begin to suffer. The forecasted effects of the economic downturn on the pricing and accessibility of the products are taken into account in the market insight reports and intelligence services provided by DBMR. With this, our clients can typically keep one step ahead of their competitors, project their sales and revenue, and estimate their profit and loss expenditures.
Middle East and Africa Emollient Esters Market Scope
The market is segmented on the basis of product, purity, form, and application. The growth amongst these segments will help you analyze meagre growth segments in the industries and provide the users with a valuable market overview and market insights to help them make strategic decisions for identifying core market applications.
Product
- Isopropyl Myristate
- Isopropyl Myristate, By Grade
- Cosmetic Grade
- Pharmaceutical Grade
- Industrial Grade
- Isopropyl Myristate, By Grade
- Isopropyl Palmitate
- Isopropyl Palmitate, By Grade
- Cosmetic Grade
- Pharmaceutical Grade
- Industrial Grade
- Isopropyl Palmitate, By Grade
- Methyl Myristate
- Methyl Myristate, By Grade
- Cosmetic Grade
- Pharmaceutical Grade
- Industrial Grade
- Methyl Myristate, By Grade
- Methyl Palmitate
- Methyl Palmitate, By Grade
- Cosmetic Grade
- Pharmaceutical Grade
- Industrial Grade
- Methyl Palmitate, By Grade
- Methyl Laurate
- Methyl Laurate, By Grade
- Cosmetic Grade
- Pharmaceutical Grade
- Industrial Grade
- Methyl Laurate, By Grade
- Myristyl Myristate
- Methyl Myristate, By Grade
- Cosmetic Grade
- Pharmaceutical Grade
- Industrial Grade
- Methyl Myristate, By Grade
- Caprylic / Capric Triglyceride
- Caprylic / Capric Triglyceride, By Grade
- Cosmetic Grade
- Pharmaceutical Grade
- Industrial Grade
- Caprylic / Capric Triglyceride, By Grade
- Octyl Myristate
- Octyl Myristate, By Grade
- Cosmetic Grade
- Pharmaceutical Grade
- Industrial Grade
- Octyl Myristate, By Grade
- Octyl Palmitate
- Octyl Palmitate, By Grade
- Cosmetic Grade
- Pharmaceutical Grade
- Industrial Grade
- Octyl Palmitate, By Grade
- Other
- Other, By Grade
- Cosmetic Grade
- Pharmaceutical Grade
- Industrial Grade
- Other, By Grade
Purity
- Less Than 99%
- Greater Than 99%
Form
- Liquid
- Dry
Application
- Cosmetics and Personal Care
- Cosmetics and Personal Care, By Application
- Lotions
- Sun Cream
- Makeup
- Body Washes
- Deodorants
- Others
- Cosmetics And Personal Care, By Product
- Isopropyl Myristate
- Caprylic / Capric Triglyceride
- Isopropyl Palmitate
- Octyl Palmitate
- Octyl Myristate
- Methyl Laurate
- Methyl Palmitate
- Methyl Myristate
- Myristyl Myristate
- Other
- Cosmetics and Personal Care, By Application
- Hair Care Products
- Hair Care Products, By Application
- Shampoos
- Conditioners
- Serums
- Hair Masks
- Others
- Hair Care Products, By Product
- Caprylic / Capric Triglyceride
- Isopropyl Myristate
- Isopropyl Palmitate
- Octyl Palmitate
- Octyl Myristate
- Methyl Laurate
- Methyl Palmitate
- Methyl Myristate
- Myristyl Myristate
- Other
- Hair Care Products, By Application
- Pharmaceuticals
- Pharmaceuticals, By Application
- Topical Medications
- Oral Pharmaceuticals
- Pharmaceuticals, By Product
- Caprylic / Capric Triglyceride
- Isopropyl Myristate
- Caprylic / Capric Triglyceride
- Isopropyl Palmitate
- Methyl Laurate
- Octyl Palmitate
- Octyl Myristate
- Methyl Myristate
- Methyl Palmitate
- Myristyl Myristate
- Other
- Pharmaceuticals, By Application
- Food Industry
- Food Industry, By Application
- Emulsifyers
- Flavouring Agents
- Food Preservatives
- Enzymes
- Nutraceuticals
- Probiotics
- Others
- Food Industry, By Product
- Caprylic / Capric Triglyceride
- Isopropyl Myristate
- Methyl Laurate
- Octyl Palmitate
- Methyl Palmitate
- Methyl Myristate
- Octyl Myristate
- Isopropyl Palmitate
- Myristyl Myristate
- Other
- Food Industry, By Application
- Others
- Others, By Product
- Caprylic / Capric Triglyceride
- Isopropyl Myristate
- Isopropyl Palmitate
- Octyl Palmitate
- Octyl Myristate
- Methyl Laurate
- Methyl Palmitate
- Methyl Myristate
- Myristyl Myristate
- Other
- Others, By Product
Middle East and Africa Emollient Esters Market Regional Analysis
The market is analyzed and market size insights and trends are provided by country, product, purity, form, and application as referenced above.
The countries covered in the market are, South Africa, Saudi Arabia, U.A.E., Qatar, Egypt, Israel, Kuwait, Oman, Bahrain, and rest Of Middle East And Africa.
South Africa is expected to dominate the market due to its large consumer base, advanced manufacturing capabilities, and significant technological advancements. The government's strategic policies and investments in infrastructure and innovation further solidify its Middle East and Africa market influence. In addition, China's Middle East and Africa trade dominance through initiatives such as the Belt and Road Initiative expands its economic reach.
South Africa is the fastest-growing country, driven by a booming cosmetics industry, rising consumer demand for skincare products, and expanding manufacturing and export capabilities.
The country section of the report also provides individual market impacting factors and changes in regulation in the market domestically that impacts the current and future trends of the market. Data points such as down-stream and upstream value chain analysis, technical trends and porter's five forces analysis, case studies are some of the pointers used to forecast the market scenario for individual countries. Also, the presence and availability of Middle East and Africa brands and their challenges faced due to large or scarce competition from local and domestic brands, impact of domestic tariffs and trade routes are considered while providing forecast analysis of the country data.
Middle East and Africa Emollient Esters Market Share
The market competitive landscape provides details by competitors. Details included are company overview, company financials, revenue generated, market potential, investment in research and development, new market initiatives, Middle East and Africa presence, production sites and facilities, production capacities, company strengths and weaknesses, product launch, product width and breadth, application dominance. The above data points provided are only related to the companies' focus related to market.
Middle East and Africa Emollient Esters Market Leaders Operating in the Market Are:
- Kao Corporation (Japan)
- Hefei TNJ Chemical Industry Co., Ltd. (China)
- PHOENIX CHEMICAL, INC (U.S.)
- ZhiShang Chemical (China)
- Rxchemicals.com (U.S.)
- Suriachem Sdn. Bhd. (Malaysia)
- Haihang Industry (China)
- ATAMAN KIMYA (Turkey)
- Matangi Industries (India)
- EMCO DYESTUFF (India)
- SIHAULI CHEMICALS PRIVATE LIMITED (India)
- Baoran (China)
- Mohini Organics Pvt. Ltd. (India)
- Gravity Chemicals (India)
Latest Developments in Middle East and Africa Emollient Esters Market
- In February 2023, Kao announces the launch of Bioré UV Aqua Rich Airy Hold Cream, a new skincare product offering high-level UV protection. This cream is designed to protect the skin from sun damage while providing a lightweight, breathable feel, making it ideal for everyday use without heaviness. The key benefit is its ability to deliver effective sun protection while keeping the skin feeling fresh and comfortable. Exclusively available at selected outlets, the product offers an advanced sun care solution that combines both protection and comfort, catering to consumers seeking lightweight, high-performance skincare
- In February 2023, Kao announces a new global campaign for Bioré UV, in collaboration with K-pop group Stray Kids, titled "SUNLIGHT IS YOUR SPOTLIGHT." The campaign aims to raise awareness about the importance of sun protection while promoting Bioré UV products. It encourages people to embrace sun care as part of an active lifestyle, highlighting the brand’s effective UV protection. The key benefit of this campaign is educating consumers on the significance of skincare and UV protection in daily routines, using the influence of Stray Kids to reach a wider, global audience
- In August 2022, Kao announces its acquisition of Bondi Sands, an Australian brand renowned for its self-tanning and sun care products. This acquisition aims to expand Kao’s presence in the global skincare and sun care market, enhancing its portfolio with high-quality tanning solutions. The key benefit of this acquisition is the addition of Bondi Sands’ popular products, allowing Kao to better cater to consumers seeking sun-kissed skin and effective sun protection. This move strengthens Kao's position in the growing self-tanning and sun care segments, providing more options for skincare enthusiasts worldwide
- In November 2023, Haihang Industry participated in Chemspec Europe 2024, held at the Düsseldorf Exhibition Center in Germany from June 19th to 20th. This event marked the 37th International Exhibition for Fine and Specialty Chemicals. At Booth No. C17, Haihang showcased over 60 of their latest chemical products, including cosmetic ingredients, biocide raw materials, pigment and dye raw materials, and intermediate products. During the exhibition, Haihang hosted 89 customers, providing product brochures, souvenirs, and customer gifts to showcase their industry expertise and commitment to quality service, fostering strong business relationships. They engaged with peers from the global chemical industry, exploring the latest market trends and technological advancements
SKU-

- Interactive Data Analysis Dashboard
- Company Analysis Dashboard for high growth potential opportunities
- Research Analyst Access for customization & queries
- Competitor Analysis with Interactive dashboard
- Latest News, Updates & Trend analysis
- Harness the Power of Benchmark Analysis for Comprehensive Competitor Tracking
Table of Content
1 INTRODUCTION
1.1 OBJECTIVES OF THE STUDY
1.2 MARKET DEFINITION
1.3 OVERVIEW
1.4 LIMITATIONS
1.5 MARKETS COVERED
2 MARKET SEGMENTATION
2.1 MARKETS COVERED
2.2 GEOGRAPHICAL SCOPE
2.3 YEARS CONSIDERED FOR THE STUDY
2.4 CURRENCY AND PRICING
2.5 DBMR TRIPOD DATA VALIDATION MODEL
2.6 MULTIVARIATE MODELING
2.7 PRIMARY INTERVIEWS WITH KEY OPINION LEADERS
2.8 DBMR MARKET POSITION GRID
2.9 DBMR VENDOR SHARE ANALYSIS
2.1 MARKET APPLICATION COVERAGE GRID
2.11 SECONDARY SOURCES
2.12 ASSUMPTIONS
3 EXECUTIVE SUMMARY
4 PREMIUM INSIGHTS
4.1 PESTEL ANALYSIS
4.1.1 POLITICAL FACTORS
4.1.2 ECONOMIC FACTORS
4.1.3 SOCIAL FACTORS
4.1.4 TECHNOLOGICAL FACTORS
4.1.5 ENVIRONMENTAL FACTORS
4.1.6 LEGAL FACTORS
4.2 PORTER’S FIVE FORCES ANALYSIS
4.2.1 THREAT OF NEW ENTRANTS
4.2.2 BARGAINING POWER OF SUPPLIERS
4.2.3 BARGAINING POWER OF BUYERS
4.2.4 THREAT OF SUBSTITUTES
4.2.5 INTERNAL COMPETITION
4.3 PRODUCTION CAPACITY FOR TOP MANUFACTURERS
4.4 PRODUCTION CONSUMPTION ANALYSIS
4.5 VALUE CHAIN ANALYSIS: MIDDLE EAST AND AFRICA EMOLLIENT ESTERS MARKET
4.6 VENDOR SELECTION CRITERIA
4.7 CLIMATE CHANGE SCENARIO
4.7.1 ENVIRONMENTAL CONCERNS
4.7.2 INDUSTRY RESPONSE
4.7.3 GOVERNMENT’S ROLE
4.7.4 ANALYST RECOMMENDATIONS
4.8 GO TO MARKET STRATEGY
4.9 IMPORT EXPORT SCENARIO
4.9.1 OVERVIEW
4.9.2 PRODUCTION AND EXPORT DYNAMICS
4.9.2.1 ASIA-PACIFIC: THE PRODUCTION HUB
4.9.2.2 EXPORT TRENDS
4.9.3 CONSUMPTION AND IMPORT DYNAMICS
4.9.3.1 NORTH AMERICA AND EUROPE: THE MAJOR CONSUMERS
4.9.3.2 IMPORT TRENDS
4.9.4 KEY TRADE FLOWS
4.9.5 CHALLENGES AND OPPORTUNITIES
4.9.5.1 CHALLENGES
4.9.5.2 OPPORTUNITIES
4.9.6 CONCLUSION
4.1 IMPACT OF TRADE POLICIES ON THE EMOLLIENT ESTERS MARKET
4.10.1 COMPLEX SUPPLY CHAINS AND MIDDLE EAST AND AFRICA TRADE DEPENDENCIES
4.10.1.1 TARIFFS, IMPORT DUTIES, AND THEIR IMPLICATIONS
4.10.1.2 REGULATORY CHALLENGES AND ENVIRONMENTAL COMPLIANCE
4.10.1.3 SHIFTING CONSUMER PREFERENCES AND MARKET ADAPTATION
4.10.1.4 STRATEGIC RESPONSES AND COMPETITIVE LANDSCAPE
4.10.2 FUTURE OUTLOOK AND CONCLUSION
4.11 IMPACT OF TRADE POLICIES ON THE EMOLLIENT ESTERS MARKET
4.11.1 COMPLEX SUPPLY CHAINS AND MIDDLE EAST AND AFRICA TRADE DEPENDENCIES
4.11.2 TARIFFS, IMPORT DUTIES, AND THEIR IMPLICATIONS
4.11.3 REGULATORY CHALLENGES AND ENVIRONMENTAL COMPLIANCE
4.11.4 SHIFTING CONSUMER PREFERENCES AND MARKET ADAPTATION
4.11.5 STRATEGIC RESPONSES AND COMPETITIVE LANDSCAPE
4.11.6 FUTURE OUTLOOK AND CONCLUSION
4.12 MANUFACTURING PATTERNS IN THE MIDDLE EAST AND AFRICA EMOLLIENT ESTERS MARKET: TRENDS, CHALLENGES, AND INNOVATIONS
4.12.1 INTRODUCTION
4.12.1.1 MIDDLE EAST AND AFRICA MANUFACTURING LANDSCAPE: KEY REGIONS AND PLAYERS
4.12.2 MANUFACTURING PROCESSES AND TECHNOLOGIES
4.12.3 RAW MATERIAL SOURCING AND SUPPLY CHAIN DYNAMICS
4.12.4 INNOVATIONS AND MARKET TRENDS
4.12.5 CONCLUSION
4.13 PRICING ANALYSIS
4.14 PROFIT MARGIN ANALYSIS
4.14.1 MARKET SIZE AND GROWTH
4.14.2 REVENUE STREAMS
4.14.3 COST STRUCTURE
4.14.4 REGIONAL PROFITABILITY
4.14.5 COMPETITIVE LANDSCAPE
4.14.6 REGULATORY IMPACT
4.15 RAW MATERIAL COVERAGE OF EMOLLIENT ESTERS
4.16 SUPPLY CHAIN ANALYSIS
4.16.1 OVERVIEW
4.16.2 LOGISTIC COST SCENARIO
4.16.3 IMPORTANCE OF LOGISTICS SERVICE PROVIDERS
4.17 TECHNOLOGICAL ADVANCEMENTS BY MANUFACTURERS IN EMOLLIENT ESTERS
5 REGULATION COVERAGE
6 MARKET OVERVIEW
6.1 DRIVERS
6.1.1 EXPANDING PHARMACEUTICAL & DERMATOLOGY APPLICATIONS
6.1.2 GROWING DEMAND FOR PERSONAL CARE & COSMETICS
6.1.3 RISING DISPOSABLE INCOME & CHANGING LIFESTYLES
6.2 RESTRAINTS
6.2.1 VARIATIONS IN RAW MATERIAL PRICES AFFECT THE STABILITY OF PRODUCTION COSTS
6.2.2 STRINGENT REGULATORY POLICIES RESTRICT PRODUCT FORMULATIONS AND APPROVALS
6.3 OPPORTUNITIES
6.3.1 RISING DEMAND FOR BIODEGRADABLE AND SUSTAINABLE COSMETIC INGREDIENTS
6.3.2 INNOVATION IN MULTIFUNCTIONAL ESTERS ENHANCES MARKET GROWTH POTENTIAL
6.4 CHALLENGES
6.4.1 INTENSE COMPETITION FROM ALTERNATIVE EMOLLIENTS AFFECTS MARKET SHARE
6.4.2 COMPLEX REGULATORY COMPLIANCE INCREASES BARRIERS FOR NEW ENTRANTS
7 MIDDLE EAST AND AFRICA EMOLLIENT ESTERS MARKET, BY PRODUCT
7.1 OVERVIEW
7.2 ISOPROPYL MYRISTATE
7.2.1 ISOPROPYL MYRISTATE, BY GRADE
7.3 ISOPROPYL PALMITATE
7.3.1 ISOPROPYL PALMITATE, BY GRADE
7.4 METHYL MYRISTATE
7.4.1 METHYL MYRISTATE, BY GRADE
7.5 METHYL PALMITATE
7.5.1 METHYL PALMITATE, BY GRADE
7.6 METHYL LAURATE
7.6.1 METHYL LAURATE, BY GRADE
7.7 MYRISTYL MYRISTATE
7.7.1 MYRISTYL MYRISTATE, BY GRADE
7.8 CAPRYLIC / CAPRIC TRIGLYCERIDE
7.8.1 CAPRYLIC / CAPRIC TRIGLYCERIDE, BY GRADE
7.9 OCTYL MYRISTATE
7.9.1 OCTYL MYRISTATE, BY GRADE
7.1 OCTYL PALMITATE
7.10.1 OCTYL PALMITATE, BY GRADE
7.11 OTHERS
7.11.1 OTHERS, BY GRADE
8 MIDDLE EAST AND AFRICA EMOLLIENT ESTERS MARKET, BY PURITY
8.1 OVERVIEW
8.2 LESS THAN 99%
8.3 GREATER THAN 99%
9 MIDDLE EAST AND AFRICA EMOLLIENT ESTERS MARKET, BY FORM
9.1 OVERVIEW
9.2 LIQUID
9.3 DRY
10 MIDDLE EAST AND AFRICA EMOLLIENT ESTERS MARKET, BY APPLICATION
10.1 OVERVIEW
10.2 COSMETICS AND PERSONAL CARE
10.3 HAIR CARE PRODUCTS
10.4 PHARMACEUTICALS
10.5 FOOD INDUSTRY
10.6 OTHERS
11 MIDDLE EAST AND AFRICA EMOLLIENT ESTERS MARKET, BY REGION
11.1 MIDDLE EAST AND AFRICA
11.1.1 SOUTH AFRICA
11.1.2 SAUDI ARABIA
11.1.3 U.A.E.
11.1.4 QATAR
11.1.5 EGYPT
11.1.6 ISRAEL
11.1.7 KUWAIT
11.1.8 OMAN
11.1.9 BAHRAIN
11.1.10 REST OF MIDDLE EAST AND AFRICA
12 EMOLLIENT ESTERS MARKET: COMPANY LANDSCAPE
12.1 COMPANY SHARE ANALYSIS: GLOBAL
13 SWOT ANALYSIS
14 COMPANY PROFILES
14.1 KAO CORPORATION
14.1.1 COMPANY SNAPSHOT
14.1.2 REVENUE ANALYSIS
14.1.3 COMPANY SHARE ANALYSIS
14.1.4 PRODUCT PORTFOLIO
14.1.5 RECENT DEVELOPMENT
14.2 HEFEI TNJ CHEMICAL INDUSTRY CO.,LTD.
14.2.1 COMPANY SNAPSHOT
14.2.2 COMPANY SHARE ANALYSIS
14.2.3 PRODUCT PORTFOLIO
14.2.4 RECENT DEVELOPMENT
14.3 PHOENIX CHEMICAL, INC
14.3.1 COMPANY SNAPSHOT
14.3.2 COMPANY SHARE ANALYSIS
14.3.3 PRODUCT PORTFOLIO
14.3.4 RECENT DEVELOPMENT
14.4 ZHISHANGCHEM
14.4.1 COMPANY SNAPSHOT
14.4.2 COMPANY SHARE ANALYSIS
14.4.3 PRODUCT PORTFOLIO
14.4.4 RECENT DEVELOPMENT
14.5 RXCHEMICALS.COM
14.5.1 COMPANY SNAPSHOT
14.5.2 COMPANY SHARE ANALYSIS
14.5.3 PRODUCT PORTFOLIO
14.5.4 RECENT DEVELOPMENT
14.6 ATAMAN KIMYA
14.6.1 COMPANY SNAPSHOT
14.6.2 PRODUCT PORTFOLIO
14.6.3 RECENT DEVELOPMENT
14.7 BAORANCHEMICAL
14.7.1 COMPANY SNAPSHOT
14.7.2 PRODUCT PORTFOLIO
14.7.3 RECENT DEVELOPMENT
14.8 EMCO DYESTUFF
14.8.1 COMPANY SNAPSHOT
14.8.2 PRODUCT PORTFOLIO
14.8.3 RECENT DEVELOPMENT
14.9 ESTEEM INDUSTRIES PRIVATE LIMIT
14.9.1 COMPANY SNAPSHOT
14.9.2 PRODUCT PORTFOLIO
14.9.3 RECENT DEVELOPMENT
14.1 GRAVITY CHEMICALS
14.10.1 COMPANY SNAPSHOT
14.10.2 PRODUCT PORTFOLIO
14.10.3 RECENT DEVELOPMENT
14.11 HAIHANG INDUSTRY
14.11.1 COMPANY SNAPSHOT
14.11.2 PRODUCT PORTFOLIO
14.11.3 RECENT NEWS
14.12 MOHINI ORGANICS PVT. LTD.
14.12.1 COMPANY SNAPSHOT
14.12.2 PRODUCT PORTFOLIO
14.12.3 RECENT DEVELOPMENT
14.13 MATANGI INDUSTRIES
14.13.1 COMPANY SNAPSHOT
14.13.2 PRODUCT PORTFOLIO
14.13.3 RECENT DEVELOPMENT
14.14 SIHAULI CHEMICALS PRIVATE LIMITED.
14.14.1 COMPANY SNAPSHOT
14.14.2 PRODUCT PORTFOLIO
14.14.3 RECENT DEVELOPMENT
14.15 SURIACHEM SDN.BHD.
14.15.1 COMPANY SNAPSHOT
14.15.2 PRODUCT PORTFOLIO
14.15.3 RECENT DEVELOPMENT
15 QUESTIONNAIRE
16 RELATED REPORTS
List of Table
TABLE 1 TABLE 1 MIDDLE EAST AND AFRICA EMOLLIENT ESTERS MARKET, BY PRODUCT, 2018-2032 (USD/KG)
TABLE 2 REGULATORY COVERAGE
TABLE 3 MIDDLE EAST AND AFRICA EMOLLIENT ESTERS MARKET, BY PRODUCT, 2018-2032 (USD)
TABLE 4 MIDDLE EAST AND AFRICA EMOLLIENT ESTERS MARKET, BY PRODUCT, 2018-2032 (TONS)
TABLE 5 MIDDLE EAST AND AFRICA ISOPROPYL MYRISTATE IN EMOLLIENT ESTERS MARKET, BY REGION, 2018-2032 (USD)
TABLE 6 MIDDLE EAST AND AFRICA ISOPROPYL MYRISTATE IN EMOLLIENT ESTERS MARKET, BY REGION, 2018-2032 (TONS)
TABLE 7 MIDDLE EAST AND AFRICA ISOPROPYL MYRISTATE IN EMOLLIENT ESTERS MARKET, BY GRADE, 2018-2032 (USD)
TABLE 8 MIDDLE EAST AND AFRICA ISOPROPYL PALMITATE IN EMOLLIENT ESTERS MARKET, BY REGION, 2018-2032 (USD)
TABLE 9 MIDDLE EAST AND AFRICA ISOPROPYL PALMITATE IN EMOLLIENT ESTERS MARKET, BY REGION, 2018-2032 (TONS)
TABLE 10 MIDDLE EAST AND AFRICA ISOPROPYL PALMITATE IN EMOLLIENT ESTERS MARKET, BY GRADE, 2018-2032 (USD)
TABLE 11 MIDDLE EAST AND AFRICA METHYL MYRISTATE IN EMOLLIENT ESTERS MARKET, BY REGION, 2018-2032 (USD)
TABLE 12 MIDDLE EAST AND AFRICA METHYL MYRISTATE IN EMOLLIENT ESTERS MARKET, BY REGION, 2018-2032 (TONS)
TABLE 13 MIDDLE EAST AND AFRICA METHYL MYRISTATE IN EMOLLIENT ESTERS MARKET, BY GRADE, 2018-2032 (USD)
TABLE 14 MIDDLE EAST AND AFRICA METHYL PALMITATE IN EMOLLIENT ESTERS MARKET, BY REGION, 2018-2032 (USD)
TABLE 15 MIDDLE EAST AND AFRICA METHYL PALMITATE IN EMOLLIENT ESTERS MARKET, BY REGION, 2018-2032 (TONS)
TABLE 16 MIDDLE EAST AND AFRICA METHYL PALMITATE IN EMOLLIENT ESTERS MARKET, BY GRADE, 2018-2032 (USD)
TABLE 17 MIDDLE EAST AND AFRICA METHYL LAURATE IN EMOLLIENT ESTERS MARKET, BY REGION, 2018-2032 (USD)
TABLE 18 MIDDLE EAST AND AFRICA METHYL LAURATE IN EMOLLIENT ESTERS MARKET, BY REGION, 2018-2032 (TONS)
TABLE 19 MIDDLE EAST AND AFRICA METHYL LAURATE IN EMOLLIENT ESTERS MARKET, BY GRADE, 2018-2032 (USD)
TABLE 20 MIDDLE EAST AND AFRICA MYRISTYL MYRISTATE IN EMOLLIENT ESTERS MARKET, BY REGION, 2018-2032 (USD)
TABLE 21 MIDDLE EAST AND AFRICA MYRISTYL MYRISTATE IN EMOLLIENT ESTERS MARKET, BY REGION, 2018-2032 (TONS)
TABLE 22 MIDDLE EAST AND AFRICA MYRISTYL MYRISTATE IN EMOLLIENT ESTERS MARKET, BY GRADE, 2018-2032 (USD)
TABLE 23 MIDDLE EAST AND AFRICA CAPRYLIC / CAPRIC TRIGLYCERIDE IN EMOLLIENT ESTERS MARKET, BY REGION, 2018-2032 (USD)
TABLE 24 MIDDLE EAST AND AFRICA CAPRYLIC / CAPRIC TRIGLYCERIDE IN EMOLLIENT ESTERS MARKET, BY REGION, 2018-2032 (TONS)
TABLE 25 MIDDLE EAST AND AFRICA CAPRYLIC / CAPRIC TRIGLYCERIDE IN EMOLLIENT ESTERS MARKET, BY GRADE, 2018-2032 (USD)
TABLE 26 MIDDLE EAST AND AFRICA OCTYL MYRISTATE IN EMOLLIENT ESTERS MARKET, BY REGION, 2018-2032 (USD)
TABLE 27 MIDDLE EAST AND AFRICA OCTYL MYRISTATE IN EMOLLIENT ESTERS MARKET, BY REGION, 2018-2032 (TONS)
TABLE 28 MIDDLE EAST AND AFRICA OCTYL MYRISTATE IN EMOLLIENT ESTERS MARKET, BY GRADE, 2018-2032 (USD)
TABLE 29 MIDDLE EAST AND AFRICA OCTYL PALMITATE IN EMOLLIENT ESTERS MARKET, BY REGION, 2018-2032 (USD)
TABLE 30 MIDDLE EAST AND AFRICA OCTYL PALMITATE IN EMOLLIENT ESTERS MARKET, BY REGION, 2018-2032 (TONS)
TABLE 31 MIDDLE EAST AND AFRICA OCTYL PALMITATE IN EMOLLIENT ESTERS MARKET, BY GRADE, 2018-2032 (USD)
TABLE 32 MIDDLE EAST AND AFRICA OTHERS IN EMOLLIENT ESTERS MARKET, BY REGION, 2018-2032 (USD)
TABLE 33 MIDDLE EAST AND AFRICA OTHER IN EMOLLIENT ESTERS MARKET, BY REGION, 2018-2032 (TONS)
TABLE 34 MIDDLE EAST AND AFRICA OTHERS IN EMOLLIENT ESTERS MARKET, BY GRADE, 2018-2032 (USD)
TABLE 35 MIDDLE EAST AND AFRICA EMOLLIENT ESTERS MARKET, BY PURITY, 2018-2032 (USD)
TABLE 36 MIDDLE EAST AND AFRICA EMOLLIENT ESTERS MARKET, BY PURITY, 2018-2032 (TONS)
TABLE 37 MIDDLE EAST AND AFRICA LESS THAN 99% IN EMOLLIENT ESTERS MARKET, BY REGION, 2018-2032 (USD)
TABLE 38 MIDDLE EAST AND AFRICA LESS THAN 99% IN EMOLLIENT ESTERS MARKET, BY REGION, 2018-2032 (TONS)
TABLE 39 MIDDLE EAST AND AFRICA GREATER THAN 99% IN EMOLLIENT ESTERS MARKET, BY REGION, 2018-2032 (USD)
TABLE 40 MIDDLE EAST AND AFRICA GREATER THAN 99% IN EMOLLIENT ESTERS MARKET, BY REGION, 2018-2032 (TONS)
TABLE 41 MIDDLE EAST AND AFRICA EMOLLIENT ESTERS MARKET, BY FORM, 2018-2032 (USD)
TABLE 42 MIDDLE EAST AND AFRICA EMOLLIENT ESTERS MARKET, BY FORM, 2018-2032 (TONS)
TABLE 43 MIDDLE EAST AND AFRICA LIQUID IN EMOLLIENT ESTERS MARKET, BY REGION, 2018-2032 (USD)
TABLE 44 MIDDLE EAST AND AFRICA LIQUID IN EMOLLIENT ESTERS MARKET, BY REGION, 2018-2032 (TONS)
TABLE 45 MIDDLE EAST AND AFRICA LIQUID IN EMOLLIENT ESTERS MARKET, BY FORM, 2018-2032 (USD)
TABLE 46 MIDDLE EAST AND AFRICA DRY IN EMOLLIENT ESTERS MARKET, BY REGION, 2018-2032 (USD)
TABLE 47 MIDDLE EAST AND AFRICA DRY IN EMOLLIENT ESTERS MARKET, BY REGION, 2018-2032 (TONS)
TABLE 48 MIDDLE EAST AND AFRICA DRY IN EMOLLIENT ESTERS MARKET, BY FORM, 2018-2032 (USD)
TABLE 49 MIDDLE EAST AND AFRICA EMOLLIENT ESTERS MARKET, BY APPLICATION, 2018-2032 (USD)
TABLE 50 MIDDLE EAST AND AFRICA EMOLLIENT ESTERS MARKET, BY APPLICATION, 2018-2032 (TONS)
TABLE 51 MIDDLE EAST AND AFRICA COSMETICS AND PERSONAL CARE IN EMOLLIENT ESTERS MARKET, BY REGION, 2018-2032 (USD)
TABLE 52 MIDDLE EAST AND AFRICA COSMETICS AND PERSONAL CARE IN EMOLLIENT ESTERS MARKET, BY REGION, 2018-2032 (TONS)
TABLE 53 MIDDLE EAST AND AFRICA COSMETICS AND PERSONAL CARE IN EMOLLIENT ESTERS MARKET, BY APPLICATION, 2018-2032 (USD)
TABLE 54 MIDDLE EAST AND AFRICA COSMETICS AND PERSONAL CARE IN EMOLLIENT ESTERS MARKET, BY APPLICATION, 2018-2032 (TONS)
TABLE 55 MIDDLE EAST AND AFRICA COSMETICS AND PERSONAL CARE IN EMOLLIENT ESTERS MARKET, BY PRODUCT, 2018-2032 (USD)
TABLE 56 MIDDLE EAST AND AFRICA COSMETICS AND PERSONAL CARE IN EMOLLIENT ESTERS MARKET, BY PRODUCT, 2018-2032 (TONS)
TABLE 57 MIDDLE EAST AND AFRICA HAIR CARE PRODUCTS IN EMOLLIENT ESTERS MARKET, BY REGION, 2018-2032 (USD)
TABLE 58 MIDDLE EAST AND AFRICA HAIR CARE PRODUCTS IN EMOLLIENT ESTERS MARKET, BY REGION, 2018-2032 (TONS)
TABLE 59 MIDDLE EAST AND AFRICA HAIR CARE PRODUCTS IN EMOLLIENT ESTERS MARKET, BY APPLICATION, 2018-2032 (USD)
TABLE 60 MIDDLE EAST AND AFRICA HAIR CARE PRODUCTS IN EMOLLIENT ESTERS MARKET, BY APPLICATION, 2018-2032 (TONS)
TABLE 61 MIDDLE EAST AND AFRICA HAIR CARE PRODUCTS IN EMOLLIENT ESTERS MARKET, BY PRODUCT, 2018-2032 (USD)
TABLE 62 MIDDLE EAST AND AFRICA HAIR CARE PRODUCTS IN EMOLLIENT ESTERS MARKET, BY PRODUCT, 2018-2032 (TONS)
TABLE 63 MIDDLE EAST AND AFRICA PHARMACEUTICALS IN EMOLLIENT ESTERS MARKET, BY REGION, 2018-2032 (USD)
TABLE 64 MIDDLE EAST AND AFRICA PHARMACEUTICALS IN EMOLLIENT ESTERS MARKET, BY REGION, 2018-2032 (TONS)
TABLE 65 MIDDLE EAST AND AFRICA PHARMACEUTICALS IN EMOLLIENT ESTERS MARKET, BY APPLICATION, 2018-2032 (USD)
TABLE 66 MIDDLE EAST AND AFRICA PHARMACEUTICALS IN EMOLLIENT ESTERS MARKET, BY APPLICATION, 2018-2032 (TONS)
TABLE 67 MIDDLE EAST AND AFRICA PHARMACEUTICALS IN EMOLLIENT ESTERS MARKET, BY PRODUCT, 2018-2032 (USD)
TABLE 68 MIDDLE EAST AND AFRICA PHARMACEUTICALS IN EMOLLIENT ESTERS MARKET, BY PRODUCT, 2018-2032 (TONS)
TABLE 69 MIDDLE EAST AND AFRICA FOOD INDUSTRY IN EMOLLIENT ESTERS MARKET, BY REGION, 2018-2032 (USD)
TABLE 70 MIDDLE EAST AND AFRICA FOOD INDUSTRY IN EMOLLIENT ESTERS MARKET, BY REGION, 2018-2032 (TONS)
TABLE 71 MIDDLE EAST AND AFRICA FOOD INDUSTRY IN EMOLLIENT ESTERS MARKET, BY APPLICATION, 2018-2032 (USD)
TABLE 72 MIDDLE EAST AND AFRICA FOOD INDUSTRY IN EMOLLIENT ESTERS MARKET, BY APPLICATION, 2018-2032 (TONS)
TABLE 73 MIDDLE EAST AND AFRICA FOOD INDUSTRY IN EMOLLIENT ESTERS MARKET, BY PRODUCT, 2018-2032 (USD)
TABLE 74 MIDDLE EAST AND AFRICA FOOD INDUSTRY IN EMOLLIENT ESTERS MARKET, BY PRODUCT, 2018-2032 (TONS)
TABLE 75 MIDDLE EAST AND AFRICA OTHERS IN EMOLLIENT ESTERS MARKET, BY REGION, 2018-2032 (USD)
TABLE 76 MIDDLE EAST AND AFRICA OTHERS IN EMOLLIENT ESTERS MARKET, BY REGION, 2018-2032 (TONS)
TABLE 77 MIDDLE EAST AND AFRICA OTHERS IN EMOLLIENT ESTERS MARKET, BY PRODUCT, 2018-2032 (USD)
TABLE 78 MIDDLE EAST AND AFRICA OTHERS IN EMOLLIENT ESTERS MARKET, BY PRODUCT, 2018-2032 (TONS)
TABLE 79 MIDDLE EAST AND AFRICA EMOLLIENT ESTERS MARKET, BY COUNTRY, 2018-2032 (USD)
TABLE 80 MIDDLE EAST AND AFRICA EMOLLIENT ESTERS MARKET, BY COUNTRY, 2018-2032 (TONS)
TABLE 81 MIDDLE EAST AND AFRICA EMOLLIENT ESTERS MARKET, BY PRODUCT, 2018-2032 (USD)
TABLE 82 MIDDLE EAST AND AFRICA EMOLLIENT ESTERS MARKET, BY PRODUCT, 2018-2032 (TONS)
TABLE 83 MIDDLE EAST AND AFRICA ISOPROPYL MYRISTATE IN EMOLLIENT ESTERS MARKET, BY GRADE, 2018-2032 (USD)
TABLE 84 MIDDLE EAST AND AFRICA ISOPROPYL PALMITATE IN EMOLLIENT ESTERS MARKET, BY GRADE, 2018-2032 (USD)
TABLE 85 MIDDLE EAST AND AFRICA METHYL MYRISTATE IN EMOLLIENT ESTERS MARKET, BY GRADE, 2018-2032 (USD)
TABLE 86 MIDDLE EAST AND AFRICA METHYL PALMITATE IN EMOLLIENT ESTERS MARKET, BY GRADE, 2018-2032 (USD)
TABLE 87 MIDDLE EAST AND AFRICA METHYL LAURATE IN EMOLLIENT ESTERS MARKET, BY GRADE, 2018-2032 (USD)
TABLE 88 MIDDLE EAST AND AFRICA MYRISTYL MYRISTATE IN EMOLLIENT ESTERS MARKET, BY GRADE, 2018-2032 (USD)
TABLE 89 MIDDLE EAST AND AFRICA CAPRYLIC / CAPRIC TRIGLYCERIDE IN EMOLLIENT ESTERS MARKET, BY GRADE, 2018-2032 (USD)
TABLE 90 MIDDLE EAST AND AFRICA OCTYL MYRISTATE IN EMOLLIENT ESTERS MARKET, BY GRADE, 2018-2032 (USD)
TABLE 91 MIDDLE EAST AND AFRICA OCTYL PALMITATE IN EMOLLIENT ESTERS MARKET, BY GRADE, 2018-2032 (USD)
TABLE 92 MIDDLE EAST AND AFRICA OTHER IN EMOLLIENT ESTERS MARKET, BY GRADE, 2018-2032 (USD)
TABLE 93 MIDDLE EAST AND AFRICA EMOLLIENT ESTERS MARKET, BY PURITY, 2018-2032 (USD)
TABLE 94 MIDDLE EAST AND AFRICA EMOLLIENT ESTERS MARKET, BY PURITY, 2018-2032 (TONS)
TABLE 95 MIDDLE EAST AND AFRICA EMOLLIENT ESTERS MARKET, BY FORM, 2018-2032 (USD)
TABLE 96 MIDDLE EAST AND AFRICA EMOLLIENT ESTERS MARKET, BY FORM, 2018-2032 (TONS)
TABLE 97 MIDDLE EAST AND AFRICA LIQUID IN EMOLLIENT ESTERS MARKET, BY FORM, 2018-2032 (USD)
TABLE 98 MIDDLE EAST AND AFRICA DRY IN EMOLLIENT ESTERS MARKET, BY FORM, 2018-2032 (USD)
TABLE 99 MIDDLE EAST AND AFRICA EMOLLIENT ESTERS MARKET, BY APPLICATION, 2018-2032 (USD)
TABLE 100 MIDDLE EAST AND AFRICA EMOLLIENT ESTERS MARKET, BY APPLICATION, 2018-2032 (TONS)
TABLE 101 MIDDLE EAST AND AFRICA COSMETICS AND PERSONAL CARE IN EMOLLIENT ESTERS MARKET, BY APPLICATION, 2018-2032 (USD)
TABLE 102 MIDDLE EAST AND AFRICA COSMETICS AND PERSONAL CARE IN EMOLLIENT ESTERS MARKET, BY APPLICATION, 2018-2032 (TONS)
TABLE 103 MIDDLE EAST AND AFRICA COSMETICS AND PERSONAL CARE IN EMOLLIENT ESTERS MARKET, BY PRODUCT, 2018-2032 (USD)
TABLE 104 MIDDLE EAST AND AFRICA COSMETICS AND PERSONAL CARE IN EMOLLIENT ESTERS MARKET, BY PRODUCT, 2018-2032 (TONS)
TABLE 105 MIDDLE EAST AND AFRICA HAIR CARE PRODUCTS IN EMOLLIENT ESTERS MARKET, BY APPLICATION, 2018-2032 (USD)
TABLE 106 MIDDLE EAST AND AFRICA HAIR CARE PRODUCTS IN EMOLLIENT ESTERS MARKET, BY APPLICATION, 2018-2032 (TONS)
TABLE 107 MIDDLE EAST AND AFRICA HAIR CARE PRODUCTS IN EMOLLIENT ESTERS MARKET, BY PRODUCT, 2018-2032 (USD)
TABLE 108 MIDDLE EAST AND AFRICA HAIR CARE PRODUCTS IN EMOLLIENT ESTERS MARKET, BY PRODUCT, 2018-2032 (TONS)
TABLE 109 MIDDLE EAST AND AFRICA PHARMACEUTICALS IN EMOLLIENT ESTERS MARKET, BY APPLICATION, 2018-2032 (USD)
TABLE 110 MIDDLE EAST AND AFRICA PHARMACEUTICALS IN EMOLLIENT ESTERS MARKET, BY APPLICATION, 2018-2032 (TONS)
TABLE 111 MIDDLE EAST AND AFRICA PHARMACEUTICALS IN EMOLLIENT ESTERS MARKET, BY PRODUCT, 2018-2032 (USD)
TABLE 112 MIDDLE EAST AND AFRICA PHARMACEUTICALS IN EMOLLIENT ESTERS MARKET, BY PRODUCT, 2018-2032 (TONS)
TABLE 113 MIDDLE EAST AND AFRICA FOOD INDUSTRY IN EMOLLIENT ESTERS MARKET, BY APPLICATION, 2018-2032 (USD)
TABLE 114 MIDDLE EAST AND AFRICA FOOD INDUSTRY IN EMOLLIENT ESTERS MARKET, BY APPLICATION, 2018-2032 (USD)
TABLE 115 MIDDLE EAST AND AFRICA FOOD INDUSTRY IN EMOLLIENT ESTERS MARKET, BY PRODUCT, 2018-2032 (USD)
TABLE 116 MIDDLE EAST AND AFRICA FOOD INDUSTRY IN EMOLLIENT ESTERS MARKET, BY PRODUCT, 2018-2032 (TONS)
TABLE 117 MIDDLE EAST AND AFRICA OTHERS IN EMOLLIENT ESTERS MARKET, BY PRODUCT, 2018-2032 (USD)
TABLE 118 MIDDLE EAST AND AFRICA OTHERS IN EMOLLIENT ESTERS MARKET, BY PRODUCT, 2018-2032 (TONS)
TABLE 119 SOUTH AFRICA EMOLLIENT ESTERS MARKET, BY PRODUCT, 2018-2032 (USD)
TABLE 120 SOUTH AFRICA EMOLLIENT ESTERS MARKET, BY PRODUCT, 2018-2032 (TONS)
TABLE 121 SOUTH AFRICA ISOPROPYL MYRISTATE IN EMOLLIENT ESTERS MARKET, BY GRADE, 2018-2032 (USD)
TABLE 122 SOUTH AFRICA ISOPROPYL PALMITATE IN EMOLLIENT ESTERS MARKET, BY GRADE, 2018-2032 (USD)
TABLE 123 SOUTH AFRICA METHYL MYRISTATE IN EMOLLIENT ESTERS MARKET, BY GRADE, 2018-2032 (USD)
TABLE 124 SOUTH AFRICA METHYL PALMITATE IN EMOLLIENT ESTERS MARKET, BY GRADE, 2018-2032 (USD)
TABLE 125 SOUTH AFRICA METHYL LAURATE IN EMOLLIENT ESTERS MARKET, BY GRADE, 2018-2032 (USD)
TABLE 126 SOUTH AFRICA MYRISTYL MYRISTATE IN EMOLLIENT ESTERS MARKET, BY GRADE, 2018-2032 (USD)
TABLE 127 SOUTH AFRICA CAPRYLIC / CAPRIC TRIGLYCERIDE IN EMOLLIENT ESTERS MARKET, BY GRADE, 2018-2032 (USD)
TABLE 128 SOUTH AFRICA OCTYL MYRISTATE IN EMOLLIENT ESTERS MARKET, BY GRADE, 2018-2032 (USD)
TABLE 129 SOUTH AFRICA OCTYL PALMITATE IN EMOLLIENT ESTERS MARKET, BY GRADE, 2018-2032 (USD)
TABLE 130 SOUTH AFRICA OTHER IN EMOLLIENT ESTERS MARKET, BY GRADE, 2018-2032 (USD)
TABLE 131 SOUTH AFRICA EMOLLIENT ESTERS MARKET, BY PURITY, 2018-2032 (USD)
TABLE 132 SOUTH AFRICA EMOLLIENT ESTERS MARKET, BY PURITY, 2018-2032 (TONS)
TABLE 133 SOUTH AFRICA EMOLLIENT ESTERS MARKET, BY FORM, 2018-2032 (USD)
TABLE 134 SOUTH AFRICA EMOLLIENT ESTERS MARKET, BY FORM, 2018-2032 (TONS)
TABLE 135 SOUTH AFRICA LIQUID IN EMOLLIENT ESTERS MARKET, BY FORM, 2018-2032 (USD)
TABLE 136 SOUTH AFRICA DRY IN EMOLLIENT ESTERS MARKET, BY FORM, 2018-2032 (USD)
TABLE 137 SOUTH AFRICA EMOLLIENT ESTERS MARKET, BY APPLICATION, 2018-2032 (USD)
TABLE 138 SOUTH AFRICA EMOLLIENT ESTERS MARKET, BY APPLICATION, 2018-2032 (TONS)
TABLE 139 SOUTH AFRICA COSMETICS AND PERSONAL CARE IN EMOLLIENT ESTERS MARKET, BY APPLICATION, 2018-2032 (USD)
TABLE 140 SOUTH AFRICA COSMETICS AND PERSONAL CARE IN EMOLLIENT ESTERS MARKET, BY APPLICATION, 2018-2032 (TONS)
TABLE 141 SOUTH AFRICA COSMETICS AND PERSONAL CARE IN EMOLLIENT ESTERS MARKET, BY PRODUCT, 2018-2032 (USD)
TABLE 142 SOUTH AFRICA COSMETICS AND PERSONAL CARE IN EMOLLIENT ESTERS MARKET, BY PRODUCT, 2018-2032 (TONS)
TABLE 143 SOUTH AFRICA HAIR CARE PRODUCTS IN EMOLLIENT ESTERS MARKET, BY APPLICATION, 2018-2032 (USD)
TABLE 144 SOUTH AFRICA HAIR CARE PRODUCTS IN EMOLLIENT ESTERS MARKET, BY APPLICATION, 2018-2032 (TONS)
TABLE 145 SOUTH AFRICA HAIR CARE PRODUCTS IN EMOLLIENT ESTERS MARKET, BY PRODUCT, 2018-2032 (USD)
TABLE 146 SOUTH AFRICA HAIR CARE PRODUCTS IN EMOLLIENT ESTERS MARKET, BY PRODUCT, 2018-2032 (TONS)
TABLE 147 SOUTH AFRICA PHARMACEUTICALS IN EMOLLIENT ESTERS MARKET, BY APPLICATION, 2018-2032 (USD)
TABLE 148 SOUTH AFRICA PHARMACEUTICALS IN EMOLLIENT ESTERS MARKET, BY APPLICATION, 2018-2032 (TONS)
TABLE 149 SOUTH AFRICA PHARMACEUTICALS IN EMOLLIENT ESTERS MARKET, BY PRODUCT, 2018-2032 (USD)
TABLE 150 SOUTH AFRICA PHARMACEUTICALS IN EMOLLIENT ESTERS MARKET, BY PRODUCT, 2018-2032 (TONS)
TABLE 151 SOUTH AFRICA FOOD INDUSTRY IN EMOLLIENT ESTERS MARKET, BY APPLICATION, 2018-2032 (USD)
TABLE 152 SOUTH AFRICA FOOD INDUSTRY IN EMOLLIENT ESTERS MARKET, BY APPLICATION, 2018-2032 (USD)
TABLE 153 SOUTH AFRICA FOOD INDUSTRY IN EMOLLIENT ESTERS MARKET, BY PRODUCT, 2018-2032 (USD)
TABLE 154 SOUTH AFRICA FOOD INDUSTRY IN EMOLLIENT ESTERS MARKET, BY PRODUCT, 2018-2032 (TONS)
TABLE 155 SOUTH AFRICA OTHERS IN EMOLLIENT ESTERS MARKET, BY PRODUCT, 2018-2032 (USD)
TABLE 156 SOUTH AFRICA OTHERS IN EMOLLIENT ESTERS MARKET, BY PRODUCT, 2018-2032 (TONS)
TABLE 157 SAUDI ARABIA EMOLLIENT ESTERS MARKET, BY PRODUCT, 2018-2032 (USD)
TABLE 158 SAUDI ARABIA EMOLLIENT ESTERS MARKET, BY PRODUCT, 2018-2032 (TONS)
TABLE 159 SAUDI ARABIA ISOPROPYL MYRISTATE IN EMOLLIENT ESTERS MARKET, BY GRADE, 2018-2032 (USD)
TABLE 160 SAUDI ARABIA ISOPROPYL PALMITATE IN EMOLLIENT ESTERS MARKET, BY GRADE, 2018-2032 (USD)
TABLE 161 SAUDI ARABIA METHYL MYRISTATE IN EMOLLIENT ESTERS MARKET, BY GRADE, 2018-2032 (USD)
TABLE 162 SAUDI ARABIA METHYL PALMITATE IN EMOLLIENT ESTERS MARKET, BY GRADE, 2018-2032 (USD)
TABLE 163 SAUDI ARABIA METHYL LAURATE IN EMOLLIENT ESTERS MARKET, BY GRADE, 2018-2032 (USD)
TABLE 164 SAUDI ARABIA MYRISTYL MYRISTATE IN EMOLLIENT ESTERS MARKET, BY GRADE, 2018-2032 (USD)
TABLE 165 SAUDI ARABIA CAPRYLIC / CAPRIC TRIGLYCERIDE IN EMOLLIENT ESTERS MARKET, BY GRADE, 2018-2032 (USD)
TABLE 166 SAUDI ARABIA OCTYL MYRISTATE IN EMOLLIENT ESTERS MARKET, BY GRADE, 2018-2032 (USD)
TABLE 167 SAUDI ARABIA OCTYL PALMITATE IN EMOLLIENT ESTERS MARKET, BY GRADE, 2018-2032 (USD)
TABLE 168 SAUDI ARABIA OTHER IN EMOLLIENT ESTERS MARKET, BY GRADE, 2018-2032 (USD)
TABLE 169 SAUDI ARABIA EMOLLIENT ESTERS MARKET, BY PURITY, 2018-2032 (USD)
TABLE 170 SAUDI ARABIA EMOLLIENT ESTERS MARKET, BY PURITY, 2018-2032 (TONS)
TABLE 171 SAUDI ARABIA EMOLLIENT ESTERS MARKET, BY FORM, 2018-2032 (USD)
TABLE 172 SAUDI ARABIA EMOLLIENT ESTERS MARKET, BY FORM, 2018-2032 (TONS)
TABLE 173 SAUDI ARABIA LIQUID IN EMOLLIENT ESTERS MARKET, BY FORM, 2018-2032 (USD)
TABLE 174 SAUDI ARABIA DRY IN EMOLLIENT ESTERS MARKET, BY FORM, 2018-2032 (USD)
TABLE 175 SAUDI ARABIA EMOLLIENT ESTERS MARKET, BY APPLICATION, 2018-2032 (USD)
TABLE 176 SAUDI ARABIA EMOLLIENT ESTERS MARKET, BY APPLICATION, 2018-2032 (TONS)
TABLE 177 SAUDI ARABIA COSMETICS AND PERSONAL CARE IN EMOLLIENT ESTERS MARKET, BY APPLICATION, 2018-2032 (USD)
TABLE 178 SAUDI ARABIA COSMETICS AND PERSONAL CARE IN EMOLLIENT ESTERS MARKET, BY APPLICATION, 2018-2032 (TONS)
TABLE 179 SAUDI ARABIA COSMETICS AND PERSONAL CARE IN EMOLLIENT ESTERS MARKET, BY PRODUCT, 2018-2032 (USD)
TABLE 180 SAUDI ARABIA COSMETICS AND PERSONAL CARE IN EMOLLIENT ESTERS MARKET, BY PRODUCT, 2018-2032 (TONS)
TABLE 181 SAUDI ARABIA HAIR CARE PRODUCTS IN EMOLLIENT ESTERS MARKET, BY APPLICATION, 2018-2032 (USD)
TABLE 182 SAUDI ARABIA HAIR CARE PRODUCTS IN EMOLLIENT ESTERS MARKET, BY APPLICATION, 2018-2032 (TONS)
TABLE 183 SAUDI ARABIA HAIR CARE PRODUCTS IN EMOLLIENT ESTERS MARKET, BY PRODUCT, 2018-2032 (USD)
TABLE 184 SAUDI ARABIA HAIR CARE PRODUCTS IN EMOLLIENT ESTERS MARKET, BY PRODUCT, 2018-2032 (TONS)
TABLE 185 SAUDI ARABIA PHARMACEUTICALS IN EMOLLIENT ESTERS MARKET, BY APPLICATION, 2018-2032 (USD)
TABLE 186 SAUDI ARABIA PHARMACEUTICALS IN EMOLLIENT ESTERS MARKET, BY APPLICATION, 2018-2032 (TONS)
TABLE 187 SAUDI ARABIA PHARMACEUTICALS IN EMOLLIENT ESTERS MARKET, BY PRODUCT, 2018-2032 (USD)
TABLE 188 SAUDI ARABIA PHARMACEUTICALS IN EMOLLIENT ESTERS MARKET, BY PRODUCT, 2018-2032 (TONS)
TABLE 189 SAUDI ARABIA FOOD INDUSTRY IN EMOLLIENT ESTERS MARKET, BY APPLICATION, 2018-2032 (USD)
TABLE 190 SAUDI ARABIA FOOD INDUSTRY IN EMOLLIENT ESTERS MARKET, BY APPLICATION, 2018-2032 (USD)
TABLE 191 SAUDI ARABIA FOOD INDUSTRY IN EMOLLIENT ESTERS MARKET, BY PRODUCT, 2018-2032 (USD)
TABLE 192 SAUDI ARABIA FOOD INDUSTRY IN EMOLLIENT ESTERS MARKET, BY PRODUCT, 2018-2032 (TONS)
TABLE 193 SAUDI ARABIA OTHERS IN EMOLLIENT ESTERS MARKET, BY PRODUCT, 2018-2032 (USD)
TABLE 194 SAUDI ARABIA OTHERS IN EMOLLIENT ESTERS MARKET, BY PRODUCT, 2018-2032 (TONS)
TABLE 195 U.A.E. EMOLLIENT ESTERS MARKET, BY PRODUCT, 2018-2032 (USD)
TABLE 196 U.A.E. EMOLLIENT ESTERS MARKET, BY PRODUCT, 2018-2032 (TONS)
TABLE 197 U.A.E. ISOPROPYL MYRISTATE IN EMOLLIENT ESTERS MARKET, BY GRADE, 2018-2032 (USD)
TABLE 198 U.A.E. ISOPROPYL PALMITATE IN EMOLLIENT ESTERS MARKET, BY GRADE, 2018-2032 (USD)
TABLE 199 U.A.E. METHYL MYRISTATE IN EMOLLIENT ESTERS MARKET, BY GRADE, 2018-2032 (USD)
TABLE 200 U.A.E. METHYL PALMITATE IN EMOLLIENT ESTERS MARKET, BY GRADE, 2018-2032 (USD)
TABLE 201 U.A.E. METHYL LAURATE IN EMOLLIENT ESTERS MARKET, BY GRADE, 2018-2032 (USD)
TABLE 202 U.A.E. MYRISTYL MYRISTATE IN EMOLLIENT ESTERS MARKET, BY GRADE, 2018-2032 (USD)
TABLE 203 U.A.E. CAPRYLIC / CAPRIC TRIGLYCERIDE IN EMOLLIENT ESTERS MARKET, BY GRADE, 2018-2032 (USD)
TABLE 204 U.A.E. OCTYL MYRISTATE IN EMOLLIENT ESTERS MARKET, BY GRADE, 2018-2032 (USD)
TABLE 205 U.A.E. OCTYL PALMITATE IN EMOLLIENT ESTERS MARKET, BY GRADE, 2018-2032 (USD)
TABLE 206 U.A.E. OTHER IN EMOLLIENT ESTERS MARKET, BY GRADE, 2018-2032 (USD)
TABLE 207 U.A.E. EMOLLIENT ESTERS MARKET, BY PURITY, 2018-2032 (USD)
TABLE 208 U.A.E. EMOLLIENT ESTERS MARKET, BY PURITY, 2018-2032 (TONS)
TABLE 209 U.A.E. EMOLLIENT ESTERS MARKET, BY FORM, 2018-2032 (USD)
TABLE 210 U.A.E. EMOLLIENT ESTERS MARKET, BY FORM, 2018-2032 (TONS)
TABLE 211 UAE LIQUID IN EMOLLIENT ESTERS MARKET, BY FORM, 2018-2032 (USD)
TABLE 212 UAE DRY IN EMOLLIENT ESTERS MARKET, BY FORM, 2018-2032 (USD)
TABLE 213 U.A.E. EMOLLIENT ESTERS MARKET, BY APPLICATION, 2018-2032 (USD)
TABLE 214 U.A.E. EMOLLIENT ESTERS MARKET, BY APPLICATION, 2018-2032 (TONS)
TABLE 215 U.A.E. COSMETICS AND PERSONAL CARE IN EMOLLIENT ESTERS MARKET, BY APPLICATION, 2018-2032 (USD)
TABLE 216 U.A.E. COSMETICS AND PERSONAL CARE IN EMOLLIENT ESTERS MARKET, BY APPLICATION, 2018-2032 (TONS)
TABLE 217 U.A.E. COSMETICS AND PERSONAL CARE IN EMOLLIENT ESTERS MARKET, BY PRODUCT, 2018-2032 (USD)
TABLE 218 U.A.E. COSMETICS AND PERSONAL CARE IN EMOLLIENT ESTERS MARKET, BY PRODUCT, 2018-2032 (TONS)
TABLE 219 U.A.E. HAIR CARE PRODUCTS IN EMOLLIENT ESTERS MARKET, BY APPLICATION, 2018-2032 (USD)
TABLE 220 U.A.E. HAIR CARE PRODUCTS IN EMOLLIENT ESTERS MARKET, BY APPLICATION, 2018-2032 (TONS)
TABLE 221 U.A.E. HAIR CARE PRODUCTS IN EMOLLIENT ESTERS MARKET, BY PRODUCT, 2018-2032 (USD)
TABLE 222 U.A.E. HAIR CARE PRODUCTS IN EMOLLIENT ESTERS MARKET, BY PRODUCT, 2018-2032 (TONS)
TABLE 223 U.A.E. PHARMACEUTICALS IN EMOLLIENT ESTERS MARKET, BY APPLICATION, 2018-2032 (USD)
TABLE 224 U.A.E. PHARMACEUTICALS IN EMOLLIENT ESTERS MARKET, BY APPLICATION, 2018-2032 (TONS)
TABLE 225 U.A.E. PHARMACEUTICALS IN EMOLLIENT ESTERS MARKET, BY PRODUCT, 2018-2032 (USD)
TABLE 226 U.A.E. PHARMACEUTICALS IN EMOLLIENT ESTERS MARKET, BY PRODUCT, 2018-2032 (TONS)
TABLE 227 U.A.E FOOD INDUSTRY IN EMOLLIENT ESTERS MARKET, BY APPLICATION, 2018-2032 (USD)
TABLE 228 U.A.E FOOD INDUSTRY IN EMOLLIENT ESTERS MARKET, BY APPLICATION, 2018-2032 (USD)
TABLE 229 U.A.E. FOOD INDUSTRY IN EMOLLIENT ESTERS MARKET, BY PRODUCT, 2018-2032 (USD)
TABLE 230 U.A.E. FOOD INDUSTRY IN EMOLLIENT ESTERS MARKET, BY PRODUCT, 2018-2032 (TONS)
TABLE 231 U.A.E. OTHERS IN EMOLLIENT ESTERS MARKET, BY PRODUCT, 2018-2032 (USD)
TABLE 232 U.A.E. OTHERS IN EMOLLIENT ESTERS MARKET, BY PRODUCT, 2018-2032 (TONS)
TABLE 233 QATAR EMOLLIENT ESTERS MARKET, BY PRODUCT, 2018-2032 (USD)
TABLE 234 QATAR EMOLLIENT ESTERS MARKET, BY PRODUCT, 2018-2032 (TONS)
TABLE 235 QATAR ISOPROPYL MYRISTATE IN EMOLLIENT ESTERS MARKET, BY GRADE, 2018-2032 (USD)
TABLE 236 QATAR ISOPROPYL PALMITATE IN EMOLLIENT ESTERS MARKET, BY GRADE, 2018-2032 (USD)
TABLE 237 QATAR METHYL MYRISTATE IN EMOLLIENT ESTERS MARKET, BY GRADE, 2018-2032 (USD)
TABLE 238 QATAR METHYL PALMITATE IN EMOLLIENT ESTERS MARKET, BY GRADE, 2018-2032 (USD)
TABLE 239 QATAR METHYL LAURATE IN EMOLLIENT ESTERS MARKET, BY GRADE, 2018-2032 (USD)
TABLE 240 QATAR MYRISTYL MYRISTATE IN EMOLLIENT ESTERS MARKET, BY GRADE, 2018-2032 (USD)
TABLE 241 QATAR CAPRYLIC / CAPRIC TRIGLYCERIDE IN EMOLLIENT ESTERS MARKET, BY GRADE, 2018-2032 (USD)
TABLE 242 QATAR OCTYL MYRISTATE IN EMOLLIENT ESTERS MARKET, BY GRADE, 2018-2032 (USD)
TABLE 243 QATAR OCTYL PALMITATE IN EMOLLIENT ESTERS MARKET, BY GRADE, 2018-2032 (USD)
TABLE 244 QATAR OTHER IN EMOLLIENT ESTERS MARKET, BY GRADE, 2018-2032 (USD)
TABLE 245 QATAR EMOLLIENT ESTERS MARKET, BY PURITY, 2018-2032 (USD)
TABLE 246 QATAR EMOLLIENT ESTERS MARKET, BY PURITY, 2018-2032 (TONS)
TABLE 247 QATAR EMOLLIENT ESTERS MARKET, BY FORM, 2018-2032 (USD)
TABLE 248 QATAR EMOLLIENT ESTERS MARKET, BY FORM, 2018-2032 (TONS)
TABLE 249 EGYPT EMOLLIENT ESTERS MARKET, BY PRODUCT, 2018-2032 (USD)
TABLE 250 EGYPT EMOLLIENT ESTERS MARKET, BY PRODUCT, 2018-2032 (TONS)
TABLE 251 EGYPT ISOPROPYL MYRISTATE IN EMOLLIENT ESTERS MARKET, BY GRADE, 2018-2032 (USD)
TABLE 252 EGYPT ISOPROPYL PALMITATE IN EMOLLIENT ESTERS MARKET, BY GRADE, 2018-2032 (USD)
TABLE 253 EGYPT METHYL MYRISTATE IN EMOLLIENT ESTERS MARKET, BY GRADE, 2018-2032 (USD)
TABLE 254 EGYPT METHYL PALMITATE IN EMOLLIENT ESTERS MARKET, BY GRADE, 2018-2032 (USD)
TABLE 255 EGYPT METHYL LAURATE IN EMOLLIENT ESTERS MARKET, BY GRADE, 2018-2032 (USD)
TABLE 256 EGYPT MYRISTYL MYRISTATE IN EMOLLIENT ESTERS MARKET, BY GRADE, 2018-2032 (USD)
TABLE 257 EGYPT CAPRYLIC / CAPRIC TRIGLYCERIDE IN EMOLLIENT ESTERS MARKET, BY GRADE, 2018-2032 (USD)
TABLE 258 EGYPT OCTYL MYRISTATE IN EMOLLIENT ESTERS MARKET, BY GRADE, 2018-2032 (USD)
TABLE 259 EGYPT OCTYL PALMITATE IN EMOLLIENT ESTERS MARKET, BY GRADE, 2018-2032 (USD)
TABLE 260 EGYPT OTHER IN EMOLLIENT ESTERS MARKET, BY GRADE, 2018-2032 (USD)
TABLE 261 EGYPT EMOLLIENT ESTERS MARKET, BY PURITY, 2018-2032 (USD)
TABLE 262 EGYPT EMOLLIENT ESTERS MARKET, BY PURITY, 2018-2032 (TONS)
TABLE 263 EGYPT EMOLLIENT ESTERS MARKET, BY FORM, 2018-2032 (USD)
TABLE 264 EGYPT EMOLLIENT ESTERS MARKET, BY FORM, 2018-2032 (TONS)
TABLE 265 EGYPT LIQUID IN EMOLLIENT ESTERS MARKET, BY FORM, 2018-2032 (USD)
TABLE 266 EGYPT DRY IN EMOLLIENT ESTERS MARKET, BY FORM, 2018-2032 (USD)
TABLE 267 EGYPT EMOLLIENT ESTERS MARKET, BY APPLICATION, 2018-2032 (USD)
TABLE 268 EGYPT EMOLLIENT ESTERS MARKET, BY APPLICATION, 2018-2032 (TONS)
TABLE 269 EGYPT COSMETICS AND PERSONAL CARE IN EMOLLIENT ESTERS MARKET, BY APPLICATION, 2018-2032 (USD)
TABLE 270 EGYPT COSMETICS AND PERSONAL CARE IN EMOLLIENT ESTERS MARKET, BY APPLICATION, 2018-2032 (TONS)
TABLE 271 EGYPT COSMETICS AND PERSONAL CARE IN EMOLLIENT ESTERS MARKET, BY PRODUCT, 2018-2032 (USD)
TABLE 272 EGYPT COSMETICS AND PERSONAL CARE IN EMOLLIENT ESTERS MARKET, BY PRODUCT, 2018-2032 (TONS)
TABLE 273 EGYPT HAIR CARE PRODUCTS IN EMOLLIENT ESTERS MARKET, BY APPLICATION, 2018-2032 (USD)
TABLE 274 EGYPT HAIR CARE PRODUCTS IN EMOLLIENT ESTERS MARKET, BY APPLICATION, 2018-2032 (TONS)
TABLE 275 EGYPT HAIR CARE PRODUCTS IN EMOLLIENT ESTERS MARKET, BY PRODUCT, 2018-2032 (USD)
TABLE 276 EGYPT HAIR CARE PRODUCTS IN EMOLLIENT ESTERS MARKET, BY PRODUCT, 2018-2032 (TONS)
TABLE 277 EGYPT PHARMACEUTICALS IN EMOLLIENT ESTERS MARKET, BY APPLICATION, 2018-2032 (USD)
TABLE 278 EGYPT PHARMACEUTICALS IN EMOLLIENT ESTERS MARKET, BY APPLICATION, 2018-2032 (TONS)
TABLE 279 EGYPT PHARMACEUTICALS IN EMOLLIENT ESTERS MARKET, BY PRODUCT, 2018-2032 (USD)
TABLE 280 EGYPT PHARMACEUTICALS IN EMOLLIENT ESTERS MARKET, BY PRODUCT, 2018-2032 (TONS)
TABLE 281 EGYPT FOOD INDUSTRY IN EMOLLIENT ESTERS MARKET, BY APPLICATION, 2018-2032 (USD)
TABLE 282 EGYPT FOOD INDUSTRY IN EMOLLIENT ESTERS MARKET, BY APPLICATION, 2018-2032 (USD)
TABLE 283 EGYPT FOOD INDUSTRY IN EMOLLIENT ESTERS MARKET, BY PRODUCT, 2018-2032 (USD)
TABLE 284 EGYPT FOOD INDUSTRY IN EMOLLIENT ESTERS MARKET, BY PRODUCT, 2018-2032 (TONS)
TABLE 285 EGYPT OTHERS IN EMOLLIENT ESTERS MARKET, BY PRODUCT, 2018-2032 (USD)
TABLE 286 EGYPT OTHERS IN EMOLLIENT ESTERS MARKET, BY PRODUCT, 2018-2032 (TONS)
TABLE 287 ISRAEL EMOLLIENT ESTERS MARKET, BY PRODUCT, 2018-2032 (USD)
TABLE 288 ISRAEL EMOLLIENT ESTERS MARKET, BY PRODUCT, 2018-2032 (TONS)
TABLE 289 ISRAEL ISOPROPYL MYRISTATE IN EMOLLIENT ESTERS MARKET, BY GRADE, 2018-2032 (USD)
TABLE 290 ISRAEL ISOPROPYL PALMITATE IN EMOLLIENT ESTERS MARKET, BY GRADE, 2018-2032 (USD)
TABLE 291 ISRAEL METHYL MYRISTATE IN EMOLLIENT ESTERS MARKET, BY GRADE, 2018-2032 (USD)
TABLE 292 ISRAEL METHYL PALMITATE IN EMOLLIENT ESTERS MARKET, BY GRADE, 2018-2032 (USD)
TABLE 293 ISRAEL METHYL LAURATE IN EMOLLIENT ESTERS MARKET, BY GRADE, 2018-2032 (USD)
TABLE 294 ISRAEL MYRISTYL MYRISTATE IN EMOLLIENT ESTERS MARKET, BY GRADE, 2018-2032 (USD)
TABLE 295 ISRAEL CAPRYLIC / CAPRIC TRIGLYCERIDE IN EMOLLIENT ESTERS MARKET, BY GRADE, 2018-2032 (USD)
TABLE 296 ISRAEL OCTYL MYRISTATE IN EMOLLIENT ESTERS MARKET, BY GRADE, 2018-2032 (USD)
TABLE 297 ISRAEL OCTYL PALMITATE IN EMOLLIENT ESTERS MARKET, BY GRADE, 2018-2032 (USD)
TABLE 298 ISRAEL OTHER IN EMOLLIENT ESTERS MARKET, BY GRADE, 2018-2032 (USD)
TABLE 299 ISRAEL EMOLLIENT ESTERS MARKET, BY PURITY, 2018-2032 (USD)
TABLE 300 ISRAEL EMOLLIENT ESTERS MARKET, BY PURITY, 2018-2032 (TONS)
TABLE 301 ISRAEL EMOLLIENT ESTERS MARKET, BY FORM, 2018-2032 (USD)
TABLE 302 ISRAEL EMOLLIENT ESTERS MARKET, BY FORM, 2018-2032 (TONS)
TABLE 303 ISRAEL LIQUID IN EMOLLIENT ESTERS MARKET, BY FORM, 2018-2032 (USD)
TABLE 304 ISRAEL DRY IN EMOLLIENT ESTERS MARKET, BY FORM, 2018-2032 (USD)
TABLE 305 ISRAEL EMOLLIENT ESTERS MARKET, BY APPLICATION, 2018-2032 (USD)
TABLE 306 ISRAEL EMOLLIENT ESTERS MARKET, BY APPLICATION, 2018-2032 (TONS)
TABLE 307 ISRAEL COSMETICS AND PERSONAL CARE IN EMOLLIENT ESTERS MARKET, BY APPLICATION, 2018-2032 (USD)
TABLE 308 ISRAEL COSMETICS AND PERSONAL CARE IN EMOLLIENT ESTERS MARKET, BY APPLICATION, 2018-2032 (TONS)
TABLE 309 ISRAEL COSMETICS AND PERSONAL CARE IN EMOLLIENT ESTERS MARKET, BY PRODUCT, 2018-2032 (USD)
TABLE 310 ISRAEL COSMETICS AND PERSONAL CARE IN EMOLLIENT ESTERS MARKET, BY PRODUCT, 2018-2032 (TONS)
TABLE 311 ISRAEL HAIR CARE PRODUCTS IN EMOLLIENT ESTERS MARKET, BY APPLICATION, 2018-2032 (USD)
TABLE 312 ISRAEL HAIR CARE PRODUCTS IN EMOLLIENT ESTERS MARKET, BY APPLICATION, 2018-2032 (TONS)
TABLE 313 ISRAEL HAIR CARE PRODUCTS IN EMOLLIENT ESTERS MARKET, BY PRODUCT, 2018-2032 (USD)
TABLE 314 ISRAEL HAIR CARE PRODUCTS IN EMOLLIENT ESTERS MARKET, BY PRODUCT, 2018-2032 (TONS)
TABLE 315 ISRAEL PHARMACEUTICALS IN EMOLLIENT ESTERS MARKET, BY APPLICATION, 2018-2032 (USD)
TABLE 316 ISRAEL PHARMACEUTICALS IN EMOLLIENT ESTERS MARKET, BY APPLICATION, 2018-2032 (TONS)
TABLE 317 ISRAEL PHARMACEUTICALS IN EMOLLIENT ESTERS MARKET, BY PRODUCT, 2018-2032 (USD)
TABLE 318 ISRAEL PHARMACEUTICALS IN EMOLLIENT ESTERS MARKET, BY PRODUCT, 2018-2032 (TONS)
TABLE 319 ISRAEL FOOD INDUSTRY IN EMOLLIENT ESTERS MARKET, BY APPLICATION, 2018-2032 (USD)
TABLE 320 ISRAEL FOOD INDUSTRY IN EMOLLIENT ESTERS MARKET, BY APPLICATION, 2018-2032 (USD)
TABLE 321 ISRAEL FOOD INDUSTRY IN EMOLLIENT ESTERS MARKET, BY PRODUCT, 2018-2032 (USD)
TABLE 322 ISRAEL FOOD INDUSTRY IN EMOLLIENT ESTERS MARKET, BY PRODUCT, 2018-2032 (TONS)
TABLE 323 ISRAEL OTHERS IN EMOLLIENT ESTERS MARKET, BY PRODUCT, 2018-2032 (USD)
TABLE 324 ISRAEL OTHERS IN EMOLLIENT ESTERS MARKET, BY PRODUCT, 2018-2032 (TONS)
TABLE 325 KUWAIT EMOLLIENT ESTERS MARKET, BY PRODUCT, 2018-2032 (USD)
TABLE 326 KUWAIT EMOLLIENT ESTERS MARKET, BY PRODUCT, 2018-2032 (TONS)
TABLE 327 KUWAIT ISOPROPYL MYRISTATE IN EMOLLIENT ESTERS MARKET, BY GRADE, 2018-2032 (USD)
TABLE 328 KUWAIT ISOPROPYL PALMITATE IN EMOLLIENT ESTERS MARKET, BY GRADE, 2018-2032 (USD)
TABLE 329 KUWAIT METHYL MYRISTATE IN EMOLLIENT ESTERS MARKET, BY GRADE, 2018-2032 (USD)
TABLE 330 KUWAIT METHYL PALMITATE IN EMOLLIENT ESTERS MARKET, BY GRADE, 2018-2032 (USD)
TABLE 331 KUWAIT METHYL LAURATE IN EMOLLIENT ESTERS MARKET, BY GRADE, 2018-2032 (USD)
TABLE 332 KUWAIT MYRISTYL MYRISTATE IN EMOLLIENT ESTERS MARKET, BY GRADE, 2018-2032 (USD)
TABLE 333 KUWAIT CAPRYLIC / CAPRIC TRIGLYCERIDE IN EMOLLIENT ESTERS MARKET, BY GRADE, 2018-2032 (USD)
TABLE 334 KUWAIT OCTYL MYRISTATE IN EMOLLIENT ESTERS MARKET, BY GRADE, 2018-2032 (USD)
TABLE 335 KUWAIT OCTYL PALMITATE IN EMOLLIENT ESTERS MARKET, BY GRADE, 2018-2032 (USD)
TABLE 336 KUWAIT OTHER IN EMOLLIENT ESTERS MARKET, BY GRADE, 2018-2032 (USD)
TABLE 337 KUWAIT EMOLLIENT ESTERS MARKET, BY PURITY, 2018-2032 (USD)
TABLE 338 KUWAIT EMOLLIENT ESTERS MARKET, BY PURITY, 2018-2032 (TONS)
TABLE 339 KUWAIT EMOLLIENT ESTERS MARKET, BY FORM, 2018-2032 (USD)
TABLE 340 KUWAIT EMOLLIENT ESTERS MARKET, BY FORM, 2018-2032 (TONS)
TABLE 341 KUWAIT LIQUID IN EMOLLIENT ESTERS MARKET, BY FORM, 2018-2032 (USD)
TABLE 342 KUWAIT DRY IN EMOLLIENT ESTERS MARKET, BY FORM, 2018-2032 (USD)
TABLE 343 KUWAIT EMOLLIENT ESTERS MARKET, BY APPLICATION, 2018-2032 (USD)
TABLE 344 KUWAIT EMOLLIENT ESTERS MARKET, BY APPLICATION, 2018-2032 (TONS)
TABLE 345 KUWAIT COSMETICS AND PERSONAL CARE IN EMOLLIENT ESTERS MARKET, BY APPLICATION, 2018-2032 (USD)
TABLE 346 KUWAIT COSMETICS AND PERSONAL CARE IN EMOLLIENT ESTERS MARKET, BY APPLICATION, 2018-2032 (TONS)
TABLE 347 KUWAIT COSMETICS AND PERSONAL CARE IN EMOLLIENT ESTERS MARKET, BY PRODUCT, 2018-2032 (USD)
TABLE 348 KUWAIT COSMETICS AND PERSONAL CARE IN EMOLLIENT ESTERS MARKET, BY PRODUCT, 2018-2032 (TONS)
TABLE 349 KUWAIT HAIR CARE PRODUCTS IN EMOLLIENT ESTERS MARKET, BY APPLICATION, 2018-2032 (USD)
TABLE 350 KUWAIT HAIR CARE PRODUCTS IN EMOLLIENT ESTERS MARKET, BY APPLICATION, 2018-2032 (TONS)
TABLE 351 KUWAIT HAIR CARE PRODUCTS IN EMOLLIENT ESTERS MARKET, BY PRODUCT, 2018-2032 (USD)
TABLE 352 KUWAIT HAIR CARE PRODUCTS IN EMOLLIENT ESTERS MARKET, BY PRODUCT, 2018-2032 (TONS)
TABLE 353 KUWAIT PHARMACEUTICALS IN EMOLLIENT ESTERS MARKET, BY APPLICATION, 2018-2032 (USD)
TABLE 354 KUWAIT PHARMACEUTICALS IN EMOLLIENT ESTERS MARKET, BY APPLICATION, 2018-2032 (TONS)
TABLE 355 KUWAIT PHARMACEUTICALS IN EMOLLIENT ESTERS MARKET, BY PRODUCT, 2018-2032 (USD)
TABLE 356 KUWAIT PHARMACEUTICALS IN EMOLLIENT ESTERS MARKET, BY PRODUCT, 2018-2032 (TONS)
TABLE 357 KUWAIT FOOD INDUSTRY IN EMOLLIENT ESTERS MARKET, BY APPLICATION, 2018-2032 (USD)
TABLE 358 KUWAIT FOOD INDUSTRY IN EMOLLIENT ESTERS MARKET, BY APPLICATION, 2018-2032 (USD)
TABLE 359 KUWAIT FOOD INDUSTRY IN EMOLLIENT ESTERS MARKET, BY PRODUCT, 2018-2032 (USD)
TABLE 360 KUWAIT FOOD INDUSTRY IN EMOLLIENT ESTERS MARKET, BY PRODUCT, 2018-2032 (TONS)
TABLE 361 KUWAIT OTHERS IN EMOLLIENT ESTERS MARKET, BY PRODUCT, 2018-2032 (USD)
TABLE 362 KUWAIT OTHERS IN EMOLLIENT ESTERS MARKET, BY PRODUCT, 2018-2032 (TONS)
TABLE 363 OMAN EMOLLIENT ESTERS MARKET, BY PRODUCT, 2018-2032 (USD)
TABLE 364 OMAN EMOLLIENT ESTERS MARKET, BY PRODUCT, 2018-2032 (TONS)
TABLE 365 OMAN ISOPROPYL MYRISTATE IN EMOLLIENT ESTERS MARKET, BY GRADE, 2018-2032 (USD)
TABLE 366 OMAN ISOPROPYL PALMITATE IN EMOLLIENT ESTERS MARKET, BY GRADE, 2018-2032 (USD)
TABLE 367 OMAN METHYL MYRISTATE IN EMOLLIENT ESTERS MARKET, BY GRADE, 2018-2032 (USD)
TABLE 368 OMAN METHYL PALMITATE IN EMOLLIENT ESTERS MARKET, BY GRADE, 2018-2032 (USD)
TABLE 369 OMAN METHYL LAURATE IN EMOLLIENT ESTERS MARKET, BY GRADE, 2018-2032 (USD)
TABLE 370 OMAN MYRISTYL MYRISTATE IN EMOLLIENT ESTERS MARKET, BY GRADE, 2018-2032 (USD)
TABLE 371 OMAN CAPRYLIC / CAPRIC TRIGLYCERIDE IN EMOLLIENT ESTERS MARKET, BY GRADE, 2018-2032 (USD)
TABLE 372 OMAN OCTYL MYRISTATE IN EMOLLIENT ESTERS MARKET, BY GRADE, 2018-2032 (USD)
TABLE 373 OMAN OCTYL PALMITATE IN EMOLLIENT ESTERS MARKET, BY GRADE, 2018-2032 (USD)
TABLE 374 OMAN OTHER IN EMOLLIENT ESTERS MARKET, BY GRADE, 2018-2032 (USD)
TABLE 375 OMAN EMOLLIENT ESTERS MARKET, BY PURITY, 2018-2032 (USD)
TABLE 376 OMAN EMOLLIENT ESTERS MARKET, BY PURITY, 2018-2032 (TONS)
TABLE 377 OMAN EMOLLIENT ESTERS MARKET, BY FORM, 2018-2032 (USD)
TABLE 378 OMAN EMOLLIENT ESTERS MARKET, BY FORM, 2018-2032 (TONS)
TABLE 379 OMAN LIQUID IN EMOLLIENT ESTERS MARKET, BY FORM, 2018-2032 (USD)
TABLE 380 OMAN DRY IN EMOLLIENT ESTERS MARKET, BY FORM, 2018-2032 (USD)
TABLE 381 OMAN EMOLLIENT ESTERS MARKET, BY APPLICATION, 2018-2032 (USD)
TABLE 382 OMAN EMOLLIENT ESTERS MARKET, BY APPLICATION, 2018-2032 (TONS)
TABLE 383 OMAN COSMETICS AND PERSONAL CARE IN EMOLLIENT ESTERS MARKET, BY APPLICATION, 2018-2032 (USD)
TABLE 384 OMAN COSMETICS AND PERSONAL CARE IN EMOLLIENT ESTERS MARKET, BY APPLICATION, 2018-2032 (TONS)
TABLE 385 OMAN COSMETICS AND PERSONAL CARE IN EMOLLIENT ESTERS MARKET, BY PRODUCT, 2018-2032 (USD)
TABLE 386 OMAN COSMETICS AND PERSONAL CARE IN EMOLLIENT ESTERS MARKET, BY PRODUCT, 2018-2032 (TONS)
TABLE 387 OMAN HAIR CARE PRODUCTS IN EMOLLIENT ESTERS MARKET, BY APPLICATION, 2018-2032 (USD)
TABLE 388 OMAN HAIR CARE PRODUCTS IN EMOLLIENT ESTERS MARKET, BY APPLICATION, 2018-2032 (TONS)
TABLE 389 OMAN HAIR CARE PRODUCTS IN EMOLLIENT ESTERS MARKET, BY PRODUCT, 2018-2032 (USD)
TABLE 390 OMAN HAIR CARE PRODUCTS IN EMOLLIENT ESTERS MARKET, BY PRODUCT, 2018-2032 (TONS)
TABLE 391 OMAN PHARMACEUTICALS IN EMOLLIENT ESTERS MARKET, BY APPLICATION, 2018-2032 (USD)
TABLE 392 OMAN PHARMACEUTICALS IN EMOLLIENT ESTERS MARKET, BY APPLICATION, 2018-2032 (TONS)
TABLE 393 OMAN PHARMACEUTICALS IN EMOLLIENT ESTERS MARKET, BY PRODUCT, 2018-2032 (USD)
TABLE 394 OMAN PHARMACEUTICALS IN EMOLLIENT ESTERS MARKET, BY PRODUCT, 2018-2032 (TONS)
TABLE 395 OMAN FOOD INDUSTRY IN EMOLLIENT ESTERS MARKET, BY APPLICATION, 2018-2032 (USD)
TABLE 396 OMAN FOOD INDUSTRY IN EMOLLIENT ESTERS MARKET, BY APPLICATION, 2018-2032 (USD)
TABLE 397 OMAN FOOD INDUSTRY IN EMOLLIENT ESTERS MARKET, BY PRODUCT, 2018-2032 (USD)
TABLE 398 OMAN FOOD INDUSTRY IN EMOLLIENT ESTERS MARKET, BY PRODUCT, 2018-2032 (TONS)
TABLE 399 OMAN OTHERS IN EMOLLIENT ESTERS MARKET, BY PRODUCT, 2018-2032 (USD)
TABLE 400 OMAN OTHERS IN EMOLLIENT ESTERS MARKET, BY PRODUCT, 2018-2032 (TONS)
TABLE 401 BAHRAIN EMOLLIENT ESTERS MARKET, BY PRODUCT, 2018-2032 (USD)
TABLE 402 BAHRAIN EMOLLIENT ESTERS MARKET, BY PRODUCT, 2018-2032 (TONS)
TABLE 403 BAHRAIN ISOPROPYL MYRISTATE IN EMOLLIENT ESTERS MARKET, BY GRADE, 2018-2032 (USD)
TABLE 404 BAHRAIN ISOPROPYL PALMITATE IN EMOLLIENT ESTERS MARKET, BY GRADE, 2018-2032 (USD)
TABLE 405 BAHRAIN METHYL MYRISTATE IN EMOLLIENT ESTERS MARKET, BY GRADE, 2018-2032 (USD)
TABLE 406 BAHRAIN METHYL PALMITATE IN EMOLLIENT ESTERS MARKET, BY GRADE, 2018-2032 (USD)
TABLE 407 BAHRAIN METHYL LAURATE IN EMOLLIENT ESTERS MARKET, BY GRADE, 2018-2032 (USD)
TABLE 408 BAHRAIN MYRISTYL MYRISTATE IN EMOLLIENT ESTERS MARKET, BY GRADE, 2018-2032 (USD)
TABLE 409 BAHRAIN CAPRYLIC / CAPRIC TRIGLYCERIDE IN EMOLLIENT ESTERS MARKET, BY GRADE, 2018-2032 (USD)
TABLE 410 BAHRAIN OCTYL MYRISTATE IN EMOLLIENT ESTERS MARKET, BY GRADE, 2018-2032 (USD)
TABLE 411 BAHRAIN OCTYL PALMITATE IN EMOLLIENT ESTERS MARKET, BY GRADE, 2018-2032 (USD)
TABLE 412 BAHRAIN OTHER IN EMOLLIENT ESTERS MARKET, BY GRADE, 2018-2032 (USD)
TABLE 413 BAHRAIN EMOLLIENT ESTERS MARKET, BY PURITY, 2018-2032 (USD)
TABLE 414 BAHRAIN EMOLLIENT ESTERS MARKET, BY PURITY, 2018-2032 (TONS)
TABLE 415 BAHRAIN EMOLLIENT ESTERS MARKET, BY FORM, 2018-2032 (USD)
TABLE 416 BAHRAIN EMOLLIENT ESTERS MARKET, BY FORM, 2018-2032 (TONS)
TABLE 417 BAHRAIN LIQUID IN EMOLLIENT ESTERS MARKET, BY FORM, 2018-2032 (USD)
TABLE 418 BAHRAIN DRY IN EMOLLIENT ESTERS MARKET, BY FORM, 2018-2032 (USD)
TABLE 419 BAHRAIN EMOLLIENT ESTERS MARKET, BY APPLICATION, 2018-2032 (USD)
TABLE 420 BAHRAIN EMOLLIENT ESTERS MARKET, BY APPLICATION, 2018-2032 (TONS)
TABLE 421 BAHRAIN COSMETICS AND PERSONAL CARE IN EMOLLIENT ESTERS MARKET, BY APPLICATION, 2018-2032 (USD)
TABLE 422 BAHRAIN COSMETICS AND PERSONAL CARE IN EMOLLIENT ESTERS MARKET, BY APPLICATION, 2018-2032 (TONS)
TABLE 423 BAHRAIN COSMETICS AND PERSONAL CARE IN EMOLLIENT ESTERS MARKET, BY PRODUCT, 2018-2032 (USD)
TABLE 424 BAHRAIN COSMETICS AND PERSONAL CARE IN EMOLLIENT ESTERS MARKET, BY PRODUCT, 2018-2032 (TONS)
TABLE 425 BAHRAIN HAIR CARE PRODUCTS IN EMOLLIENT ESTERS MARKET, BY APPLICATION, 2018-2032 (USD)
TABLE 426 BAHRAIN HAIR CARE PRODUCTS IN EMOLLIENT ESTERS MARKET, BY APPLICATION, 2018-2032 (TONS)
TABLE 427 BAHRAIN HAIR CARE PRODUCTS IN EMOLLIENT ESTERS MARKET, BY PRODUCT, 2018-2032 (USD)
TABLE 428 BAHRAIN HAIR CARE PRODUCTS IN EMOLLIENT ESTERS MARKET, BY PRODUCT, 2018-2032 (TONS)
TABLE 429 BAHRAIN PHARMACEUTICALS IN EMOLLIENT ESTERS MARKET, BY APPLICATION, 2018-2032 (USD)
TABLE 430 BAHRAIN PHARMACEUTICALS IN EMOLLIENT ESTERS MARKET, BY APPLICATION, 2018-2032 (TONS)
TABLE 431 BAHRAIN PHARMACEUTICALS IN EMOLLIENT ESTERS MARKET, BY PRODUCT, 2018-2032 (USD)
TABLE 432 BAHRAIN PHARMACEUTICALS IN EMOLLIENT ESTERS MARKET, BY PRODUCT, 2018-2032 (TONS)
TABLE 433 BAHRAIN FOOD INDUSTRY IN EMOLLIENT ESTERS MARKET, BY APPLICATION, 2018-2032 (USD)
TABLE 434 BAHRAIN FOOD INDUSTRY IN EMOLLIENT ESTERS MARKET, BY APPLICATION, 2018-2032 (USD)
TABLE 435 BAHRAIN FOOD INDUSTRY IN EMOLLIENT ESTERS MARKET, BY PRODUCT, 2018-2032 (USD)
TABLE 436 BAHRAIN FOOD INDUSTRY IN EMOLLIENT ESTERS MARKET, BY PRODUCT, 2018-2032 (TONS)
TABLE 437 BAHRAIN OTHERS IN EMOLLIENT ESTERS MARKET, BY PRODUCT, 2018-2032 (USD)
TABLE 438 BAHRAIN OTHERS IN EMOLLIENT ESTERS MARKET, BY PRODUCT, 2018-2032 (TONS)
TABLE 439 REST OF MIDDLE EAST AND AFRICA EMOLLIENT ESTERS MARKET, BY PRODUCT, 2018-2032 (USD)
TABLE 440 REST OF MIDDLE EAST AND AFRICA EMOLLIENT ESTERS MARKET, BY PRODUCT, 2018-2032 (TONS)
List of Figure
FIGURE 1 MIDDLE EAST AND AFRICA EMOLLIENT ESTERS MARKET
FIGURE 2 MIDDLE EAST AND AFRICA EMOLLIENT ESTERS MARKET: DATA TRIANGULATION
FIGURE 3 MIDDLE EAST AND AFRICA EMOLLIENT ESTERS MARKET: DROC ANALYSIS
FIGURE 4 MIDDLE EAST AND AFRICA EMOLLIENT ESTERS MARKET: MIDDLE EAST AND AFRICA VS REGIONAL MARKET ANALYSIS
FIGURE 5 MIDDLE EAST AND AFRICA EMOLLIENT ESTERS MARKET: COMPANY RESEARCH ANALYSIS
FIGURE 6 MIDDLE EAST AND AFRICA EMOLLIENT ESTERS MARKET: MULTIVARIATE MODELLING
FIGURE 7 MIDDLE EAST AND AFRICA EMOLLIENT ESTERS MARKET: INTERVIEW DEMOGRAPHICS
FIGURE 8 MIDDLE EAST AND AFRICA EMOLLIENT ESTERS MARKET: DBMR MARKET POSITION GRID
FIGURE 9 MIDDLE EAST AND AFRICA EMOLLIENT ESTERS MARKET: VENDOR SHARE ANALYSIS
FIGURE 10 MIDDLE EAST AND AFRICA EMOLLIENT ESTERS MARKET: APPLICATION COVERAGE GRID
FIGURE 11 MIDDLE EAST AND AFRICA EMOLLIENT ESTERS MARKET: SEGMENTATION
FIGURE 12 TEN SEGMENTS COMPRISE THE MIDDLE EAST AND AFRICA EMOLLIENT ESTERS MARKET, BY PRODUCT
FIGURE 13 EXECUTIVE SUMMARY
FIGURE 14 STRATEGIC DECISIONS
FIGURE 15 RISING AWARENESS OF SUSTAINABLE MATERIALS IS EXPECTED TO DRIVE THE MIDDLE EAST AND AFRICA EMOLLIENT ESTERS MARKET IN THE FORECAST PERIOD
FIGURE 16 THE ISOPROPYL MYRISTATE SEGMENT IS EXPECTED TO ACCOUNT FOR THE LARGEST SHARE OF THE MIDDLE EAST AND AFRICA EMOLLIENT ESTERS MARKET IN 2025 AND 2032
FIGURE 17 PESTEL ANALYSIS
FIGURE 18 PORTER’S FIVE FORCES ANALYSIS
FIGURE 19 PRODUCTION CAPACITY FOR TOP MANUFACTURERS
FIGURE 20 PRODUCTION CONSUMPTION ANALYSIS
FIGURE 21 VALUE CHAIN ANALYSIS OF THE MIDDLE EAST AND AFRICA EMOLLIENT ESTERS MARKET
FIGURE 22 VENDOR SELECTION CRITERIA
FIGURE 23 DRIVERS, RESTRAINTS, OPPORTUNITIES, AND CHALLENGES OF THE MIDDLE EAST AND AFRICA EMOLLIENT ESTERS MARKET
FIGURE 24 MIDDLE EAST AND AFRICA EMOLLIENT ESTERS MARKET: BY PRODUCT, 2024
FIGURE 25 MIDDLE EAST AND AFRICA EMOLLIENT ESTERS MARKET: BY PURITY, 2024
FIGURE 26 MIDDLE EAST AND AFRICA EMOLLIENT ESTERS MARKET: BY FORM, 2024
FIGURE 27 MIDDLE EAST AND AFRICA EMOLLIENT ESTERS MARKET: BY APPLICATION, 2024
FIGURE 28 MIDDLE EAST AND AFRICA EMOLLIENT ESTERS MARKET: SNAPSHOT (2024)
FIGURE 29 MIDDLE EAST AND AFRICA EMOLLIENT ESTERS MARKET: COMPANY SHARE 2024 (%)
Middle East And Africa Emollient Esters Market, Supply Chain Analysis and Ecosystem Framework
To support market growth and help clients navigate the impact of geopolitical shifts, DBMR has integrated in-depth supply chain analysis into its Middle East And Africa Emollient Esters Market research reports. This addition empowers clients to respond effectively to global changes affecting their industries. The supply chain analysis section includes detailed insights such as Middle East And Africa Emollient Esters Market consumption and production by country, price trend analysis, the impact of tariffs and geopolitical developments, and import and export trends by country and HSN code. It also highlights major suppliers with data on production capacity and company profiles, as well as key importers and exporters. In addition to research, DBMR offers specialized supply chain consulting services backed by over a decade of experience, providing solutions like supplier discovery, supplier risk assessment, price trend analysis, impact evaluation of inflation and trade route changes, and comprehensive market trend analysis.
Data collection and base year analysis are done using data collection modules with large sample sizes. The stage includes obtaining market information or related data through various sources and strategies. It includes examining and planning all the data acquired from the past in advance. It likewise envelops the examination of information inconsistencies seen across different information sources. The market data is analysed and estimated using market statistical and coherent models. Also, market share analysis and key trend analysis are the major success factors in the market report. To know more, please request an analyst call or drop down your inquiry.
The key research methodology used by DBMR research team is data triangulation which involves data mining, analysis of the impact of data variables on the market and primary (industry expert) validation. Data models include Vendor Positioning Grid, Market Time Line Analysis, Market Overview and Guide, Company Positioning Grid, Patent Analysis, Pricing Analysis, Company Market Share Analysis, Standards of Measurement, Global versus Regional and Vendor Share Analysis. To know more about the research methodology, drop in an inquiry to speak to our industry experts.
Data Bridge Market Research is a leader in advanced formative research. We take pride in servicing our existing and new customers with data and analysis that match and suits their goal. The report can be customized to include price trend analysis of target brands understanding the market for additional countries (ask for the list of countries), clinical trial results data, literature review, refurbished market and product base analysis. Market analysis of target competitors can be analyzed from technology-based analysis to market portfolio strategies. We can add as many competitors that you require data about in the format and data style you are looking for. Our team of analysts can also provide you data in crude raw excel files pivot tables (Fact book) or can assist you in creating presentations from the data sets available in the report.


