
Middle East And Africa Food Bags Market
Market Size in USD Million
 USD
536.60 Million
USD
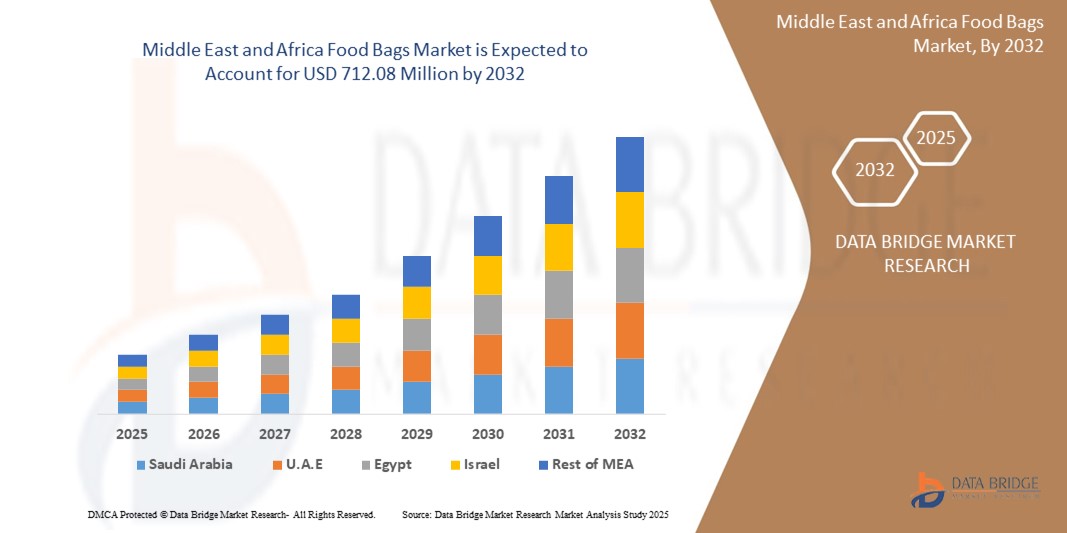
712.08 Million
2024
2032
USD
536.60 Million
USD
712.08 Million
2024
2032
| 2025 - 2032 | |
| USD 536.60 Million | |
| USD 712.08 Million | |
| % | |
|
What is the Middle East and Africa Food Bags Market Size and Growth Rate?
- The Middle East and Africa food bags market size was valued at USD 536.60 million in 2024 and is expected to reach USD 712.08 million by 2032, at a CAGR of 3.60% during the forecast period
- Growth is fueled by the expanding foodservice sector, increasing demand for takeaway and ready-to-eat meals, and the rising need for hygienic, single-use packaging in restaurants, cafés, and fast-food chains
- Moreover, the shift towards biodegradable and compostable materials, driven by sustainability trends and regulatory mandates, is encouraging innovation and widespread adoption of eco-conscious food bags across the region
What are the Major Takeaways of Food Bags Market?
- Food bags, such as paper pouches, vacuum-sealed bags, and insulated carriers, are now integral to retail, catering, and QSR environments, ensuring food safety, portability, and freshness
- The rise of food delivery services and growing consumer preference for lightweight, recyclable, and grease-resistant solutions are driving the demand for advanced packaging options
- In addition, government initiatives limiting plastic usage and growing consumer awareness regarding sustainable alternatives are spurring eco-innovations, making food bags a core component of Middle East and Africa’s evolving circular packaging economy
- Saudi Arabia dominated the Middle East and Africa food bags market in 2024, capturing the largest revenue share of 29.4%, owing to its expanding foodservice sector and strong investment in sustainable infrastructure
- South Africa is projected to grow at the fastest CAGR in the Middle East and Africa region through 2032, driven by increasing environmental awareness and regulatory pressure to reduce plastic waste
- The Standard Carry Bags segment dominated the market in 2024 with a market share of 28.7%, owing to their widespread use across supermarkets, takeaway outlets, and restaurants due to their convenience and affordability
Report Scope and Food Bags Market Segmentation
|
Attributes |
Food Bags Key Market Insights |
|
Segments Covered |
|
|
Countries Covered |
Middle East and Africa
|
|
Key Market Players |
|
|
Market Opportunities |
|
|
Value Added Data Infosets |
In addition to the insights on market scenarios such as market value, growth rate, segmentation, geographical coverage, and major players, the market reports curated by the Data Bridge Market Research also include in-depth expert analysis, pricing analysis, brand share analysis, consumer survey, demography analysis, supply chain analysis, value chain analysis, raw material/consumables overview, vendor selection criteria, PESTLE Analysis, Porter Analysis, and regulatory framework. |
What is the Key Trend in the Food Bags Market?
“Shift Toward Sustainable and Compostable Packaging Solutions”
- A key trend shaping the Middle East and Africa food bags market is the increasing shift toward eco-friendly and compostable packaging, driven by consumer demand and tightening regulations against single-use plastics
- Manufacturers are prioritizing biodegradable materials such as bagasse, PLA (polylactic acid), and molded fiber, which offer sustainable performance while meeting food safety standards.
- For instance, in March 2024, Huhtamaki introduced fiber-based lids and takeaway containers across Middle East and Africa, offering a greener alternative to plastic-based packaging
- This trend is reinforced by government policies pushing recyclable and compostable packaging across foodservice applications, particularly in QSRs and institutional catering
- Companies such as Vegware and BioPak are leading the charge with certified compostable offerings tailored to meet EU sustainability mandates
- As a result, eco-conscious innovation is becoming central to product development and procurement strategies, with sustainable food bags emerging as a major competitive differentiator
What are the Key Drivers of Food Bags Market?
- The booming food delivery and takeaway sector, combined with shifting consumer preferences for convenience, is driving demand for durable and hygienic packaging solutions
- For instance, in February 2024, Just Eat Takeaway.com collaborated with Middle East and Africaan packaging providers to roll out custom eco-friendly disposables across its partner restaurants
- Post-pandemic hygiene standards have heightened demand for tamper-evident, single-use food bags, especially in cloud kitchens and institutional catering setups
- Rising urbanization and dual-income households are further pushing the adoption of grab-and-go packaging, especially in cafes, casual dining, and on-the-move consumption formats
- In addition, the growing penetration of organized retail and expansion of ready-to-eat offerings in supermarkets are fueling diverse use cases for trays, wraps, and containers
Which Factor is challenging the Growth of the Food Bags Market?
- A primary challenge to market expansion is the high cost of compostable alternatives, which can be prohibitive for small and mid-sized foodservice businesses
- For instance, although PLA and molded fiber are sustainable, they are more expensive to produce and source than traditional plastics, impacting cost-sensitive operations
- Furthermore, insufficient industrial composting infrastructure in many Middle East and Africaan areas reduces the effectiveness of biodegradable products, limiting their environmental benefits
- Complex compliance and evolving certification standards also pose difficulties, requiring constant updates from both packaging manufacturers and foodservice operators
- Addressing these issues through government incentives, infrastructure improvements, and cost-efficient innovation is crucial to enable mass-scale adoption of eco-friendly food bags
How is the Food Bags Market Segmented?
The market is segmented on the basis of type, material, usage, style, capacity, distribution channel, application, and end-user.
• By Type
On the basis of type, the food bags market is segmented into Standard Carry Bags, Stand Up Bags, Zipper Bags, Food Safe Barrier Bags, Self-Opening-Style (SOS) Bags, Smell Proof Bags, Pinch Bottom Bags, T-Shirt Plastic Bags, and Others. The Standard Carry Bags segment dominated the market in 2024 with a market share of 28.7%, owing to their widespread use across supermarkets, takeaway outlets, and restaurants due to their convenience and affordability.
The Stand Up Bags segment is projected to register the fastest CAGR from 2025 to 2032, driven by growing adoption in food retail packaging for snacks, bakery items, and coffee due to better shelf presentation and resealability.
• By Material
On the basis of material, the market is categorized into Plastic, Paper, Aluminum, and Others. The Plastic segment held the largest market share in 2024, accounting for 42.5%, due to its flexibility, moisture resistance, and cost-effectiveness in mass production for food storage.
However, the Paper segment is expected to grow at the fastest rate during the forecast period, supported by a rising shift toward sustainable materials and regulatory bans on single-use plastics across several Middle East and Africaan nations.
• By Usage
On the basis of usage, the market is bifurcated into Single-Use and Reusable. The Single-Use segment dominated the market in 2024 with a market share of 63.1%, attributed to its wide application in quick-service restaurants, cafes, and food delivery systems for convenience and hygiene.
The Reusable segment is poised for notable growth, backed by increasing environmental awareness and demand for eco-friendly alternatives across retail and hospitality sectors.
• By Style
On the basis of style, the market is segmented into Crystal Clear Bags, Heat Seal Bags, Eco Clear Bags, Cupcake Bags, Micro-Perforated Bags, and Others. The Heat Seal Bags segment held the highest market share in 2024 at 26.9%, driven by their ability to preserve freshness and prevent leakage, making them ideal for perishable and takeaway foods.
The Eco Clear Bags segment is expected to witness the fastest CAGR due to increasing consumer inclination towards biodegradable and visually appealing packaging for bakery and organic products.
• By Capacity
On the basis of capacity, the market is segmented into Less Than 1 Kg, 1 Kg–5 Kg, 5 Kg–10 Kg, and More Than 10 Kg. The 1 Kg–5 Kg segment led the market in 2024 with a market share of 38.2%, as this range caters to a wide variety of everyday retail and restaurant packaging needs.
The Less Than 1 Kg segment is projected to grow rapidly, fueled by demand for snack-size, portion-controlled packaging, especially in cafes, bakeries, and food kiosks.
• By Distribution Channel
On the basis of distribution channel, the market is segmented into Supermarkets/Hypermarkets, Convenience Stores, Specialty Stores, E-Commerce, and Others. The Supermarkets/Hypermarkets segment dominated with a market share of 33.8% in 2024, due to their broad reach and consistent demand for food bags in both retail and packaging purposes.
The E-Commerce channel is expected to grow at the fastest CAGR during the forecast period, supported by digital transformation, direct-to-business sales, and bulk procurement by foodservice startups and small vendors.
• By Application
On the basis of application, the market is segmented into Vegetables, Fruits, Bakery Products, Meat, Seafood and Poultry, Dairy Products, Cooked Food, and Others. The Cooked Food segment led the market in 2024 with a share of 24.6%, driven by rising demand for home delivery and takeaway meals, particularly in urban regions.
The Bakery Products segment is projected to grow at the highest CAGR, supported by increasing demand for freshness-preserving packaging in pastries, bread, and confectionery.
• By End-User
On the basis of end-user, the market is segmented into Restaurants, Hotels, Tea & Coffee Shops, Sweets & Snacks Stores, Cafeteria, Home, and Others. The Restaurants segment accounted for the largest revenue share of 36.1% in 2024, driven by extensive use of food bags for dine-in leftovers, takeaway packaging, and hygiene compliance.
The Tea & Coffee Shops segment is expected to expand at the fastest pace due to rising takeaway beverage consumption and branded packaging trends among boutique cafés.
Which Region Holds the Largest Share of the Food Bags Market?
- Saudi Arabia dominated the Middle East and Africa food bags market in 2024, capturing the largest revenue share of 29.4%, owing to its expanding foodservice sector and strong investment in sustainable infrastructure
- The rising number of quick-service restaurants (QSRs), catering services, and premium food retail chains has increased demand for high-quality, eco-friendly packaging solutions
- The government’s Vision 2030, which promotes sustainability and diversification, is accelerating the adoption of compostable and recyclable food bags
South Africa Food Bags Market Insight
South Africa is projected to grow at the fastest CAGR in the Middle East and Africa region through 2032, driven by increasing environmental awareness and regulatory pressure to reduce plastic waste. Urban centers like Johannesburg and Cape Town are seeing a surge in demand for paper-based, biodegradable, and reusable packaging, especially across cafes, supermarkets, and street food vendors. Local manufacturers are also embracing innovation in green packaging to cater to this shift toward circular economy practices.
U.A.E. Food Bags Market Insight
The U.A.E. food bags market is growing steadily, supported by national sustainability targets and the rapid rise of online food delivery platforms. Government-led bans on plastic bags and initiatives like the “Year of Sustainability” are encouraging restaurants and food retailers to switch to compostable and reusable options. The vibrant hospitality sector and high consumption of ready-to-eat meals are boosting the demand for visually appealing and functional eco-packaging.
Egypt Food Bags Market Insight
Egypt’s food bags market is expanding, particularly across traditional markets, bakeries, and urban eateries, where demand for affordable biodegradable alternatives is increasing. Policy shifts toward limiting single-use plastics in major cities and growing consumer interest in sustainable living are pushing businesses to adopt paper and plant-based packaging. Educational campaigns and NGO efforts are also playing a key role in reshaping packaging norms among retailers and vendors.
Nigeria Food Bags Market Insight
Nigeria is experiencing a gradual shift in its food bags market, driven by awareness campaigns, urbanization, and the rise of food delivery startups. While plastic packaging still dominates, government initiatives and environmental NGOs are promoting the use of eco-friendly bags, especially in Lagos and Abuja. The informal food sector is slowly adopting compostable and reusable options, influenced by growing public concern over pollution and health impacts.
Which are the Top Companies in Food Bags Market?
The food bags industry is primarily led by well-established companies, including:
- Graphic Packaging International, L.L.C. (U.S.)
- Sonoco Products Company (U.S.)
- Sealed Air (U.S.)
- WestRock Company (U.S.)
- Berry Global Inc. (U.S.)
- Huhtamaki (Finland)
- Cascades Inc. (Canada)
- Amcor plc (Switzerland)
- Airlite Plastics (U.S.)
- Twin Rivers Paper Company (U.S.)
- Seda Group, Inc. (Italy)
- Fabri-Kal (U.S.)
- Dart Container Corporation (U.S.)
- Anchor Packaging Inc (U.S.)
- Placon (U.S.)
- Novolex (U.S.)
- Hoffmaster Group, Inc. (U.S.)
- D&W Fine Pack (U.S.)
- Menasha Packaging Company, L.L.C. (U.S.)
- Inteplast Group (U.S.)
SKU-

- Interactive Data Analysis Dashboard
- Company Analysis Dashboard for high growth potential opportunities
- Research Analyst Access for customization & queries
- Competitor Analysis with Interactive dashboard
- Latest News, Updates & Trend analysis
- Harness the Power of Benchmark Analysis for Comprehensive Competitor Tracking
Middle East And Africa Food Bags Market, Supply Chain Analysis and Ecosystem Framework
To support market growth and help clients navigate the impact of geopolitical shifts, DBMR has integrated in-depth supply chain analysis into its Middle East And Africa Food Bags Market research reports. This addition empowers clients to respond effectively to global changes affecting their industries. The supply chain analysis section includes detailed insights such as Middle East And Africa Food Bags Market consumption and production by country, price trend analysis, the impact of tariffs and geopolitical developments, and import and export trends by country and HSN code. It also highlights major suppliers with data on production capacity and company profiles, as well as key importers and exporters. In addition to research, DBMR offers specialized supply chain consulting services backed by over a decade of experience, providing solutions like supplier discovery, supplier risk assessment, price trend analysis, impact evaluation of inflation and trade route changes, and comprehensive market trend analysis.
Data collection and base year analysis are done using data collection modules with large sample sizes. The stage includes obtaining market information or related data through various sources and strategies. It includes examining and planning all the data acquired from the past in advance. It likewise envelops the examination of information inconsistencies seen across different information sources. The market data is analysed and estimated using market statistical and coherent models. Also, market share analysis and key trend analysis are the major success factors in the market report. To know more, please request an analyst call or drop down your inquiry.
The key research methodology used by DBMR research team is data triangulation which involves data mining, analysis of the impact of data variables on the market and primary (industry expert) validation. Data models include Vendor Positioning Grid, Market Time Line Analysis, Market Overview and Guide, Company Positioning Grid, Patent Analysis, Pricing Analysis, Company Market Share Analysis, Standards of Measurement, Global versus Regional and Vendor Share Analysis. To know more about the research methodology, drop in an inquiry to speak to our industry experts.
Data Bridge Market Research is a leader in advanced formative research. We take pride in servicing our existing and new customers with data and analysis that match and suits their goal. The report can be customized to include price trend analysis of target brands understanding the market for additional countries (ask for the list of countries), clinical trial results data, literature review, refurbished market and product base analysis. Market analysis of target competitors can be analyzed from technology-based analysis to market portfolio strategies. We can add as many competitors that you require data about in the format and data style you are looking for. Our team of analysts can also provide you data in crude raw excel files pivot tables (Fact book) or can assist you in creating presentations from the data sets available in the report.


