
Middle East And Africa Food Grade And Animal Feed Grade Salt Market
Market Size in USD Million
 USD
467.09 Million
USD
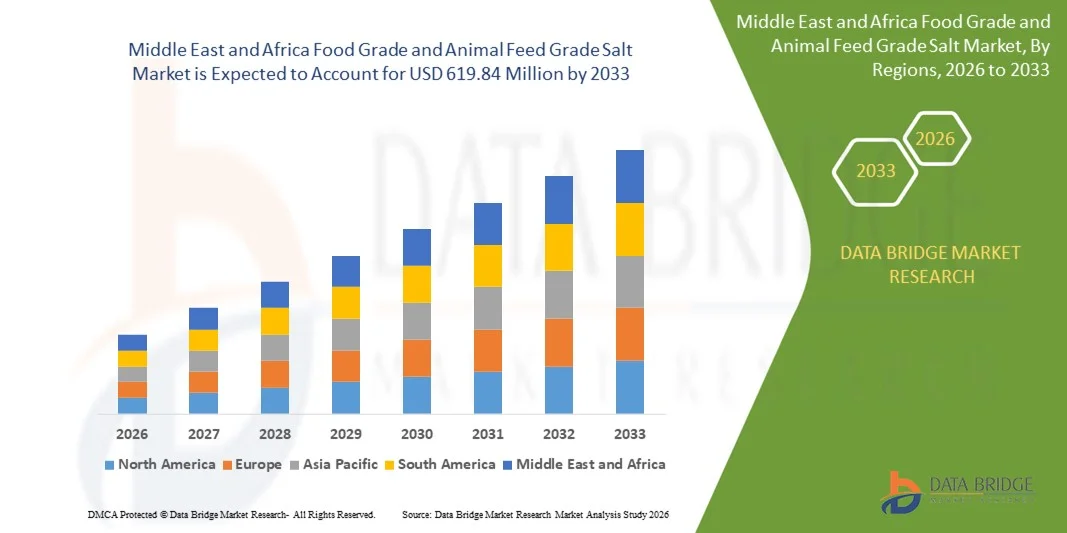
619.84 Million
2025
2033
USD
467.09 Million
USD
619.84 Million
2025
2033
| 2026 - 2033 | |
| USD 467.09 Million | |
| USD 619.84 Million | |
| % | |
|
What is the Middle East and Africa Food Grade and Animal Feed Grade Salt Market Size and Growth Rate?
- The Middle East and Africa food grade and animal feed grade salt market size was valued at USD 467.09 million in 2025 and is expected to reach USD 619.84 million by 2033, at a CAGR of 3.60% during the forecast period
- Increasing demand for food grade salt in food & beverage industry, the growth of salt is increasing in the market. Similarly, the increased usage of salt in animal feed is also boosting the growth in the market.
What are the Major Takeaways of Food Grade and Animal Feed Grade Salt Market?
- Certain government initiatives and policies for salt reduction are hampering the growth of food grade salt in the market. The various launches in the food grade salt are propelling the market growth
- Saudi Arabia dominated the Middle East and Africa food grade and animal feed grade salt market with an estimated 36.9% revenue share in 2025, driven by strong demand from processed food manufacturing, meat and poultry processing, bakery, and dairy industries across the country
- The U.A.E. is projected to register the fastest CAGR of 5.24% from 2026 to 2033, supported by rapid growth in food processing, high dependence on packaged and imported foods, and expanding foodservice and hospitality sectors
- The Vacuum Salt segment dominated the market with an estimated 41.8% share in 2025, owing to its high purity, uniform crystal size, and suitability for food processing and animal feed formulations
Report Scope and Food Grade and Animal Feed Grade Salt Market Segmentation
|
Attributes |
Food Grade and Animal Feed Grade Salt Key Market Insights |
|
Segments Covered |
|
|
Countries Covered |
Middle East and Africa
|
|
Key Market Players |
|
|
Market Opportunities |
|
|
Value Added Data Infosets |
In addition to the insights on market scenarios such as market value, growth rate, segmentation, geographical coverage, and major players, the market reports curated by the Data Bridge Market Research also include in-depth expert analysis, pricing analysis, brand share analysis, consumer survey, demography analysis, supply chain analysis, value chain analysis, raw material/consumables overview, vendor selection criteria, PESTLE Analysis, Porter Analysis, and regulatory framework. |
What is the Key Trend in the Food Grade and Animal Feed Grade Salt Market?
Increasing Shift Toward Purity-Enhanced, Fortified, and Application-Specific Salt Products
- The food grade and animal feed grade salt market is witnessing a growing shift toward high-purity, contaminant-controlled, and standardized salt products to meet stringent food safety and animal nutrition regulations
- Manufacturers are introducing fortified and functional salt variants, including iodine-enriched, mineral-balanced, and trace-element-added salts for both human consumption and livestock feed
- Rising demand for consistent quality, uniform granulation, and reliable mineral composition is driving adoption across food processing plants and feed mills
- For instance, companies such as Cargill, Morton Salt, K+S, and Windsor Salt are expanding production of refined, food-safe, and feed-optimized salt grades with improved processing and packaging standards
- Increasing focus on animal health, feed efficiency, and nutritional supplementation is accelerating demand for feed-grade salt solutions
- As regulatory compliance and nutrition optimization gain importance, food grade and animal feed grade salts remain essential inputs for food processing and livestock management
What are the Key Drivers of Food Grade and Animal Feed Grade Salt Market?
- Rising demand for safe, hygienic, and nutritionally compliant ingredients in packaged foods, meat processing, dairy products, and animal feed formulations
- For instance, during 2024–2025, leading salt producers such as Cargill, Morton Salt, and K+S increased capacity for food-grade and fortified salt products to support growing demand from food and feed manufacturers
- Growth of processed food consumption, meat production, and commercial livestock farming across the U.S., Middle East and Africa, and Asia-Pacific is boosting salt demand
- Advancements in refining technologies, purification processes, and contamination control have improved product quality and regulatory adherence
- Increasing use of feed-grade salt for electrolyte balance, digestion, and growth optimization in cattle, poultry, and aquaculture
- Supported by expanding food processing industries and rising Middle East and Africa protein consumption, the Food Grade and Animal Feed Grade Salt market is expected to witness steady long-term growth
Which Factor is Challenging the Growth of the Food Grade and Animal Feed Grade Salt Market?
- Stringent regulations related to food safety, purity standards, and additive compliance increase production and certification costs for manufacturers
- For instance, during 2024–2025, rising energy prices, transportation costs, and environmental compliance requirements impacted operational margins for salt producers
- Fluctuations in raw salt availability due to climatic conditions, mining restrictions, and logistics disruptions affect supply stability
- Growing consumer preference for low-sodium diets and salt reduction initiatives limits volume growth in certain food categories
- Competition from salt substitutes, mineral blends, and alternative dietary supplements creates pricing and demand pressures
- To overcome these challenges, companies are focusing on process optimization, product differentiation, sustainable sourcing, and value-added fortified salt offerings
How is the Food Grade and Animal Feed Grade Salt Market Segmented?
The market is segmented on the basis of product type, purity, production processes, distribution channel, end user, and application.
- By Product Type
On the basis of product type, the food grade and animal feed grade salt market is segmented into Rock Salt, Sea Salt, Brine, Vacuum Salt, and Others. The Vacuum Salt segment dominated the market with an estimated 41.8% share in 2025, owing to its high purity, uniform crystal size, and suitability for food processing and animal feed formulations. Vacuum salt is widely used in bakery, dairy, meat processing, and feed applications due to its low impurity levels and consistent mineral composition.
The Sea Salt segment is expected to grow at the fastest CAGR from 2026 to 2033, driven by rising demand for minimally processed, natural-origin salt in both food and specialty feed applications. Increasing preference for sea salt in premium food products and growing awareness of trace mineral benefits support rapid growth.
- By Purity
On the basis of purity, the market is segmented into Purity 98%–99.5% and Purity Above 99.5%. The Purity Above 99.5% segment dominated the market with a 57.3% share in 2025, supported by stringent food safety regulations and growing demand from processed food manufacturers and commercial feed producers. High-purity salt ensures consistency, hygiene, and compliance with regulatory standards, making it a preferred choice across large-scale food production.
The Purity 98%–99.5% segment is projected to grow at the fastest CAGR from 2026 to 2033, driven by increasing use in animal feed, aquaculture, and cost-sensitive food applications. Balanced pricing and adequate mineral content make this purity range attractive for high-volume feed formulations.
- By Production Processes
On the basis of production processes, the market is segmented into Evaporation Method, Mining Method, and Others. The Evaporation Method segment dominated the market with an estimated 46.5% share in 2025, due to its ability to produce high-purity salt with controlled crystallization. This method is widely used for food-grade and feed-grade applications where consistency and contamination control are critical.
The Mining Method segment is expected to grow at the fastest CAGR from 2026 to 2033, supported by expanding underground and solution mining operations, improved refining technologies, and growing demand for bulk feed-grade salt. Increased investment in sustainable mining practices further supports segment growth.
- By Distribution Channel
On the basis of distribution channel, the food grade and animal feed grade salt market is segmented into Direct and Indirect channels. The Direct channel dominated the market with a 52.6% share in 2025, driven by strong demand from large food processors, meat producers, and feed manufacturers seeking stable supply, customized specifications, and cost efficiency. Direct procurement ensures quality assurance, traceability, and long-term supplier relationships.
The Indirect channel is projected to grow at the fastest CAGR from 2026 to 2033, supported by expansion of wholesalers, distributors, and retail networks catering to small and medium food producers, foodservice operators, and regional feed mills.
- By End User
On the basis of end user, the market is segmented into Food & Beverages Industry and Food Service Sector. The Food & Beverages Industry segment dominated the market with an estimated 64.9% share in 2025, owing to extensive usage in processed foods, bakery, dairy, meat processing, and packaged snacks. Large-scale production volumes and stringent quality requirements drive sustained demand.
The Food Service Sector segment is expected to grow at the fastest CAGR from 2026 to 2033, driven by expansion of quick-service restaurants, catering services, and institutional kitchens, along with rising consumption of prepared foods.
- By Application
On the basis of application, the food grade and animal feed grade salt market is segmented into Food Products, Sports Nutrition, Beverages, and Animal Feed. The Food Products segment dominated the market with a 48.7% share in 2025, supported by high usage in processed foods, bakery, dairy, and meat preservation. Salt remains a critical ingredient for flavor enhancement, texture, and shelf-life extension.
The Animal Feed segment is projected to grow at the fastest CAGR from 2026 to 2033, driven by rising livestock production, increasing focus on animal health, and growing use of salt as an essential mineral supplement in feed formulations.
Which Region Holds the Largest Share of the Food Grade and Animal Feed Grade Salt Market?
- Saudi Arabia dominated the Middle East and Africa food grade and animal feed grade salt market with an estimated 36.9% revenue share in 2025, driven by strong demand from processed food manufacturing, meat and poultry processing, bakery, and dairy industries across the country. High consumption of packaged foods, expanding food processing capacity, and a well-established livestock and poultry sector continue to support robust salt demand
- Leading salt producers and food ingredient suppliers in the Middle East and Africa are investing in refining technologies, iodized and fortified salt products, and sustainable production practices, reinforcing Saudi Arabia’s leadership position. Expansion of domestic food manufacturing and efficient distribution networks further strengthen regional market presence
- Government focuses on food security, nutrition standards, and industrial diversification consolidates the Middle East and Africa’s position in the Food Grade and Animal Feed Grade Salt market
U.A.E. Food Grade and Animal Feed Grade Salt Market
The U.A.E. is projected to register the fastest CAGR of 5.24% from 2026 to 2033, supported by rapid growth in food processing, high dependence on packaged and imported foods, and expanding foodservice and hospitality sectors. Increasing use of standardized food-grade and feed-grade salt in food manufacturing and animal nutrition supports strong market growth.
South Africa Food Grade and Animal Feed Grade Salt Market Insight
South Africa contributes significantly due to strong demand from processed foods, bakery, and meat processing industries. Expansion of commercial livestock farming and growing use of feed-grade salt in animal nutrition support steady market expansion.
Egypt Food Grade and Animal Feed Grade Salt Market Insight
Egypt contributes steadily, driven by high consumption of staple food products, expanding food manufacturing capacity, and rising demand for feed-grade salt in poultry and livestock farming. Investments in refining capacity and emphasis on food safety compliance reinforce long-term growth.
Which are the Top Companies in Food Grade and Animal Feed Grade Salt Market?
The food grade and animal feed grade salt industry is primarily led by well-established companies, including:
- Cargill, Incorporated (U.S.)
- Morton Salt, Inc. (U.S.)
- K+S Aktiengesellschaft (Germany)
- Ciech S.A. (Poland)
- Windsor Salt Ltd. (Canada)
- United Salt Corporation (U.S.)
- SaltWorks (U.S.)
- The Cope Company Salt (U.S.)
- SAN FRANCISCO SALT CO (U.S.)
- ZOUTMAN NV (Belgium)
- Salinen Austria Aktiengesellschaft (Austria)
- WA Salt Group (Australia)
- Cimsal Indústria Salineira (Brazil)
- Cheetham Salt (Australia)
- British Salt (U.K.)
- Mozyrsalt, JSC (Belarus)
- Sifto Canada (Canada)
- Midwest Salt (U.S.)
- ROCK (U.K.)
- Ahir Salt Industries (India)
- Donald Brown Group (U.K.)
What are the Recent Developments in Middle East and Africa Food Grade and Animal Feed Grade Salt Market?
- In May 2023, Cargill entered into a strategic collaboration with CIECH Group to expand its specialty and evaporated food salt solutions across Middle East and Africa. This development aims to diversify Cargill’s product offerings tailored for food manufacturers and strengthen its market presence in the region. The move positions Cargill to meet the rising demand for specialty salts in food processing, reinforcing its innovation-driven leadership in the Middle East and Africaan salt market
- In December 2022, CIECH Soda Polska signed a long-term supply agreement with Inowrocław Salt Mines "Solino" to secure a consistent brine supply. This initiative enhances production stability and operational efficiency for CIECH, ensuring uninterrupted output. The agreement supports CIECH’s role as a major player in the Middle East and Africaan salt market through reliable sourcing and sustainable growth
- In April 2022, Tata Salt launched Tata Salt Immuno in India, a zinc-fortified edible salt designed to support immune health. This product innovation addresses increasing consumer focus on health and nutrition, going beyond basic iodization. The launch strengthens Tata’s product portfolio and highlights a growing trend toward functional salt in the Indian market
- In May 2021, Tanteo Tequila introduced flavored margarita salts to complement its tequila offerings, targeting the premium cocktail segment. These salts enhance taste profiles and provide a customizable drinking experience, aligning with the evolving preferences in the beverage industry. The launch showcases the expansion of salt applications into lifestyle and niche markets, creating new growth avenues beyond traditional food use
SKU-

- Interactive Data Analysis Dashboard
- Company Analysis Dashboard for high growth potential opportunities
- Research Analyst Access for customization & queries
- Competitor Analysis with Interactive dashboard
- Latest News, Updates & Trend analysis
- Harness the Power of Benchmark Analysis for Comprehensive Competitor Tracking
Middle East And Africa Food Grade And Animal Feed Grade Salt Market, Supply Chain Analysis and Ecosystem Framework
To support market growth and help clients navigate the impact of geopolitical shifts, DBMR has integrated in-depth supply chain analysis into its Middle East And Africa Food Grade And Animal Feed Grade Salt Market research reports. This addition empowers clients to respond effectively to global changes affecting their industries. The supply chain analysis section includes detailed insights such as Middle East And Africa Food Grade And Animal Feed Grade Salt Market consumption and production by country, price trend analysis, the impact of tariffs and geopolitical developments, and import and export trends by country and HSN code. It also highlights major suppliers with data on production capacity and company profiles, as well as key importers and exporters. In addition to research, DBMR offers specialized supply chain consulting services backed by over a decade of experience, providing solutions like supplier discovery, supplier risk assessment, price trend analysis, impact evaluation of inflation and trade route changes, and comprehensive market trend analysis.
Data collection and base year analysis are done using data collection modules with large sample sizes. The stage includes obtaining market information or related data through various sources and strategies. It includes examining and planning all the data acquired from the past in advance. It likewise envelops the examination of information inconsistencies seen across different information sources. The market data is analysed and estimated using market statistical and coherent models. Also, market share analysis and key trend analysis are the major success factors in the market report. To know more, please request an analyst call or drop down your inquiry.
The key research methodology used by DBMR research team is data triangulation which involves data mining, analysis of the impact of data variables on the market and primary (industry expert) validation. Data models include Vendor Positioning Grid, Market Time Line Analysis, Market Overview and Guide, Company Positioning Grid, Patent Analysis, Pricing Analysis, Company Market Share Analysis, Standards of Measurement, Global versus Regional and Vendor Share Analysis. To know more about the research methodology, drop in an inquiry to speak to our industry experts.
Data Bridge Market Research is a leader in advanced formative research. We take pride in servicing our existing and new customers with data and analysis that match and suits their goal. The report can be customized to include price trend analysis of target brands understanding the market for additional countries (ask for the list of countries), clinical trial results data, literature review, refurbished market and product base analysis. Market analysis of target competitors can be analyzed from technology-based analysis to market portfolio strategies. We can add as many competitors that you require data about in the format and data style you are looking for. Our team of analysts can also provide you data in crude raw excel files pivot tables (Fact book) or can assist you in creating presentations from the data sets available in the report.


