
Middle East And Africa Food Micronized Salt Market
Market Size in USD Million
 USD
125.45 Million
USD
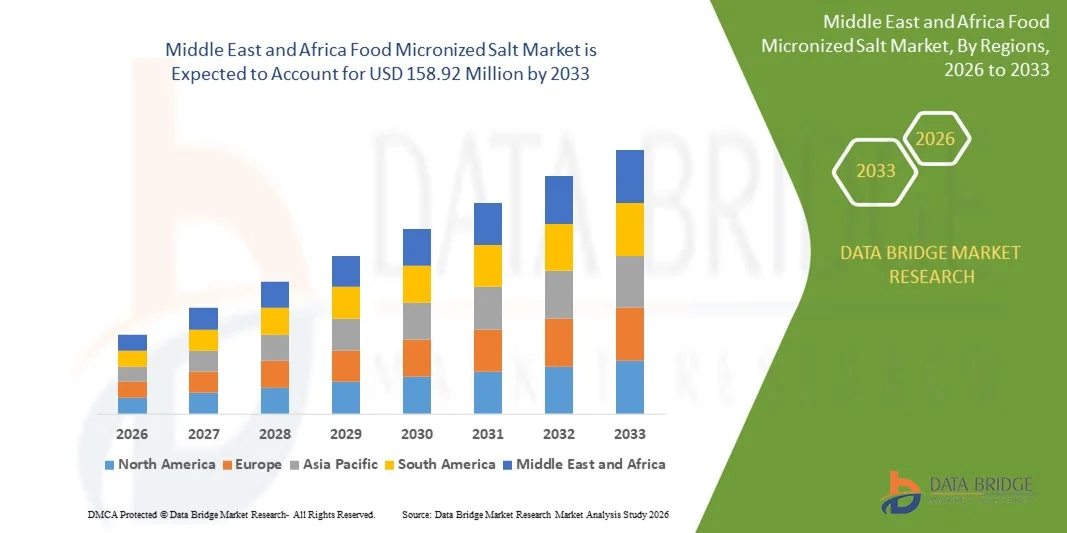
158.92 Million
2025
2033
USD
125.45 Million
USD
158.92 Million
2025
2033
| 2026 - 2033 | |
| USD 125.45 Million | |
| USD 158.92 Million | |
| % | |
|
What is the Middle East and Africa Food Micronized Salt Market Size and Growth Rate?
- As per Data Bridge Market Research Analysis the Middle East and Africa food micronized salt market size was valued at USD 125.45 million in 2025 and is expected to reach USD 158.92 million by 2033, at a CAGR of 3.60% during the forecast period
- Increasing demand for food grade salt in food & beverage industry, the growth of salt is increasing in the market. Similarly, the increased usage of salt in animal feed is also boosting the growth in the market.
Market Size & Forecast
- Middle East and Africa Market Value (2025): USD 125.45 million
- Expected Market Value (2033): USD 158.92 million
- Forecast CAGR (2026–2033): 3.60%
What are the Major Takeaways of Food Micronized Salt Market?
- Certain government initiatives and policies for salt reduction are hampering the growth of food grade salt in the market. The various launches in the food grade salt are propelling the market growth
- Saudi Arabia dominated the Middle East and Africa food micronized salt market with an estimated 36.9% revenue share in 2025, driven by strong demand from processed food manufacturing, bakery, dairy, and meat & poultry processing industries
- The U.A.E. is projected to register the fastest CAGR of 5.24% from 2026 to 2033, supported by rapid expansion of food processing facilities, high reliance on packaged and imported foods, and strong growth in foodservice and hospitality sectors
- The Purity Above 99.5% segment dominated the market with a 57.3% share in 2025, driven by stringent food safety regulations and high demand from large-scale food processors and premium food manufacturers
Report Scope and Food Micronized Salt Market Segmentation
|
Attributes |
Food Micronized Salt Key Market Insights |
|
Segments Covered |
|
|
Countries Covered |
Middle East and Africa
|
|
Key Market Players |
|
|
Market Opportunities |
|
|
Value Added Data Infosets |
In addition to the insights on market scenarios such as market value, growth rate, segmentation, geographical coverage, and major players, the market reports curated by the Data Bridge Market Research also include in-depth expert analysis, pricing analysis, brand share analysis, consumer survey, demography analysis, supply chain analysis, value chain analysis, raw material/consumables overview, vendor selection criteria, PESTLE Analysis, Porter Analysis, and regulatory framework. |
What is the Key Trend in the Food Micronized Salt Market?
Rising Shift Toward Purity-Enhanced, Fortified, and Application-Specific Salt Solutions
- The food micronized salt market is experiencing a clear shift toward high-purity, contaminant-controlled, and standardized salt grades to comply with increasingly strict food safety and feed regulations
- Manufacturers are expanding portfolios with fortified and functional salts, including iodine-fortified, mineral-enriched, and trace-element-balanced variants for food processing and animal nutrition
- Growing demand for uniform particle size, consistent mineral composition, and reliable performance is driving adoption across food processing units and commercial feed mills
- For instance, companies such as Cargill, Morton Salt, K+S, and Windsor Salt are scaling up production of refined, food-safe, and feed-optimized micronized salt grades with enhanced processing controls
- Rising emphasis on animal health, feed efficiency, and nutritional supplementation is accelerating demand for specialized feed-grade micronized salts
- As regulatory compliance and nutrition optimization gain priority, Food Micronized Salts remain critical inputs across food and livestock value chains
What are the Key Drivers of Food Micronized Salt Market?
- Increasing demand for safe, hygienic, and nutritionally compliant ingredients in packaged foods, meat processing, dairy products, and animal feed formulations
- For instance, during 2024–2025, major producers including Cargill, Morton Salt, and K+S expanded capacity for food-grade and fortified salt products to meet rising industry demand
- Growth in processed food consumption, meat production, and intensive livestock farming across the U.S., Middle East and Africa, and Asia-Pacific is boosting market growth
- Advancements in refining technologies, purification methods, and contamination control systems have improved product consistency and regulatory adherence
- Increasing use of feed-grade micronized salt to support electrolyte balance, digestion, and growth performance in poultry, cattle, and aquaculture
- Supported by expanding food processing industries and rising protein consumption, the Food Micronized Salt market is expected to grow steadily over the long term
Which Factor is Challenging the Growth of the Food Micronized Salt Market?
- Stringent food safety regulations, purity standards, and additive compliance requirements increase production complexity and certification costs
- For instance, during 2024–2025, higher energy prices, transportation expenses, and environmental compliance costs pressured profit margins for salt manufacturers
- Fluctuations in raw salt availability due to climatic variations, mining restrictions, and logistics disruptions affect supply consistency
- Growing consumer preference for low-sodium diets and salt-reduction initiatives limits volume growth in certain food categories
- Competition from salt substitutes, mineral blends, and alternative nutritional supplements creates pricing and demand pressures
- To mitigate these challenges, companies are emphasizing process optimization, sustainable sourcing, product differentiation, and value-added fortified salt solutions
How is the Food Micronized Salt Market Segmented?
The market is segmented on the basis of grade and application.
- By Grade
On the basis of grade, the food micronized salt market is segmented into Purity 98%–99.5% and Purity Above 99.5%. The Purity Above 99.5% segment dominated the market with a 57.3% share in 2025, driven by stringent food safety regulations and high demand from large-scale food processors and premium food manufacturers. This grade offers superior consistency, low impurity levels, and reliable performance, making it ideal for bakery, dairy, confectionery, processed foods, and nutraceutical applications. Food manufacturers prefer high-purity micronized salt to ensure taste uniformity, extended shelf life, and regulatory compliance.
The Purity 98%–99.5% segment is expected to grow at the fastest CAGR from 2026 to 2033, supported by rising adoption in cost-sensitive applications such as animal feed, poultry, aquaculture, and bulk food processing. Competitive pricing, sufficient mineral balance, and wide availability make this grade attractive for high-volume industrial and feed applications.
- By Application
On the basis of application, the food micronized salt market is segmented into Chocolate & Confectionery, Bakery, Functional Food, Dairy Products, Dairy Alternatives, Processed Meat, Poultry and Seafood, Canned/Preserved Fruits & Vegetables, Prepared Meals, Beverages, and Others. The Bakery segment dominated the market with an estimated 34.6% share in 2025, owing to consistent demand for micronized salt to enhance flavor, control yeast activity, and improve dough stability. Uniform granulation and precise solubility make micronized salt essential in large-scale bakery production.
The Functional Food segment is projected to grow at the fastest CAGR from 2026 to 2033, driven by rising consumer focus on health, nutrition, and fortified food products. Increasing incorporation of mineral-balanced and low-sodium salt variants in functional and specialty foods is accelerating demand, supported by growing health awareness and clean-label food trends globally.
Which Region Holds the Largest Share of the Food Micronized Salt Market?
- Saudi Arabia dominated the Middle East and Africa food micronized salt market with an estimated 36.9% revenue share in 2025, driven by strong demand from processed food manufacturing, bakery, dairy, and meat & poultry processing industries. High consumption of packaged foods, expanding food manufacturing infrastructure, and a well-developed livestock and poultry sector continue to support robust demand for food-grade and feed-grade micronized salt across the country
- Leading salt producers and food ingredient suppliers in the Middle East and Africa are investing in advanced refining technologies, iodized and fortified salt variants, and sustainable production practices, reinforcing Saudi Arabia’s leadership position. Expansion of domestic food processing capacity and efficient logistics networks further strengthen its regional market dominance
- Government initiatives focused on food security, nutrition standards, and industrial diversification continue to consolidate Saudi Arabia’s leading role in the Middle East and Africa Food Micronized Salt market
U.A.E. Food Micronized Salt Market Insight
The U.A.E. is projected to register the fastest CAGR of 5.24% from 2026 to 2033, supported by rapid expansion of food processing facilities, high reliance on packaged and imported foods, and strong growth in foodservice and hospitality sectors. Rising adoption of standardized food-grade and feed-grade salt in manufacturing and animal nutrition underpins market growth.
South Africa Food Micronized Salt Market Insight
South Africa contributes significantly to regional demand, driven by a well-established processed food industry, expanding bakery and meat processing sectors, and increasing use of feed-grade salt in commercial livestock and poultry farming.
Egypt Food Micronized Salt Market Insight
Egypt shows steady growth supported by high consumption of staple foods, expanding domestic food manufacturing capacity, and rising demand for micronized salt in poultry and livestock feed. Investments in refining infrastructure and stronger food safety compliance continue to support long-term market expansion.
Which are the Top Companies in Food Micronized Salt Market?
The food micronized salt industry is primarily led by well-established companies, including:
- K+S Aktiengesellschaft (Germany)
- CIECH S.A. (Poland)
- Ahir Salt Industries (India)
- INFOSA (Spain)
- Cargill, Incorporated (U.S.)
- KUTCH BRINE CHEM INDUSTRIES (India)
- ACI Limited (Bangladesh)
- ICL (Israel)
SKU-

- Interactive Data Analysis Dashboard
- Company Analysis Dashboard for high growth potential opportunities
- Research Analyst Access for customization & queries
- Competitor Analysis with Interactive dashboard
- Latest News, Updates & Trend analysis
- Harness the Power of Benchmark Analysis for Comprehensive Competitor Tracking
Middle East And Africa Food Micronized Salt Market, Supply Chain Analysis and Ecosystem Framework
To support market growth and help clients navigate the impact of geopolitical shifts, DBMR has integrated in-depth supply chain analysis into its Middle East And Africa Food Micronized Salt Market research reports. This addition empowers clients to respond effectively to global changes affecting their industries. The supply chain analysis section includes detailed insights such as Middle East And Africa Food Micronized Salt Market consumption and production by country, price trend analysis, the impact of tariffs and geopolitical developments, and import and export trends by country and HSN code. It also highlights major suppliers with data on production capacity and company profiles, as well as key importers and exporters. In addition to research, DBMR offers specialized supply chain consulting services backed by over a decade of experience, providing solutions like supplier discovery, supplier risk assessment, price trend analysis, impact evaluation of inflation and trade route changes, and comprehensive market trend analysis.
Data collection and base year analysis are done using data collection modules with large sample sizes. The stage includes obtaining market information or related data through various sources and strategies. It includes examining and planning all the data acquired from the past in advance. It likewise envelops the examination of information inconsistencies seen across different information sources. The market data is analysed and estimated using market statistical and coherent models. Also, market share analysis and key trend analysis are the major success factors in the market report. To know more, please request an analyst call or drop down your inquiry.
The key research methodology used by DBMR research team is data triangulation which involves data mining, analysis of the impact of data variables on the market and primary (industry expert) validation. Data models include Vendor Positioning Grid, Market Time Line Analysis, Market Overview and Guide, Company Positioning Grid, Patent Analysis, Pricing Analysis, Company Market Share Analysis, Standards of Measurement, Global versus Regional and Vendor Share Analysis. To know more about the research methodology, drop in an inquiry to speak to our industry experts.
Data Bridge Market Research is a leader in advanced formative research. We take pride in servicing our existing and new customers with data and analysis that match and suits their goal. The report can be customized to include price trend analysis of target brands understanding the market for additional countries (ask for the list of countries), clinical trial results data, literature review, refurbished market and product base analysis. Market analysis of target competitors can be analyzed from technology-based analysis to market portfolio strategies. We can add as many competitors that you require data about in the format and data style you are looking for. Our team of analysts can also provide you data in crude raw excel files pivot tables (Fact book) or can assist you in creating presentations from the data sets available in the report.


