
Middle East And Africa Geosynthetics Market
Market Size in USD Billion
 USD
1.04 Billion
USD
1.89 Billion
2024
2032
USD
1.04 Billion
USD
1.89 Billion
2024
2032
| 2025 - 2032 | |
| USD 1.04 Billion | |
| USD 1.89 Billion | |
| % | |
|
Middle East and Africa Geosynthetics Market Size
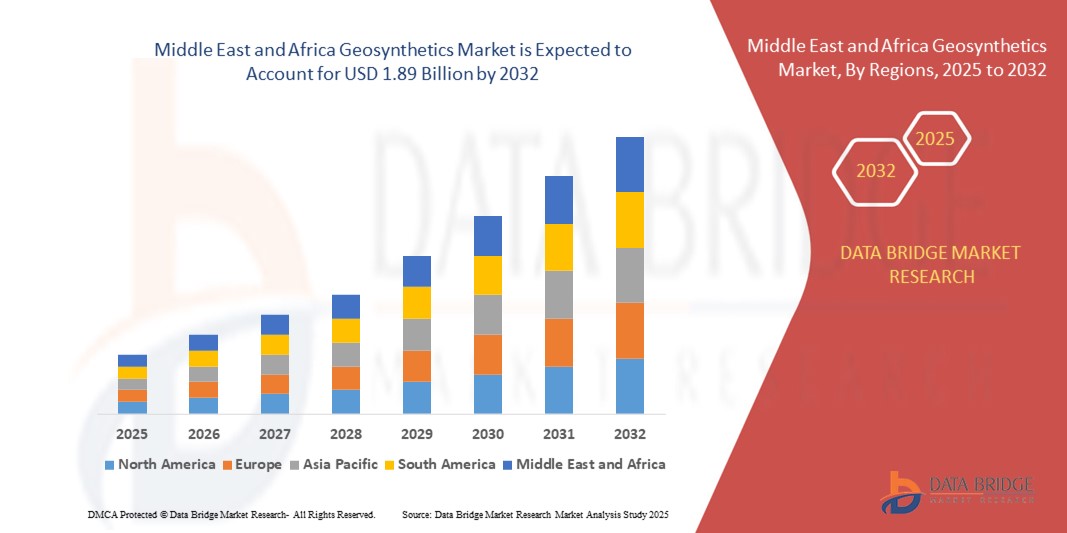
- The Middle East and Africa geosynthetics market size was valued at USD 1.04 billion in 2024 and is expected to reach USD 1.89 billion by 2032, at a CAGR of 7.80% during the forecast period
- The market growth is largely fuelled by the rising investments in infrastructure development, growing emphasis on sustainable construction practices, and the increasing need for soil stabilization and erosion control across arid regions
- Rapid urbanization, along with the need for effective waste management and water conservation systems, is contributing to the expanding application of geosynthetics across sectors such as transportation, mining, and agriculture in the region
Middle East and Africa Geosynthetics Market Analysis
- The market is experiencing significant momentum due to urban expansion, highway and rail network projects, and large-scale water resource management initiatives in countries such as the U.A.E., Saudi Arabia, and South Africa
- The demand for geosynthetics, including geotextiles, geomembranes, and geogrids, is also being driven by the construction of oil and gas pipelines, landfills, and mining operations, where reinforcement, filtration, and containment solutions are critical
- Saudi Arabia dominates the Middle East and Africa geosynthetics market, accounting for the largest revenue share in 2024, owing to its aggressive infrastructure development initiatives under Vision 2030
- South Africa is expected to witness the highest compound annual growth rate (CAGR) in the Middle East and Africa geosynthetics market due to rising investments in roadways, mining operations, and urban expansion. The country’s growing focus on environmental sustainability and the adoption of cost-effective, durable construction materials are contributing to the rising use of geosynthetics across both public and private sector projects
- The geotextiles segment dominated the market with the largest revenue share in 2024, primarily due to their widespread application in road construction, landfills, and erosion control. Their cost-effectiveness, filtration properties, and soil stabilization capabilities make them a preferred material in infrastructure and environmental projects across arid and semi-arid zones. Increasing road development and urban expansion across the region further support the segment’s strong demand
Report Scope and Middle East and Africa Geosynthetics Market Segmentation
|
Attributes |
Middle East and Africa Geosynthetics Key Market Insights |
|
Segments Covered |
|
|
Countries Covered |
Middle East and Africa
|
|
Key Market Players |
• Mattex Group (Saudi Arabia) |
|
Market Opportunities |
• Expansion of Geosynthetics in Waste Management Applications |
|
Value Added Data Infosets |
In addition to the insights on market scenarios such as market value, growth rate, segmentation, geographical coverage, and major players, the market reports curated by the Data Bridge Market Research also include import export analysis, production capacity overview, production consumption analysis, price trend analysis, climate change scenario, supply chain analysis, value chain analysis, raw material/consumables overview, vendor selection criteria, PESTLE Analysis, Porter Analysis, and regulatory framework. |
Middle East and Africa Geosynthetics Market Trends
Rising Integration of Geosynthetics in Infrastructure and Environmental Projects
- The Middle East and Africa region is witnessing a rising demand for geosynthetics due to increased investment in large-scale infrastructure development, such as highways, airports, ports, and railways. These materials play a crucial role in soil reinforcement, drainage, and separation, helping improve the lifespan and durability of engineered structures. Countries such as the United Arab Emirates and Saudi Arabia are major contributors to this trend, with ongoing megaprojects requiring advanced geotechnical solutions
- Environmental concerns are also driving the integration of geosynthetics in waste management and water conservation applications. Geomembranes and geotextiles are widely used for landfill liners, leachate collection systems, and water reservoirs, particularly in regions dealing with water scarcity. Their ability to provide cost-effective containment and reduce environmental degradation makes them essential for sustainable project planning
- For instance, in 2023, Saudi Arabia’s Red Sea Project incorporated geosynthetic liners to safeguard its coastal ecology during resort construction, setting a benchmark for eco-conscious infrastructure development in the region. This application demonstrated the material’s environmental resilience and adaptability to extreme climatic conditions
- Rapid urbanization in Sub-Saharan Africa is also increasing demand for geosynthetic solutions in drainage and flood mitigation projects. Cities such as Lagos and Nairobi are investing in geotextile-based stormwater management systems to combat seasonal flooding and support resilient infrastructure expansion
- As governments emphasize sustainability and climate-resilient construction, the geosynthetics market is expected to continue expanding. Innovation in locally manufactured, durable materials and the growing acceptance of performance-based designs are crucial for long-term growth across the region
Middle East and Africa Geosynthetics Market Dynamics
Driver
Expanding Infrastructure Development and Regulatory Emphasis on Environmental Sustainability
• The surge in government-led infrastructure programs across the Middle East and Africa is significantly boosting the demand for geosynthetics. From road and rail expansions to energy and water projects, geosynthetics are integral to ensuring structural integrity, reducing material consumption, and minimizing maintenance costs. Their use in base reinforcement and subgrade separation helps optimize project performance in challenging soil conditions
• Environmental protection regulations are becoming stricter, especially in the Gulf Cooperation Council (GCC) nations, leading to increased use of geomembranes, geotextiles, and geonets in landfills, mining operations, and oil and gas containment. These materials are critical in preventing leachate seepage, conserving groundwater, and supporting zero-waste policies
• Government tenders and infrastructure standards are increasingly specifying geosynthetics in design and procurement frameworks. This formal acknowledgment is elevating market visibility and encouraging investment in manufacturing capacity across the region
• For instance, in 2022, the Egyptian government launched a national geotechnical initiative requiring the use of geosynthetics in all major road construction projects. This move not only improved construction efficiency but also reduced long-term maintenance expenditures by over 20% according to project reports
• As infrastructure spending accelerates and environmental goals rise in priority, demand for geosynthetics is expected to grow consistently. Stakeholders will need to focus on localized product solutions, training for engineers and contractors, and collaboration with regulatory authorities to sustain market momentum
Restraint/Challenge
High Installation Costs and Limited Technical Expertise in Remote Regions
• Despite their long-term benefits, the upfront cost of geosynthetic materials and their installation remains a challenge, particularly in price-sensitive or resource-constrained countries. Budget limitations in several African nations restrict the adoption of high-performance geosynthetics, especially for public sector projects without international funding or donor support
• Installation of geosynthetics requires skilled labor and precise techniques to ensure performance outcomes. However, several regions in the Middle East and Africa face a shortage of trained personnel, which often results in suboptimal application and premature system failures. This hampers trust in the technology and slows market penetration
• Logistical and supply chain constraints also affect timely material availability in remote or landlocked areas. High transport costs, customs delays, and inconsistent distributor networks make it difficult to execute projects on schedule and within budget
• For instance, in 2023, infrastructure contractors in Ethiopia and Uganda reported delays in highway stabilization projects due to a lack of qualified installers and challenges sourcing geogrids, impacting project timelines and inflating costs by over 15%
• While training programs and localized manufacturing can address these issues, industry collaboration is essential to build sustainable supply chains and technical knowledge. Promoting awareness about lifecycle savings and creating regional hubs for geosynthetics expertise will be key to overcoming these barriers
Middle East and Africa Geosynthetics Market Scope
The market is segmented on the basis of product type into geotextiles, geomembranes, geogrids, geocells, geonets, and others.
- By Product
On the basis of product, the Middle East and Africa geosynthetics market is segmented into geotextiles, geomembranes, geogrids, geocells, geonets, and others. The geotextiles segment dominated the market with the largest revenue share in 2024, primarily due to their widespread application in road construction, landfills, and erosion control. Their cost-effectiveness, filtration properties, and soil stabilization capabilities make them a preferred material in infrastructure and environmental projects across arid and semi-arid zones. Increasing road development and urban expansion across the region further support the segment’s strong demand.
The geomembranes segment is expected to witness the fastest growth rate from 2025 to 2032, fueled by rising adoption in water containment, mining, and waste management applications. These impermeable liners are critical in controlling seepage and contamination, especially in water-scarce environments where groundwater protection is essential. As environmental regulations tighten and the need for sustainable infrastructure rises, the demand for geomembranes continues to surge across Middle Eastern and African markets.
Middle East and Africa Geosynthetics Market Regional Analysis
- Saudi Arabia dominates the Middle East and Africa geosynthetics market, accounting for the largest revenue share in 2024, owing to its aggressive infrastructure development initiatives under Vision 2030
- The country’s focus on mega-projects such as NEOM, The Line, and large-scale transportation corridors is significantly boosting the demand for advanced geosynthetic solutions in soil reinforcement, drainage, and environmental containment
- Public sector support, combined with regulatory mandates to integrate sustainable materials, is encouraging widespread use of geomembranes in landfills, geotextiles in roads, and geonets in water management systems
- In addition, collaborations with international engineering firms and technology providers are improving local execution capabilities and product innovation
- As Saudi Arabia continues to prioritize ecological sustainability alongside urban transformation, the geosynthetics market is expected to play a critical role in ensuring infrastructure durability, reducing environmental risks, and improving project efficiency across multiple sectors
South Africa Geosynthetics Market Insight
South Africa is expected to witness the fastest growth rate from 2025 to 2032, driven by increasing infrastructure rehabilitation, mining activity, and environmental protection initiatives. The government's growing focus on upgrading roadways, landfills, and water management systems is boosting the demand for geotextiles, geomembranes, and geogrids. In addition, the adoption of sustainable construction practices and the rising need for erosion control and soil stabilization in both urban and rural development projects are expected to support strong market growth in South Africa over the forecast period.
Middle East and Africa Geosynthetics Market Share
The Middle East and Africa Geosynthetics industry is primarily led by well-established companies, including:
• Mattex Group (Saudi Arabia)
• Fibertex Nonwovens A/S (South Africa)
• Africor Construction and Civils (South Africa)
• Geotextiles Africa (South Africa)
• TenCate Geosynthetics Middle East (U.A.E)
• Kaytech Engineered Fabrics (South Africa)
• Atarfil Middle East FZ-LLC (U.A.E)
• Naue GmbH & Co. KG – Middle East Division (U.A.E)
• Maccaferri Middle East (U.A.E.)
• Solmax Middle East (Saudi Arabia)
Latest Developments in Middle East and Africa Geosynthetics Market
- In March 2023, Maccaferri played a key role in the completion of Tanzania's major rail infrastructure by providing an innovative soil erosion control solution. This development enhances regional connectivity to global markets and supports sustainable infrastructure. The company’s involvement is expected to strengthen its market presence and drive revenue growth in the Middle East and Africa geosynthetics sector
- In March 2022, Freudenberg Performance Materials announced a phased price increase for its roofing products in the building and construction sector. Effective April 1, 2022, prices rose by 9%, followed by an additional 6% increase on May 1, 2022. This adjustment was made to offset rising production costs and maintain quality standards, potentially improving profit margins and supporting the company's long-term market competitiveness
SKU-

- Interactive Data Analysis Dashboard
- Company Analysis Dashboard for high growth potential opportunities
- Research Analyst Access for customization & queries
- Competitor Analysis with Interactive dashboard
- Latest News, Updates & Trend analysis
- Harness the Power of Benchmark Analysis for Comprehensive Competitor Tracking
Middle East And Africa Geosynthetics Market, Supply Chain Analysis and Ecosystem Framework
To support market growth and help clients navigate the impact of geopolitical shifts, DBMR has integrated in-depth supply chain analysis into its Middle East And Africa Geosynthetics Market research reports. This addition empowers clients to respond effectively to global changes affecting their industries. The supply chain analysis section includes detailed insights such as Middle East And Africa Geosynthetics Market consumption and production by country, price trend analysis, the impact of tariffs and geopolitical developments, and import and export trends by country and HSN code. It also highlights major suppliers with data on production capacity and company profiles, as well as key importers and exporters. In addition to research, DBMR offers specialized supply chain consulting services backed by over a decade of experience, providing solutions like supplier discovery, supplier risk assessment, price trend analysis, impact evaluation of inflation and trade route changes, and comprehensive market trend analysis.
Data collection and base year analysis are done using data collection modules with large sample sizes. The stage includes obtaining market information or related data through various sources and strategies. It includes examining and planning all the data acquired from the past in advance. It likewise envelops the examination of information inconsistencies seen across different information sources. The market data is analysed and estimated using market statistical and coherent models. Also, market share analysis and key trend analysis are the major success factors in the market report. To know more, please request an analyst call or drop down your inquiry.
The key research methodology used by DBMR research team is data triangulation which involves data mining, analysis of the impact of data variables on the market and primary (industry expert) validation. Data models include Vendor Positioning Grid, Market Time Line Analysis, Market Overview and Guide, Company Positioning Grid, Patent Analysis, Pricing Analysis, Company Market Share Analysis, Standards of Measurement, Global versus Regional and Vendor Share Analysis. To know more about the research methodology, drop in an inquiry to speak to our industry experts.
Data Bridge Market Research is a leader in advanced formative research. We take pride in servicing our existing and new customers with data and analysis that match and suits their goal. The report can be customized to include price trend analysis of target brands understanding the market for additional countries (ask for the list of countries), clinical trial results data, literature review, refurbished market and product base analysis. Market analysis of target competitors can be analyzed from technology-based analysis to market portfolio strategies. We can add as many competitors that you require data about in the format and data style you are looking for. Our team of analysts can also provide you data in crude raw excel files pivot tables (Fact book) or can assist you in creating presentations from the data sets available in the report.


