
Middle East And Africa Inorganic Scintillators Market
Market Size in USD Million
 USD
9.33 Million
USD
12.09 Million
2025
2033
USD
9.33 Million
USD
12.09 Million
2025
2033
| 2026 - 2033 | |
| USD 9.33 Million | |
| USD 12.09 Million | |
| % | |
|
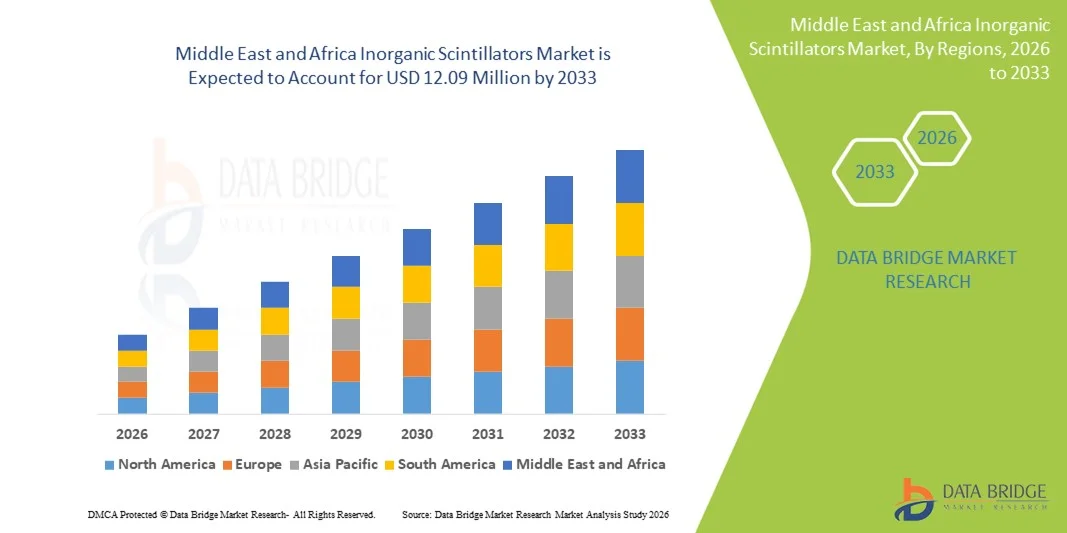
Middle East and Africa Inorganic Scintillators Market Size
- The Middle East and Africa inorganic scintillators market size was valued at USD 9.33 million in 2025 and is expected to reach USD 12.09 million by 2033, at a CAGR of 3.3% during the forecast period
- The market growth is largely fueled by increasing adoption of advanced radiation detection and imaging technologies across healthcare security, and industrial applications, coupled with expanding investments in nuclear safety, defense infrastructure, and research facilities
- Furthermore, rising demand for precise diagnostic systems, enhanced radiation monitoring solutions, and government-led initiatives to strengthen security and healthcare infrastructure is creating strong pull for inorganic scintillators throughout the region. These converging factors are accelerating the uptake of inorganic scintillator solutions, thereby significantly boosting the industry’s growth
Middle East and Africa Inorganic Scintillators Market Analysis
- Inorganic scintillators, used for detecting and measuring ionizing radiation, are increasingly vital components in healthcare, security, and industrial applications across the Middle East and Africa due to their high detection efficiency, precision, and compatibility with advanced imaging and monitoring systems
- The escalating demand for inorganic scintillators is primarily fueled by growing investments in healthcare diagnostics, nuclear safety, defense infrastructure, and industrial radiation monitoring, along with increasing government initiatives to enhance security and research capabilities
- Saudi Arabia dominated the Middle East and Africa inorganic scintillators market with the largest revenue share of 28.5% in 2025, characterized by substantial government funding, adoption of advanced medical imaging systems, and the presence of regional distributors and key industry players supporting localized production and deployment of scintillator-based solutions
- UAE is expected to be the fastest growing country in the market during the forecast period due to rising investments in healthcare, energy, and security infrastructure, along with increasing adoption of radiation monitoring systems
- Cesium iodide (CsI) segment dominated the inorganic scintillators market with a market share of 38.7% in 2025, driven by its high light yield, reliability in medical imaging, and compatibility with various radiation detection systems
Report Scope and Middle East and Africa Inorganic Scintillators Market Segmentation
|
Attributes |
Middle East and Africa Inorganic Scintillators Key Market Insights |
|
Segments Covered |
|
|
Countries Covered |
Middle East and Africa
|
|
Key Market Players |
|
|
Market Opportunities |
|
|
Value Added Data Infosets |
In addition to the insights on market scenarios such as market value, growth rate, segmentation, geographical coverage, and major players, the market reports curated by the Data Bridge Market Research also include in-depth expert analysis, patient epidemiology, pipeline analysis, pricing analysis, and regulatory framework |
Middle East and Africa Inorganic Scintillators Market Trends
Integration with Advanced Medical Imaging and Security Systems
- A significant and accelerating trend in the Middle East and Africa inorganic scintillators market is the increasing integration with advanced medical imaging systems and industrial radiation monitoring platforms, enhancing detection accuracy and operational efficiency
- For instance, the Saudi Arabian King Faisal Specialist Hospital deployed high-performance cesium iodide (CsI) scintillators in PET-CT scanners, improving diagnostic precision and reducing scan times
- Integration with automated radiation monitoring systems enables features such as real-time dose tracking, predictive maintenance alerts, and enhanced imaging resolution for nuclear facilities, offering more intelligent and reliable performance
- The seamless compatibility of inorganic scintillators with digital imaging platforms and industrial safety systems facilitates centralized monitoring, allowing hospitals and nuclear plants to manage multiple sensors and devices through a unified interface
- This trend toward more precise, automated, and interconnected scintillator systems is reshaping operational standards in healthcare and security, with companies such as Saint-Gobain Crystals developing solutions optimized for AI-assisted imaging and radiation monitoring applications
- The demand for scintillators that integrate with advanced imaging and monitoring solutions is growing rapidly across hospitals, research centers, and nuclear facilities, as organizations increasingly prioritize accuracy and system interoperability
- In addition, partnerships between nuclear facilities and international suppliers are enabling the deployment of next-generation scintillator arrays, improving radiation safety and operational efficiency
Middle East and Africa Inorganic Scintillators Market Dynamics
Driver
Rising Adoption in Healthcare Diagnostics and Nuclear Applications
- The increasing prevalence of advanced medical diagnostics and expansion of nuclear energy and security infrastructure is a significant driver for the growing demand for inorganic scintillators
- For instance, in March 2025, UAE’s Barakah Nuclear Power Plant integrated cesium iodide and gadolinium-based scintillators in radiation detection units to enhance monitoring efficiency and safety compliance
- As hospitals, laboratories, and nuclear facilities seek higher precision in imaging and radiation detection, inorganic scintillators offer superior sensitivity, faster response times, and better energy resolution than traditional detectors
- Furthermore, government initiatives to upgrade healthcare infrastructure and strengthen security monitoring are making inorganic scintillators an essential component in national diagnostic and radiation safety programs
- The ability to detect and quantify radiation accurately, combined with compatibility with automated monitoring and reporting systems, is key to driving adoption in both medical and industrial applications
- For instance, increased deployment of portable scintillator devices in border security and customs operations in Saudi Arabia and UAE is driving market growth
- Rising collaborations between regional research institutions and global scintillator manufacturers are accelerating R&D for high-performance materials tailored to Middle East and Africa conditions
Restraint/Challenge
High Material Costs and Technical Expertise Requirements
- The relatively high production cost of inorganic scintillators and the need for specialized technical expertise in handling and installation pose significant challenges to broader market penetration
- For instance, high-purity cesium iodide crystals used in advanced PET-CT scanners and security detectors require precise manufacturing and quality control, limiting accessibility for smaller hospitals or facilities in developing regions
- Addressing these challenges through local manufacturing, technology transfer, and training programs is crucial for increasing adoption across the region. Companies such as Saint-Gobain Crystals and Hamamatsu emphasize supply chain support and technical assistance to facilitate market growth
- In addition, limited availability of skilled technicians to calibrate, maintain, and operate complex scintillator-based systems can hinder deployment in some countries
- While prices and technical barriers are gradually improving with regional partnerships and innovations, the initial investment and expertise requirements remain key constraints, particularly for smaller healthcare providers and industrial facilities
- For instance, high installation costs for multi-detector PET and SPECT systems in Egypt and South Africa restrict adoption in private hospitals and research labs
- Complex regulatory approvals and import licensing requirements for high-purity scintillator materials in certain Middle Eastern and African countries can delay market entry and affect supply chain reliability
Middle East and Africa Inorganic Scintillators Market Scope
The market is segmented on the basis of material, type, application, and end user.
- By Scintillation Material
On the basis of scintillation material, the market is segmented into Sodium Iodide (NaI), Cesium Iodide (CsI), Lutetium Oxyorthosilicate (LSO) and Lutetium–Yttrium Oxyorthosilicate (LYSO), Bismuth Germanate (BGO), Barium Fluoride, Lead Tungstate (PbWO4), Cadmium Tungstate (CdWO4), Cerium Bromide (CeBr3), Lanthanum Bromide (LaBr3), Gadolinium Orthosilicate (GSO), Yttrium Aluminum Garnet YAG (Ce), Gadolinium Oxysulfide (GOS), and Other Scintillation Materials. The Cesium Iodide (CsI) segment dominated the market with the largest revenue share of 38.7% in 2025, driven by its high light yield, excellent detection efficiency, and wide use in medical imaging systems such as PET and SPECT scanners. Hospitals in Saudi Arabia and UAE prefer CsI due to its cost-effectiveness compared with other high-performance materials and its compatibility with digital imaging systems. The material’s versatility in radiation detection across healthcare, nuclear facilities, and industrial safety applications further strengthens its dominance. Strong regional supply chains and established manufacturer presence also contribute to market leadership.
The Cerium Bromide (CeBr3) segment is anticipated to witness the fastest growth from 2026 to 2033, fueled by increasing adoption in advanced nuclear detection and homeland security applications. CeBr3 offers superior energy resolution, fast decay time, and lower intrinsic radioactivity, making it highly suitable for precise radiation monitoring. Its growing usage in border security, portable radiation detectors, and research facilities in the Middle East and Africa is expanding rapidly. In addition, collaborations between regional nuclear authorities and global suppliers are accelerating the deployment of CeBr3-based detectors, further driving its adoption.
- By Type
On the basis of type, the market is segmented into alkali halides, oxide compounds, and rare earth metals. The Alkali Halides segment dominated the market with the largest revenue share in 2025 due to its cost-effectiveness, high scintillation efficiency, and long-standing adoption in medical imaging and nuclear monitoring. Sodium Iodide (NaI) and Cesium Iodide (CsI) crystals, key components of this segment, are widely used in hospitals, nuclear power plants, and industrial radiation monitoring applications. Their adaptability to various detector configurations and compatibility with existing imaging equipment contributes to sustained demand.
The Rare Earth Metals segment is expected to witness the fastest growth from 2026 to 2033, driven by increasing investments in advanced PET imaging systems, homeland security, and high-performance industrial radiation detectors. Materials such as LSO, LYSO, and GSO offer high light yield, excellent timing resolution, and enhanced radiation tolerance, making them ideal for precision applications. Rapid adoption in research facilities, nuclear energy projects, and medical centers in UAE and South Africa is supporting growth.
- By Application
On the basis of application, the market is segmented into medical imaging, nuclear medicine, radioprotection, oil exploration, process industry, life sciences, and others. The Medical Imaging segment dominated the market in 2025, attributed to the widespread deployment of PET, SPECT, and CT imaging systems in hospitals and diagnostic centers across Saudi Arabia, UAE, and South Africa. Inorganic scintillators are critical for high-resolution imaging, enabling accurate diagnosis and early disease detection. The growing focus on advanced diagnostic services, coupled with government healthcare investments, supports the continued dominance of this application.
The Radioprotection segment is anticipated to witness the fastest growth from 2026 to 2033, driven by expanding nuclear energy projects and stricter workplace radiation safety regulations in the Middle East and Africa. Facilities in UAE, Saudi Arabia, and Egypt are increasingly adopting scintillator-based systems for environmental monitoring and occupational safety. The rising use of portable radiation detectors for mining, border security, and industrial applications further propels growth in this segment.
- By End User
On the basis of end user, the market is segmented into healthcare, homeland security and defense, nuclear power plants, industrial applications, and others. The Healthcare segment dominated the market with the largest revenue share in 2025, fueled by the rapid expansion of hospitals and diagnostic imaging centers in Saudi Arabia, UAE, and South Africa. Hospitals and clinics increasingly deploy PET, SPECT, and CT scanners with inorganic scintillators for precise disease diagnosis and treatment planning. Strong government healthcare initiatives and rising investments in advanced imaging technologies further support the dominance of this end-user segment.
The Homeland Security and Defense segment is expected to witness the fastest growth from 2026 to 2033, driven by increasing adoption of portable radiation detectors, border security monitoring systems, and nuclear threat detection units in UAE, Saudi Arabia, and Egypt. Rising security concerns, coupled with collaborations with global scintillator manufacturers, are accelerating the deployment of high-performance inorganic scintillator-based solutions. The integration of advanced materials such as CeBr3 and LYSO in defense and security applications further fuels segment growth.
Middle East and Africa Inorganic Scintillators Market Regional Analysis
- Saudi Arabia dominated the Middle East and Africa inorganic scintillators market with the largest revenue share of 28.5% in 2025, characterized by substantial government funding, adoption of advanced medical imaging systems, and the presence of regional distributors and key industry players supporting localized production and deployment of scintillator-based solutions
- Hospitals, diagnostic centers, and nuclear facilities in the region highly value the precision, reliability, and high detection efficiency offered by inorganic scintillators, which are critical for accurate medical imaging, nuclear safety, and industrial applications
- This widespread adoption is further supported by government initiatives to strengthen healthcare and security infrastructure, collaborations with global scintillator manufacturers, and increasing deployment of PET, SPECT, and CT imaging systems, establishing inorganic scintillators as the preferred choice across both healthcare and industrial sectors
The Saudi Arabia Inorganic Scintillators Market Insight
The Saudi Arabia inorganic scintillators market captured the largest revenue share of 28.5% in 2025, fueled by substantial investments in advanced medical imaging, nuclear energy, and industrial radiation monitoring. Hospitals, diagnostic centers, and nuclear facilities are increasingly prioritizing high-performance scintillators for PET, SPECT, and CT imaging systems. The growing focus on healthcare infrastructure development, coupled with government initiatives to strengthen radiation safety and security, is significantly propelling market growth. Moreover, collaborations with global scintillator manufacturers are enabling access to cutting-edge materials such as CsI and LYSO, further expanding adoption across healthcare and industrial applications.
UAE Inorganic Scintillators Market Insight
The UAE inorganic scintillators market is expected to grow at a substantial CAGR during the forecast period, driven by rising investments in medical diagnostics, nuclear safety, and homeland security. The country is witnessing rapid deployment of advanced PET and SPECT imaging systems in hospitals and research centers, creating strong demand for high-resolution scintillators. Government-led nuclear projects and stringent radiation safety regulations are further boosting adoption. In addition, UAE-based institutions are increasingly integrating scintillator-based radiation detectors into border security and industrial monitoring systems, ensuring comprehensive utilization across sectors.
South Africa Inorganic Scintillators Market Insight
The South Africa inorganic scintillators market is anticipated to expand at a noteworthy CAGR during the forecast period, fueled by growing adoption in healthcare, mining, and industrial radiation monitoring applications. Hospitals and imaging centers are deploying high-performance CsI and CeBr3 scintillators to improve diagnostic accuracy, while mining and industrial sectors increasingly rely on scintillator-based radiation detectors for safety compliance. Furthermore, partnerships between local distributors and global manufacturers are facilitating technology transfer, training, and supply chain efficiency, driving market expansion across the country.
Egypt Inorganic Scintillators Market Insight
The Egypt inorganic scintillators market is expected to grow at a considerable CAGR during the forecast period, supported by increasing investments in medical infrastructure and industrial radiation monitoring. Hospitals and diagnostic centers are expanding their imaging capabilities with high-sensitivity scintillators, while nuclear research facilities and industrial plants adopt these materials for precise radiation detection. Government initiatives to improve healthcare services, along with collaborations with international suppliers, are further encouraging adoption. The focus on cost-effective yet high-performance scintillators is helping Egypt emerge as a growing market within the region.
Middle East and Africa Inorganic Scintillators Market Share
The Middle East and Africa Inorganic Scintillators industry is primarily led by well-established companies, including:
- Hamamatsu Photonics K.K. (Japan)
- Hitachi High Tech Corporation (Japan)
- Mirion Technologies, Inc. (U.S.)
- Dynasil Corporation (U.S.)
- Scintacor (U.K.)
- Epic Crystal Co.,Ltd (China)
- Alpha Spectra, Inc. (U.S.)
- Radiation Monitoring Devices, Inc. (U.S.)
- Kromek Group plc (U.K.)
- Toshiba Materials Co., Ltd. (Japan)
- Scionix Holland B.V. (Netherlands)
- Hitachi Metals, Ltd. (Japan)
- Saint Gobain S.A. (France)
- Crytur a.s. (Czech Republic)
- Detec Electronic (Germany)
- Rexon Components, Inc. (U.S.)
- Eljen Technology (U.S.)
- Photonic Materials Ltd. (U.K.)
- Hilger Crystals Ltd. (U.K.)
What are the Recent Developments in Middle East and Africa Inorganic Scintillators Market?
- In October 2025, Siemens Healthineers showcased its expanded diagnostic imaging portfolio, including advanced PET/CT systems and related technologies, at the Global Health Exhibition in Riyadh a major regional event highlighting medical imaging technologies often dependent on inorganic scintillators for gamma‑ray detection
- In June 2025, the Saudi Nuclear and Radiological Regulatory Commission announced that “no radioactive effects were detected” in Saudi Arabia and the Gulf following regional tensions underscoring the active role of radiological monitoring in national safety screening and environmental surveillance
- In June 2025, Nairobi West Hospital in Kenya announced it had started local production of radioactive isotopes after acquiring a cyclotron machine, enabling locally generated tracers for PET/CT scans and significantly reducing delays in advanced nuclear medicine imaging services a key boost for radiation detection and diagnostic capabilities in the region
- In February 2025, the International Atomic Energy Agency (IAEA) and the Jordanian Government inaugurated a new advanced PET‑CT scanner at Al‑Bashir Hospital in Amman, significantly expanding access to nuclear medicine diagnostic services and improving early cancer detection in public healthcare increasing deployment of scintillator‑dependent imaging technology
- In May 2024, industry analysis highlighted rapid growth in nuclear medicine and radioisotope demand in Saudi Arabia and the Middle East, signaling increased adoption of imaging modalities (PET/SPECT) that rely on inorganic scintillators for radiation detection
SKU-

- Interactive Data Analysis Dashboard
- Company Analysis Dashboard for high growth potential opportunities
- Research Analyst Access for customization & queries
- Competitor Analysis with Interactive dashboard
- Latest News, Updates & Trend analysis
- Harness the Power of Benchmark Analysis for Comprehensive Competitor Tracking
Data collection and base year analysis are done using data collection modules with large sample sizes. The stage includes obtaining market information or related data through various sources and strategies. It includes examining and planning all the data acquired from the past in advance. It likewise envelops the examination of information inconsistencies seen across different information sources. The market data is analysed and estimated using market statistical and coherent models. Also, market share analysis and key trend analysis are the major success factors in the market report. To know more, please request an analyst call or drop down your inquiry.
The key research methodology used by DBMR research team is data triangulation which involves data mining, analysis of the impact of data variables on the market and primary (industry expert) validation. Data models include Vendor Positioning Grid, Market Time Line Analysis, Market Overview and Guide, Company Positioning Grid, Patent Analysis, Pricing Analysis, Company Market Share Analysis, Standards of Measurement, Global versus Regional and Vendor Share Analysis. To know more about the research methodology, drop in an inquiry to speak to our industry experts.
Data Bridge Market Research is a leader in advanced formative research. We take pride in servicing our existing and new customers with data and analysis that match and suits their goal. The report can be customized to include price trend analysis of target brands understanding the market for additional countries (ask for the list of countries), clinical trial results data, literature review, refurbished market and product base analysis. Market analysis of target competitors can be analyzed from technology-based analysis to market portfolio strategies. We can add as many competitors that you require data about in the format and data style you are looking for. Our team of analysts can also provide you data in crude raw excel files pivot tables (Fact book) or can assist you in creating presentations from the data sets available in the report.


