
Middle East And Africa Intraoperative Radiation Therapy Market
Market Size in USD Million
 USD
14.91 Million
USD
22.19 Million
2025
2033
USD
14.91 Million
USD
22.19 Million
2025
2033
| 2026 - 2033 | |
| USD 14.91 Million | |
| USD 22.19 Million | |
| % | |
|
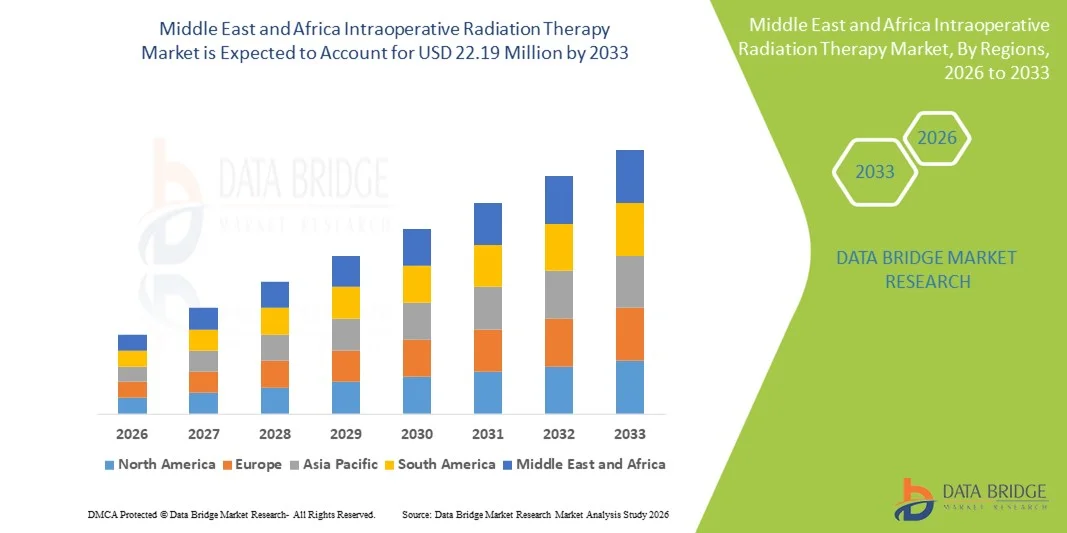
Middle East and Africa Intraoperative Radiation Therapy Market Size
- The Middle East and Africa intraoperative radiation therapy market size was valued at USD 14.91 million in 2025 and is expected to reach USD 22.19 million by 2033, at a CAGR of 5.1% during the forecast period
- The market growth in the region is largely fueled by increasing cancer incidence, rising healthcare expenditure, and gradual adoption of advanced radiotherapy technologies including electron IORT and other intraoperative radiation therapy systems
- Furthermore, improvements in clinical oncology infrastructure, greater awareness of targeted intraoperative treatments, and expanding hospital and specialty center capacity are driving stronger uptake of intraoperative radiation therapy in both established and emerging MEA healthcare markets. These converging factors are accelerating technology adoption and significantly boosting the region’s market growth
Middle East and Africa Intraoperative Radiation Therapy Market Analysis
- Intraoperative radiation therapy market, providing targeted radiation treatment during surgery, is becoming an increasingly vital component of modern cancer management in both hospital and specialty oncology center settings due to its precision, reduced treatment times, and ability to spare healthy tissues
- The escalating demand for the intraoperative radiation therapy primarily fueled by the rising incidence of cancer, increasing healthcare expenditure, and growing adoption of advanced radiotherapy technologies including electron beam and X-ray IORT systems
- Saudi Arabia dominated the Middle East and Africa intraoperative radiation therapy market with the largest revenue share of 35% in 2025, characterized by well-established healthcare infrastructure, government initiatives to expand oncology services, and the presence of key medical device providers driving adoption in tertiary hospitals and cancer centers
- South Africa is expected to be the fastest growing country in the Middle East and Africa intraoperative radiation therapy market during the forecast period due to increasing investment in oncology infrastructure, rising awareness of advanced cancer treatments, and expansion of specialized treatment centers
- Electron IORT segment dominated the Middle East and Africa intraoperative radiation therapy market with a market share of 52.9% in 2025, driven by its clinical precision, ease of integration into surgical procedures, and growing preference among oncologists for targeted intraoperative therapies
Report Scope and Middle East and Africa Intraoperative Radiation Therapy Market Segmentation
|
Attributes |
Middle East and Africa Intraoperative Radiation Therapy Key Market Insights |
|
Segments Covered |
|
|
Countries Covered |
Middle East and Africa
|
|
Key Market Players |
|
|
Market Opportunities |
|
|
Value Added Data Infosets |
In addition to the insights on market scenarios such as market value, growth rate, segmentation, geographical coverage, and major players, the market reports curated by the Data Bridge Market Research also include in-depth expert analysis, patient epidemiology, pipeline analysis, pricing analysis, and regulatory framework |
Middle East and Africa Intraoperative Radiation Therapy Market Trends
Advancements in Precision Oncology and Targeted Therapy
- A significant and accelerating trend in the Middle East and Africa intraoperative radiation therapy market is the adoption of precision oncology techniques that allow targeted radiation delivery during surgery, minimizing exposure to healthy tissues and improving patient outcomes
- For instance, the INTRABEAM system is being increasingly utilized in Saudi Arabian hospitals to deliver electron-based IORT for breast cancer, enabling high-precision intraoperative treatment within a single surgical session
- Integration with surgical navigation and imaging platforms enables real-time adjustments to radiation dose, improving accuracy and reducing complications. For instance, some hospitals in South Africa use advanced imaging-assisted IORT systems to optimize intraoperative dose delivery
- The ability to combine surgical resection with immediate radiation therapy streamlines treatment timelines and reduces the need for repeated hospital visits, offering significant patient convenience and clinical efficiency
- This trend towards more precise, integrated, and efficient IORT systems is reshaping clinical practices in oncology, driving hospitals and cancer centers to invest in advanced equipment and staff training
- The demand for intraoperative radiation therapy that offers precision, real-time dose control, and integration with surgical workflows is growing rapidly across both established and emerging MEA healthcare markets
- Collaborations between medical device companies and healthcare providers to develop portable and modular IORT systems are creating new opportunities, particularly in countries with limited oncology infrastructure
Middle East and Africa Intraoperative Radiation Therapy Market Dynamics
Driver
Rising Cancer Incidence and Adoption of Advanced Radiotherapy
- The increasing prevalence of cancer in MEA countries, coupled with the adoption of advanced radiotherapy technologies, is a significant driver for the growth of the Middle East and Africa intraoperative radiation therapy market
- For instance, in 2025, King Faisal Specialist Hospital in Saudi Arabia implemented new electron-based IORT systems to expand breast and colorectal cancer treatment capabilities, contributing to market growth
- As healthcare facilities aim to reduce post-operative recurrence and improve treatment outcomes, IORT systems provide high-precision radiation during surgery, reducing reliance on multiple external radiotherapy sessions
- Furthermore, government initiatives and rising healthcare expenditure in countries such as UAE and Egypt are accelerating the adoption of cutting-edge oncology technologies, including intraoperative radiation therapy
- The ability to integrate IORT into existing surgical workflows, combined with clinical benefits such as reduced radiation exposure and shorter treatment timelines, is driving the uptake of IORT across hospitals and specialized cancer centers
- Increasing collaboration between oncology centers and medical equipment manufacturers is enabling tailored IORT solutions that meet country-specific clinical and infrastructural needs
- Ongoing clinical studies demonstrating improved patient outcomes with IORT are encouraging hospitals and physicians to adopt these technologies more widely across the MEA region
Restraint/Challenge
High Capital Costs and Limited Awareness
- The high initial investment costs for intraoperative radiation therapy systems and the need for trained personnel pose a challenge to broader market penetration in the MEA region
- For instance, smaller hospitals in Egypt and other African countries may delay adoption due to budget constraints and limited access to specialized training programs for IORT operation
- The complexity of integrating IORT into standard surgical procedures and ensuring compliance with radiological safety standards requires careful planning and resource allocation. For instance, South African hospitals investing in new IORT systems must train surgeons, physicists, and technicians simultaneously to ensure safe operation
- Limited awareness among healthcare providers and patients regarding the clinical benefits of IORT can slow adoption, particularly in emerging MEA markets where traditional external beam radiotherapy is more established
- Overcoming these challenges through government subsidies, clinical education programs, and modular or scalable IORT solutions will be crucial for sustaining growth in the Middle East and Africa intraoperative radiation therapy market
- Maintenance and operational costs, including periodic calibration and radiation safety compliance, can further restrict adoption, particularly in lower-income MEA countries
- The need for strong partnerships with device manufacturers and training providers is critical, as lack of local technical support can hinder long-term adoption and market expansion
Middle East and Africa Intraoperative Radiation Therapy Market Scope
The market is segmented on the basis of method, product, type, application, end user, and distribution channel.
- By Method
On the basis of method, the Middle East and Africa intraoperative radiation therapy market is segmented into Electron IORT, Intraoperative Brachytherapy, High Dose-Rate IORT, X-Ray IORT, and Others. The Electron IORT segment dominated the market with the largest revenue share of 52.9% in 2025, driven by its precision in delivering radiation directly to the tumor site during surgery and reducing post-operative recurrence. Hospitals and specialty centers in Saudi Arabia and UAE prefer Electron IORT due to its established clinical efficacy, ease of integration into surgical workflows, and shorter treatment times. Moreover, Electron IORT systems are widely supported by ongoing clinical studies demonstrating improved patient outcomes. Its popularity is also attributed to compatibility with portable systems and modular OR setups, making it suitable for both established and emerging hospitals. Oncologists prefer it for breast, colorectal, and soft tissue cancers where accuracy and tissue sparing are critical. The segment continues to attract adoption due to its reliability, safety, and minimal patient downtime.
The Intraoperative Brachytherapy segment is anticipated to witness the fastest CAGR of 14.3% from 2026 to 2033, fueled by growing awareness of targeted therapy benefits and rising investments in oncology infrastructure in South Africa and Egypt. Brachytherapy is increasingly preferred for localized treatment of gynecological and genitourinary cancers, offering high-dose delivery with minimal exposure to healthy tissues. Hospitals are adopting modern applicators and planning systems that simplify procedure workflows, increasing adoption in specialty centers. Improved training programs and cost-effective systems in emerging MEA countries are accelerating growth. The technique allows flexibility in dose customization, enhancing clinical outcomes. For instance, South African hospitals are expanding its use for cervical and prostate cancers, driving rapid adoption.
- By Product
On the basis of product, the Middle East and Africa intraoperative radiation therapy market is segmented into intraoperative radiation therapy devices, intraoperative radiation therapy accessories, and software & services. The Intraoperative Radiation Therapy Devices segment dominated the market with the largest revenue share of 61% in 2025, driven by its critical role in delivering high-precision radiation during surgery. Devices include both portable and benchtop systems that are increasingly integrated into hybrid ORs, offering real-time monitoring and dose adjustment. Hospitals in Saudi Arabia, UAE, and South Africa are investing in devices capable of treating multiple cancer types, including breast, colorectal, and soft tissue sarcomas. Regulatory approvals and growing clinical evidence supporting safety and efficacy further strengthen this segment. High reliability, low downtime, and vendor support are additional factors contributing to dominance. Devices also enable hospitals to reduce post-operative radiotherapy sessions, enhancing patient convenience.
The Software & Services segment is expected to witness the fastest CAGR of 15% from 2026 to 2033, driven by the increasing adoption of advanced treatment planning software, imaging integration, and post-procedure analytics. Software services enable accurate dose calculation, patient-specific planning, and remote monitoring of IORT sessions. Hospitals and specialty centers are leveraging analytics and cloud-based platforms to optimize workflow efficiency and treatment quality. Expansion of training and maintenance services by medical device providers in emerging MEA countries is further boosting adoption. For instance, Egyptian cancer centers are implementing software-assisted planning to reduce surgical errors. Software integration also enables hospitals to track outcomes and improve overall patient management.
- By Type
On the basis of type, the Middle East and Africa intraoperative radiation therapy market is segmented into Portable and Benchtop. The Portable segment dominated the market with the largest revenue share of 57% in 2025, attributed to its flexibility in deployment across multiple operating rooms and ease of relocation between hospitals and surgical centers. Portable IORT systems are preferred in hospitals with space constraints and for facilities that handle multiple cancer types with limited OR availability. Saudi Arabian and South African hospitals are increasingly adopting portable units due to lower setup costs and minimal infrastructural modifications required. The ability to treat patients immediately post-resection without moving them to another room is a key factor driving adoption. Portability also reduces patient wait times and enhances procedural efficiency. Portable systems are compatible with both electron and X-ray IORT methods, further increasing adoption.
The Benchtop segment is anticipated to witness the fastest CAGR of 13.5% from 2026 to 2033, fueled by its precision and suitability for high-volume cancer centers with dedicated IORT suites. Benchtop systems are favored for complex procedures requiring integrated imaging and real-time dosimetry. Growing awareness of their clinical efficacy for gynecological and pediatric tumors in MEA countries is supporting faster adoption. For instance, hospitals in UAE are expanding benchtop units for multi-cancer applications. These systems provide stable radiation sources, ensuring high reproducibility of treatment. Benchtop IORT is also preferred where permanent OR infrastructure allows seamless integration with imaging devices.
- By Application
On the basis of application, the Middle East and Africa intraoperative radiation therapy market is segmented into breast cancer, brain tumor, head & neck cancer, soft tissue sarcoma, pediatric tumors, gynecological cancer, genitourinary cancers, upper gastro-intestinal tumors, and other cancer. The Breast Cancer segment dominated the market with the largest revenue share of 48% in 2025, driven by the high prevalence of breast cancer in Saudi Arabia and UAE and the ability of IORT to deliver a single high-dose treatment during surgery. Hospitals prefer IORT for early-stage breast tumors to reduce the number of post-operative radiotherapy sessions, enhancing patient convenience and compliance. Breast cancer treatment is a major focus in both public and private hospitals, contributing to high device utilization rates. Clinical evidence supporting favorable outcomes, reduced recurrence, and minimal complications is further driving adoption. Portable and benchtop devices are increasingly used for intraoperative breast therapy. Hospitals also leverage hybrid ORs to streamline surgery and radiation delivery in a single session.
The Gynecological Cancer segment is expected to witness the fastest CAGR of 15% from 2026 to 2033, fueled by increasing awareness of IORT for cervical and ovarian cancers in South Africa and Egypt. Specialized surgical centers are adopting electron and brachytherapy IORT techniques for targeted intraoperative delivery. Rising investments in women’s health and cancer awareness campaigns are supporting faster adoption. For instance, oncology centers in Egypt are expanding the use of IORT in gynecological surgeries. Improved training and adoption of modern applicators are accelerating growth. The segment benefits from the growing number of hospitals with hybrid ORs that can accommodate gynecological procedures.
- By End User
On the basis of end user, the Middle East and Africa intraoperative radiation therapy market is segmented into hospital, ambulatory surgical centers, specialty center, and others. The Hospital segment dominated the market with the largest revenue share of 62% in 2025, driven by the presence of well-established oncology departments, availability of trained surgical teams, and the need to manage multiple cancer types under a single roof. Large hospitals in Saudi Arabia, UAE, and South Africa prefer IORT devices for multi-cancer treatment capabilities. Hospitals also invest in hybrid ORs that combine surgery and radiation delivery, increasing device utilization rates. The ability to provide immediate post-resection treatment reduces patient hospital visits, improving operational efficiency. Hospitals benefit from vendor-supported installation, training, and maintenance services, further strengthening adoption.
The Specialty Center segment is anticipated to witness the fastest CAGR of 16% from 2026 to 2033, fueled by the rising number of dedicated cancer centers in MEA countries focusing on breast, brain, and soft tissue cancers. Specialty centers benefit from portable and benchtop systems for targeted delivery and clinical flexibility. For instance, South African oncology centers are increasingly adopting IORT to enhance patient throughput and treatment quality. Specialty centers also provide focused care with shorter wait times, attracting more patients. Collaboration with device manufacturers ensures consistent technical support.
- By Distribution Channel
On the basis of distribution channel, the Middle East and Africa intraoperative radiation therapy market is segmented into direct tender and retail sales. The Direct Tender segment dominated the market with the largest revenue share of 70% in 2025, driven by government hospital procurement policies, bulk purchasing agreements, and strategic partnerships with device manufacturers. Hospitals in Saudi Arabia and UAE prefer direct tenders for cost efficiency, guaranteed maintenance, and regulatory compliance. Direct tender purchases also ensure training and installation support from manufacturers, facilitating faster adoption. Direct tenders enable hospitals to access high-end portable and benchtop systems. Bulk procurement reduces per-unit costs, increasing adoption in public hospitals. Vendor-led support ensures smooth implementation and minimal downtime.
The Retail Sales segment is expected to witness the fastest CAGR of 14% from 2026 to 2033, fueled by growing private hospital expansions, specialty cancer centers, and smaller clinics acquiring portable IORT systems. Retail sales allow flexible procurement for emerging MEA markets with limited capital expenditure budgets. For instance, private oncology centers in Egypt and South Africa are increasingly purchasing systems via retail channels to expand treatment offerings. Retail purchases are particularly favored by specialty centers seeking quick deployment. Access to technical support and optional service contracts enhances adoption. Retail channels allow smaller hospitals to gradually invest in advanced IORT technology without heavy upfront costs.
Middle East and Africa Intraoperative Radiation Therapy Market Regional Analysis
- Saudi Arabia dominated the Middle East and Africa intraoperative radiation therapy market with the largest revenue share of 35% in 2025, characterized by well-established healthcare infrastructure, government initiatives to expand oncology services, and the presence of key medical device providers driving adoption in tertiary hospitals and cancer centers
- Hospitals and specialty centers in the country highly value the clinical precision, workflow efficiency, and reduced post-operative radiotherapy requirements offered by IORT systems, particularly for breast, colorectal, and soft tissue cancers
- This widespread adoption is further supported by strong government support, advanced medical training programs, and partnerships with leading medical device manufacturers, establishing IORT as a preferred solution for both public and private healthcare facilities
The Saudi Arabia Intraoperative Radiation Therapy Market Insight
The Saudi Arabia intraoperative radiation therapy market captured the largest revenue share of 35% in 2025, driven by a well-established healthcare infrastructure, rising prevalence of cancer, and government initiatives to expand oncology services. Hospitals and specialty centers are increasingly adopting IORT systems for breast, colorectal, and soft tissue cancers due to their clinical precision and ability to deliver radiation immediately post-resection. The growing preference for advanced, targeted cancer treatments, coupled with ongoing collaborations with leading medical device providers, is propelling market growth. Moreover, the integration of portable and benchtop IORT systems into surgical workflows is enhancing procedural efficiency and patient outcomes. The country’s focus on modernizing healthcare facilities and investing in hybrid ORs further accelerates adoption.
South Africa Intraoperative Radiation Therapy Market Insight
The South Africa intraoperative radiation therapy is expected to grow at the fastest CAGR during the forecast period. Rising cancer awareness, expansion of specialty oncology centers, and increasing investment in advanced radiotherapy technologies are driving adoption. Hospitals and cancer centers are adopting portable and benchtop IORT systems to enhance surgical precision, streamline treatment timelines, and reduce patient hospital visits. For instance, breast, brain, and gynecological cancer treatments are increasingly performed using integrated IORT workflows. The growing collaboration between medical device manufacturers and hospitals is improving training, technical support, and clinical outcomes. South Africa’s focus on improving oncology infrastructure positions IORT as a key treatment modality across public and private healthcare sectors.
UAE Middle East and Africa Intraoperative Radiation Therapy Market Insight
The UAE intraoperative radiation therapy market is witnessing steady growth due to government-backed healthcare modernization programs and rising demand for advanced cancer care. The adoption of IORT in UAE hospitals is fueled by the need for precision radiation therapy that reduces post-operative radiotherapy sessions and improves patient convenience. Hospitals and specialty centers are integrating portable and benchtop IORT systems with imaging and surgical suites to optimize treatment delivery. For instance, breast and gynecological cancers are increasingly treated using advanced intraoperative radiation systems. The country’s focus on healthcare innovation, high disposable healthcare budgets, and partnerships with leading global IORT providers are supporting market expansion.
Egypt Intraoperative Radiation Therapy Market Insight
The Egypt intraoperative radiation therapy market accounted for 12% of revenue in 2025, driven by growing oncology awareness and the expansion of specialized cancer centers. Hospitals in Egypt are adopting IORT systems for breast, gynecological, and genitourinary cancers due to their precision and ability to reduce the number of post-operative radiotherapy visits. For instance, modern portable and benchtop systems are being implemented in hybrid ORs to improve workflow efficiency and patient outcomes. Rising investments from both government and private healthcare sectors, along with clinical training initiatives for oncologists and technicians, are further propelling adoption. Increased collaborations with global IORT equipment manufacturers are enabling wider deployment in emerging hospitals. The market growth is also supported by initiatives aimed at improving access to advanced cancer therapies in underserved regions.
Middle East and Africa Intraoperative Radiation Therapy Market Share
The Middle East and Africa Intraoperative Radiation Therapy industry is primarily led by well-established companies, including:
- Elekta AB (Sweden)
- IntraOp Medical, Inc. (U.S.)
- Carl Zeiss Meditec AG (Germany)
- Eckert & Ziegler AG (Germany)
- iCAD, Inc. (U.S.)
- Sensus Healthcare, Inc. (U.S.)
- Ariane Medical Systems Ltd (U.K.)
- GMV Innovating Solutions S.L. (Spain)
- Ion Beam Applications SA (Belgium)
- IsoRay, Inc. (U.S.)
- Brainlab AG (Germany)
- Mevion Medical Systems, Inc. (U.S.)
- Xoft, Inc. (U.S.)
- Panacea Medical Technologies Pvt. Ltd. (India)
- REMEDI Co., Ltd. (South Korea)
- RaySearch Laboratories AB (Sweden)
- Sordina IORT Technologies (Italy)
- Zap Surgical Systems Inc. (U.S.)
- Varian Medical Systems, Inc. (U.S.)
What are the Recent Developments in Middle East and Africa Intraoperative Radiation Therapy Market?
- In November 2025, the Middle East Society of Therapeutic Radiation Oncology announced its fourth annual conference to be held in Riyadh, focusing on advances in therapeutic radiation including intraoperative radiation therapy and related oncology technologies. This event is expected to bring together radiation oncology professionals from across the Middle East to share clinical insights
- In September 2025, King Fahad Specialist Hospital-Dammam in Saudi Arabia announced that its Radiation Therapy Department is developing a sophisticated Intraoperative Radiation Therapy (IORT) program as part of its expanded oncology services. The hospital, a major tertiary and cancer care centre in the Eastern Region, highlighted plans to incorporate IORT techniques into its multidisciplinary cancer treatment offerings, enhancing local access to advanced radiation therapy approaches for surgical oncology patients
- In January 2025, the Emirates Society of Radiation Oncology (ESRO) was established in the United Arab Emirates, aiming to strengthen professional collaboration, training, research, and policy development in radiation oncology, which underpins improved adoption and clinical best practices for modalities such as IORT across the region. ESRO’s formation represents an institutional milestone for advancing precision radiation cancer treatments in the UAE
- In January 2024, Elekta AB partnered with a leading cancer treatment center in the UAE to establish a specialized IORT program, aimed at improving patient outcomes and expanding access to advanced radiation therapy during surgery. This collaboration highlights cross‑border technology adoption and capacity building in IORT within the Middle East
- In November 2023, Netcare Milpark Hospital in Johannesburg, South Africa, introduced intraoperative radiation therapy (IORT) technology for selected breast cancer patients, expanding advanced radiation‑on‑surgery care in the region. The IORT service uses the Zeiss IORT system immediately after lumpectomy to deliver targeted radiation and reduce patient exposure compared with traditional multi‑session external beam radiotherapy. This marks a significant clinical capability enhancement for breast oncology care in South Africa
SKU-

- Interactive Data Analysis Dashboard
- Company Analysis Dashboard for high growth potential opportunities
- Research Analyst Access for customization & queries
- Competitor Analysis with Interactive dashboard
- Latest News, Updates & Trend analysis
- Harness the Power of Benchmark Analysis for Comprehensive Competitor Tracking
Data collection and base year analysis are done using data collection modules with large sample sizes. The stage includes obtaining market information or related data through various sources and strategies. It includes examining and planning all the data acquired from the past in advance. It likewise envelops the examination of information inconsistencies seen across different information sources. The market data is analysed and estimated using market statistical and coherent models. Also, market share analysis and key trend analysis are the major success factors in the market report. To know more, please request an analyst call or drop down your inquiry.
The key research methodology used by DBMR research team is data triangulation which involves data mining, analysis of the impact of data variables on the market and primary (industry expert) validation. Data models include Vendor Positioning Grid, Market Time Line Analysis, Market Overview and Guide, Company Positioning Grid, Patent Analysis, Pricing Analysis, Company Market Share Analysis, Standards of Measurement, Global versus Regional and Vendor Share Analysis. To know more about the research methodology, drop in an inquiry to speak to our industry experts.
Data Bridge Market Research is a leader in advanced formative research. We take pride in servicing our existing and new customers with data and analysis that match and suits their goal. The report can be customized to include price trend analysis of target brands understanding the market for additional countries (ask for the list of countries), clinical trial results data, literature review, refurbished market and product base analysis. Market analysis of target competitors can be analyzed from technology-based analysis to market portfolio strategies. We can add as many competitors that you require data about in the format and data style you are looking for. Our team of analysts can also provide you data in crude raw excel files pivot tables (Fact book) or can assist you in creating presentations from the data sets available in the report.


