
Middle East And Africa Knee Cartilage Repair Market
Market Size in USD Billion
 USD
144.34 Billion
USD
436.95 Billion
2025
2033
USD
144.34 Billion
USD
436.95 Billion
2025
2033
| 2026 - 2033 | |
| USD 144.34 Billion | |
| USD 436.95 Billion | |
| % | |
|
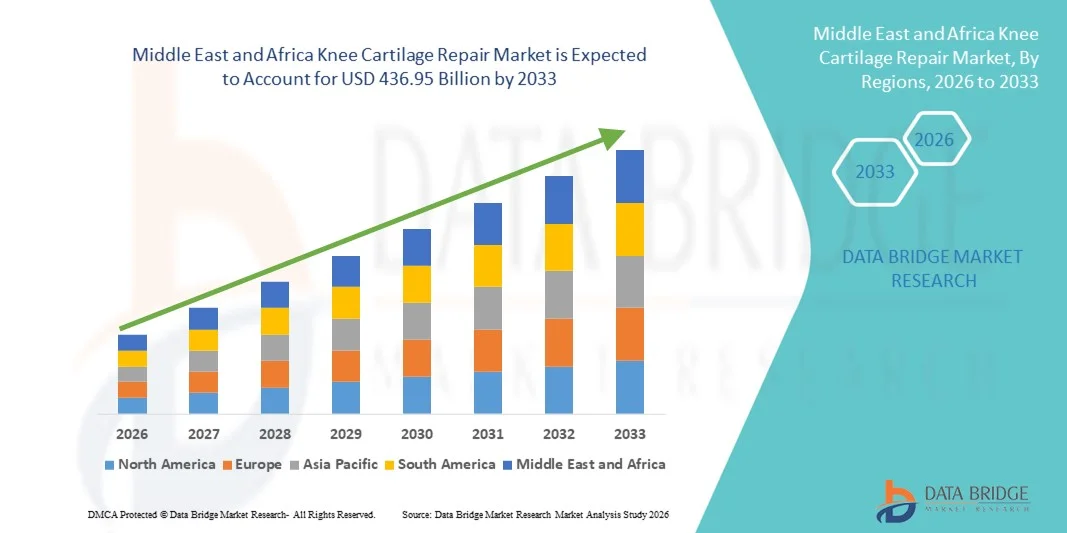
Middle East and Africa Knee Cartilage Repair Market Size
- The Middle East and Africa knee cartilage repair market size was valued at USD 144.34 billion in 2025 and is expected to reach USD 436.95 billion by 2033, at a CAGR of 14.85% during the forecast period
- The market growth is largely fueled by the rising prevalence of knee injuries and degenerative joint disorders, including osteoarthritis and sports-related cartilage damage, along with continuous advancements in orthopedic surgical techniques and regenerative medicine technologies, driving increased adoption of knee cartilage repair solutions across hospitals and specialty clinics
- Furthermore, growing patient preference for minimally invasive procedures, faster recovery outcomes, and long-term joint preservation is establishing knee cartilage repair therapies as a preferred treatment option. These converging factors are accelerating the uptake of Knee Cartilage Repair solutions, thereby significantly boosting the industry’s overall growth
Middle East and Africa Knee Cartilage Repair Market Analysis
- Knee cartilage repair solutions, encompassing surgical and regenerative techniques to restore damaged articular cartilage, are becoming increasingly important in modern orthopedic care due to their ability to relieve pain, restore joint function, and delay or prevent total knee replacement procedures across both traumatic and degenerative indications
- The rising demand for knee cartilage repair is primarily driven by the growing prevalence of sports injuries, osteoarthritis, and age-related cartilage degeneration, along with increasing patient preference for minimally invasive procedures and improved long-term mobility outcomes
- Saudi Arabia dominated the knee cartilage repair market with the largest revenue share of approximately 36.4% in 2025, supported by strong government investments in healthcare infrastructure, a rising burden of orthopedic disorders, increasing adoption of advanced surgical techniques, and the presence of well-established specialty hospitals and orthopedic centers across the country
- The U.A.E. is expected to be the fastest-growing country in the knee cartilage repair market during the forecast period, registering a CAGR of around 15.8%, driven by medical tourism growth, expanding access to advanced orthopedic procedures, increasing healthcare expenditure, and rapid adoption of innovative cartilage repair technologies
- The non-cell-based treatment segment dominated the market, accounting for approximately 41.9% of revenue in 2025. These treatments are widely adopted due to their cost-effectiveness and established clinical outcomes
Report Scope and Knee Cartilage Repair Market Segmentation
|
Attributes |
Knee Cartilage Repair Key Market Insights |
|
Segments Covered |
|
|
Countries Covered |
Middle East and Africa
|
|
Key Market Players |
|
|
Market Opportunities |
|
|
Value Added Data Infosets |
In addition to the insights on market scenarios such as market value, growth rate, segmentation, geographical coverage, and major players, the market reports curated by the Data Bridge Market Research also include in-depth expert analysis, patient epidemiology, pipeline analysis, pricing analysis, and regulatory framework. |
Middle East and Africa Knee Cartilage Repair Market Trends
Advancements in Regenerative Therapies and Minimally Invasive Techniques
- A significant and accelerating trend in the Middle East and Africa Knee Cartilage Repair market is the growing adoption of regenerative medicine approaches, including cell-based therapies, biomaterials, and tissue engineering techniques
- These innovations are improving clinical outcomes by promoting natural cartilage regeneration, reducing recovery time, and enhancing long-term joint function for patients suffering from cartilage damage and degenerative joint conditions
- For instance, the increasing use of autologous chondrocyte implantation (ACI), matrix-induced ACI (MACI), and osteochondral grafting procedures across specialized orthopedic centers is supporting improved treatment precision and durability. These techniques are particularly gaining traction in advanced healthcare facilities across the Gulf Cooperation Council (GCC) countries and South Africa
- Technological advancements in minimally invasive surgical procedures are enabling orthopedic surgeons to perform cartilage repair with reduced trauma, lower complication rates, and faster rehabilitation. The integration of advanced imaging systems, arthroscopic tools, and bioengineered scaffolds is improving surgical accuracy and patient outcomes across the region
- The growing availability of next-generation biomaterials, such as collagen-based scaffolds and synthetic matrices, is further enhancing treatment effectiveness. These materials provide structural support for cartilage regeneration while integrating seamlessly with native tissue, making them increasingly preferred in knee cartilage repair procedures
- This shift toward innovative, patient-centric, and biologically driven treatment approaches is reshaping clinical practices in the region. Consequently, leading medical device and biotechnology companies are expanding their product portfolios and strengthening distribution networks to meet the rising demand for advanced knee cartilage repair solutions
- The demand for effective and durable cartilage repair therapies is increasing across both public and private healthcare settings, as patients and clinicians prioritize long-term joint preservation, reduced pain, and improved mobility outcomes
Middle East and Africa Knee Cartilage Repair Market Dynamics
Driver
Rising Prevalence of Knee Injuries and Osteoarthritis
- The increasing prevalence of knee injuries, sports-related trauma, and age-related degenerative conditions such as osteoarthritis is a major driver for the growth of the Knee Cartilage Repair market in the Middle East and Africa
- A growing aging population, combined with rising obesity rates and physically demanding lifestyles, is contributing to higher incidences of cartilage damage
- For instance, the expanding participation in professional and recreational sports, along with higher rates of road traffic accidents in certain regions, has led to an increased demand for advanced orthopedic interventions, including cartilage repair procedures
- Healthcare providers are increasingly focusing on early intervention to prevent disease progression and avoid total knee replacement surgeries
- Increased awareness among patients and clinicians regarding the benefits of early cartilage repair is further accelerating market growth. Knee cartilage repair procedures offer pain relief, improved joint function, and delayed progression to severe osteoarthritis, making them a preferred treatment option
- In addition, the expansion of specialized orthopedic centers, rising healthcare expenditure, and government initiatives aimed at strengthening musculoskeletal care are supporting the adoption of knee cartilage repair treatments across the region
- The growing availability of skilled orthopedic surgeons and improved access to advanced diagnostic tools are further enabling the wider adoption of cartilage repair solutions in both urban and semi-urban healthcare settings
Restraint/Challenge
High Treatment Costs and Limited Access to Advanced Care
- High treatment costs associated with advanced knee cartilage repair procedures pose a significant challenge to market growth, particularly in low- and middle-income countries within the Middle East and Africa. Procedures involving cell-based therapies, biomaterials, and specialized surgical expertise often require substantial financial investment
- Limited access to advanced orthopedic care and specialized healthcare infrastructure in certain regions further restricts market penetration
- For instance, in several parts of Sub-Saharan Africa, the shortage of well-equipped orthopedic hospitals and trained cartilage repair specialists limits the availability of procedures such as autologous chondrocyte implantation and osteochondral grafting
- In addition, reimbursement limitations and inconsistent insurance coverage for cartilage repair treatments can discourage patients from opting for these procedures, especially when compared to more conventional or conservative treatment approaches
- Addressing these challenges through increased healthcare investments, expansion of orthopedic training programs, improved reimbursement frameworks, and the development of cost-effective treatment alternatives will be critical for broader market adoption
- Overcoming these barriers will be essential for ensuring equitable access to knee cartilage repair solutions and sustaining long-term market growth across the Middle East and Africa region
Middle East and Africa Knee Cartilage Repair Market Scope
The market is segmented on the basis of application, end user, distribution channel, devices, treatment, and surgical technique.
- By Application
On the basis of application, the Knee Cartilage Repair market is segmented into bone tumor, fracture, osteonecrosis, rheumatoid arthritis, osteoarthritis, and others. The osteoarthritis segment dominated the Knee Cartilage Repair market, accounting for approximately 39.4% of the total revenue share in 2025. This dominance is primarily driven by the rising global prevalence of osteoarthritis, particularly among the aging population and individuals with obesity and sedentary lifestyles. Osteoarthritis is one of the leading causes of knee cartilage degeneration, creating sustained demand for cartilage repair and regeneration procedures. Increasing awareness regarding early intervention to delay joint replacement surgeries has further boosted adoption. Advancements in imaging technologies and minimally invasive surgical techniques have improved diagnosis and treatment outcomes. Additionally, growing healthcare expenditure and favorable reimbursement policies in developed economies support market growth. The increasing preference for cartilage-preserving procedures over total knee replacement also strengthens this segment’s dominance. Rising participation in sports activities and associated joint injuries further contribute to osteoarthritis-related cartilage damage. Collectively, these factors position osteoarthritis as the leading application segment globally.
The bone tumor segment is expected to witness the fastest growth, registering a CAGR of 11.2% from 2026 to 2033. Growth is driven by increasing incidence of primary and metastatic bone tumors involving the knee joint and rising survival rates among cancer patients. Improved oncological treatments have increased the need for post-tumor cartilage reconstruction to restore joint function. Technological advancements in surgical planning, graft materials, and limb-salvage techniques are supporting wider adoption. Increasing collaboration between orthopedic and oncology specialists is improving treatment outcomes. Additionally, expanding access to advanced surgical care in emerging economies is accelerating growth. Rising awareness of functional recovery after tumor resection further supports demand. Ongoing clinical research in cartilage regeneration following tumor removal is also expected to boost adoption during the forecast period.
- By End User
On the basis of end user, the Knee Cartilage Repair market is segmented into hospitals, ambulatory surgical centers, independent centers, and others. The hospitals segment dominated the Knee Cartilage Repair market, accounting for approximately 46.8% of the total market revenue in 2025. This dominance is driven by the availability of advanced surgical infrastructure and specialized orthopedic departments within hospitals. Hospitals are often the preferred setting for complex cartilage repair procedures due to the presence of skilled orthopedic surgeons and multidisciplinary care teams. The ability to manage post-operative complications and provide comprehensive rehabilitation services further strengthens hospital preference. High patient inflow for trauma, degenerative joint diseases, and sports injuries also contributes significantly. Increasing adoption of technologically advanced procedures such as autologous chondrocyte implantation and osteochondral grafting is more prominent in hospital settings. Favorable reimbursement policies for inpatient orthopedic surgeries further support growth. Additionally, hospitals are increasingly participating in clinical trials, accelerating adoption of novel cartilage repair therapies. Rising investments in hospital expansion and modernization globally continue to reinforce this segment’s dominance.
The ambulatory surgical centers segment is expected to witness the fastest growth, registering a CAGR of 12.5% from 2026 to 2033. This growth is fueled by the shift toward minimally invasive cartilage repair procedures that do not require prolonged hospitalization. Ambulatory surgical centers offer cost-effective treatment options with shorter recovery times, making them attractive to both patients and payers. Advances in arthroscopic techniques enable complex procedures to be performed safely in outpatient settings. Increasing patient preference for same-day discharge and reduced infection risk further drives adoption. The rising number of ASCs globally, particularly in developed markets, supports rapid expansion. Favorable reimbursement models for outpatient procedures also encourage migration from hospitals. Technological advancements in anesthesia and post-operative pain management further enhance procedural feasibility in these centers.
- By Distribution Channel
On the basis of distribution channel, the Knee Cartilage Repair market is segmented into direct sale, third-party distributor, online sales, and others. The direct sales segment dominated the market, accounting for approximately 42.6% of total revenue in 2025. Direct sales enable manufacturers to establish strong relationships with hospitals and orthopedic centers, ensuring better product training and technical support. This channel is particularly preferred for high-value implants and surgical systems requiring specialized handling. Direct engagement allows manufacturers to customize solutions according to surgeon preferences. Better control over pricing and inventory management also strengthens profitability. Additionally, hospitals often prefer direct procurement to ensure product authenticity and quality assurance. The growing adoption of advanced cartilage repair devices further supports direct sales dominance. Long-term supply contracts with large healthcare institutions enhance market stability.
The online sales segment is anticipated to grow at the fastest CAGR of 13.1% from 2026 to 2033. Growth is driven by increasing digitalization of healthcare procurement and expanding e-commerce platforms for medical devices. Online channels offer broader product accessibility, transparent pricing, and faster delivery, particularly for consumables and smaller devices. Rising adoption by independent clinics and ambulatory centers further supports growth. Improvements in logistics and cold-chain management enhance reliability. Increasing acceptance of digital purchasing among healthcare professionals accelerates adoption. Expansion of online medical marketplaces in emerging regions is also contributing to rapid growth.
- By Devices
On the basis of devices, the Knee Cartilage Repair market is segmented into implants, arthroscopy, arthrodesis, bone graft, osteotomy, resurfacing, and others. The implants segment dominated the Knee Cartilage Repair market, capturing approximately 38.9% of the total market revenue in 2025. The widespread use of implants in restoring cartilage structure and joint functionality drives this dominance. Technological advancements have improved implant durability, biocompatibility, and clinical outcomes. Rising preference for joint-preserving procedures over total knee replacement supports implant adoption. Increasing sports injuries and age-related cartilage degeneration further boost demand. Implants are frequently used in both early-stage and advanced cartilage defects, expanding their application range. Growing surgeon familiarity and favorable clinical evidence strengthen adoption. Additionally, continuous product innovation by leading manufacturers sustains market leadership.
The arthroscopy segment is expected to register the fastest growth, expanding at a CAGR of 12.9% from 2026 to 2033. Growth is driven by the increasing preference for minimally invasive procedures with faster recovery times. Arthroscopy reduces hospital stays and post-operative complications, making it highly attractive to patients. Advancements in visualization and instrumentation have expanded its applicability. Rising adoption in outpatient settings further supports growth. Increasing surgeon training and improved procedural success rates enhance confidence. As healthcare systems prioritize cost efficiency, arthroscopy is expected to gain significant traction globally.
- By Treatment
On the basis of treatment, the Knee Cartilage Repair market is segmented into cell-based, non-cell-based, surgery, and others. The non-cell-based treatment segment dominated the market, accounting for approximately 41.9% of revenue in 2025. These treatments are widely adopted due to their cost-effectiveness and established clinical outcomes. Non-cell-based therapies are often preferred for early-stage cartilage defects. Wider availability and shorter treatment timelines support adoption. Favorable reimbursement policies further strengthen dominance. Increasing use of synthetic scaffolds and biomaterials enhances effectiveness. Growing surgeon confidence in non-cell-based approaches supports continued leadership. These treatments are widely accessible across healthcare settings.
The cell-based treatment segment is projected to grow at the fastest CAGR of 14.6% from 2026 to 2033. Growth is driven by rising interest in regenerative medicine and personalized therapies. Increasing clinical success rates of autologous chondrocyte implantation support adoption. Ongoing research and technological advancements are improving outcomes. Growing patient awareness of long-term benefits accelerates demand. Favorable regulatory developments further support growth. Expanding clinical applications are expected to drive sustained expansion.
- By Surgical Technique
On the basis of surgical technique, the Knee Cartilage Repair market is segmented into microfracture, autologous chondrocyte implantation, osteochondral autograft transplantation, osteochondral allograft transplantation, drilling, abrasion arthroplasty, and others. The microfracture segment dominated the Knee Cartilage Repair market, holding approximately 36.7% of the total market revenue in 2025. This dominance is attributed to its long-standing clinical acceptance and cost-effectiveness. Microfracture is often the first-line surgical technique for treating small to medium-sized cartilage defects. The procedure is minimally invasive and does not require complex equipment or implants, making it widely accessible. High adoption rates in hospitals and ambulatory surgical centers support market leadership. Surgeons favor microfracture due to its simplicity and relatively short operative time. Favorable reimbursement coverage further strengthens utilization. The technique is commonly used in younger patients and athletes, contributing to sustained demand. Despite the emergence of advanced techniques, microfracture remains a widely practiced standard procedure globally.
The autologous chondrocyte implantation segment is projected to grow at the fastest rate, with a CAGR of 14.1% from 2026 to 2033. Growth is driven by its superior long-term outcomes in treating large and complex cartilage defects. Increasing clinical evidence supporting durable cartilage regeneration enhances adoption. Rising patient preference for joint-preserving procedures accelerates demand. Advancements in cell culture technologies have improved treatment efficiency and reduced failure rates. Expanding insurance coverage and regulatory approvals further support growth. Growing adoption in younger and active patient populations strengthens market expansion. Increased surgeon training and technological refinement are expected to propel this segment significantly during the forecast period.
Middle East and Africa Knee Cartilage Repair Market Regional Analysis
- The Middle East knee cartilage repair market is projected to expand at a substantial CAGR throughout the forecast period, driven by rising healthcare investments, increasing prevalence of orthopedic disorders, and growing awareness of advanced joint preservation treatments
- Improvements in healthcare infrastructure, coupled with the expanding availability of minimally invasive and regenerative cartilage repair procedures, are supporting market growth across the region
- The increasing incidence of sports injuries, obesity-related joint conditions, and age-related cartilage degeneration is further contributing to demand for knee cartilage repair solutions in both public and private healthcare settings
Saudi Arabia Knee Cartilage Repair Market Insight
Saudi Arabia dominated the knee cartilage repair market with the largest revenue share of approximately 36.4% in 2025, supported by strong government investments in healthcare infrastructure and the expansion of specialized orthopedic and sports medicine centers. The country’s rising burden of osteoarthritis and knee-related injuries, along with increasing adoption of advanced surgical techniques such as autologous chondrocyte implantation and osteochondral grafting, is driving market growth. In addition, the presence of well-established specialty hospitals, growing medical workforce expertise, and national healthcare transformation initiatives under Vision 2030 are strengthening Saudi Arabia’s leadership position in the regional market.
U.A.E. Knee Cartilage Repair Market Insight
The U.A.E. knee cartilage repair market is expected to grow at the fastest CAGR of around 15.8% during the forecast period, driven by rapid expansion of private healthcare facilities, rising healthcare expenditure, and strong growth in medical tourism. Increasing access to advanced orthopedic procedures, coupled with the early adoption of innovative cartilage repair technologies, is fueling market expansion. The U.A.E.’s focus on high-quality patient care, availability of internationally accredited hospitals, and growing demand for minimally invasive and regenerative treatment options are further accelerating the adoption of knee cartilage repair solutions across the country.
Middle East and Africa Knee Cartilage Repair Market Share
The Knee Cartilage Repair industry is primarily led by well-established companies, including:
- Smith & Nephew (U.K.)
- Zimmer Biomet (U.S.)
- Stryker Corporation (U.S.)
- Arthrex, Inc. (U.S.)
- Johnson & Johnson (U.S.)
- Medtronic plc (Ireland)
- B. Braun S.E. (Germany)
- ConMed Corporation (U.S.)
- Anika Therapeutics, Inc. (U.S.)
- Vericel Corporation (U.S.)
- RTI Surgical (U.S.)
- Exactech, Inc. (U.S.)
- Bioventus (U.S.)
- Collagen Solutions plc (U.K.)
- Matricel GmbH (Germany)
Latest Developments in Middle East and Africa Knee Cartilage Repair Market
- In November 2023, Anika Therapeutics announced positive results from Phase III clinical trials of its HYALOFAST scaffold for cartilage repair, showing significant improvements in patient outcomes compared with traditional microfracture procedures at a 24-month follow-up evaluation. This milestone highlights progress toward broader clinical adoption of advanced scaffold-based cartilage repair technologies
- In January 2024, Arthrex, Inc. received CE marking approval in Europe for its BioCartilage extracellular matrix scaffold combined with bone marrow aspirate concentrate, enabling commercialization of this innovative single-stage cartilage repair solution designed to stimulate natural tissue regeneration
- In March 2024, Zimmer Biomet completed the acquisition of Cartiheal Ltd. for USD 315 million, gaining access to the Agili-C implant technology for treating osteochondral defects. This strategic move expanded Zimmer Biomet’s regenerative medicine portfolio and strengthened its position in the knee cartilage repair segment
- In March 2025, Stryker announced a strategic partnership with MediKnee focused on co-developing next-generation cartilage repair scaffolds and cell-based therapies aimed at enhancing knee cartilage regeneration. The collaboration is intended to accelerate innovation and broaden the range of regenerative orthopaedic options available to clinicians and patients
- In May 2025, Dutch medtech company Hy2Care secured €4.5 million in funding to launch a clinical trial for its CartRevive cartilage repair implant, a hydrogel-based regenerative solution. The funding supports early clinical evaluation in the U.S. and lays the groundwork for future commercialization in Europe and global markets
- In May 2025, Smith+Nephew published results from a multicenter randomized controlled trial showing that patients treated with its CARTIHEAL AGILI-C cartilage repair implant experienced an 87% lower relative risk of total knee arthroplasty or osteotomy at four years compared with standard care, with superior functional and pain relief outcomes
SKU-

- Interactive Data Analysis Dashboard
- Company Analysis Dashboard for high growth potential opportunities
- Research Analyst Access for customization & queries
- Competitor Analysis with Interactive dashboard
- Latest News, Updates & Trend analysis
- Harness the Power of Benchmark Analysis for Comprehensive Competitor Tracking
Data collection and base year analysis are done using data collection modules with large sample sizes. The stage includes obtaining market information or related data through various sources and strategies. It includes examining and planning all the data acquired from the past in advance. It likewise envelops the examination of information inconsistencies seen across different information sources. The market data is analysed and estimated using market statistical and coherent models. Also, market share analysis and key trend analysis are the major success factors in the market report. To know more, please request an analyst call or drop down your inquiry.
The key research methodology used by DBMR research team is data triangulation which involves data mining, analysis of the impact of data variables on the market and primary (industry expert) validation. Data models include Vendor Positioning Grid, Market Time Line Analysis, Market Overview and Guide, Company Positioning Grid, Patent Analysis, Pricing Analysis, Company Market Share Analysis, Standards of Measurement, Global versus Regional and Vendor Share Analysis. To know more about the research methodology, drop in an inquiry to speak to our industry experts.
Data Bridge Market Research is a leader in advanced formative research. We take pride in servicing our existing and new customers with data and analysis that match and suits their goal. The report can be customized to include price trend analysis of target brands understanding the market for additional countries (ask for the list of countries), clinical trial results data, literature review, refurbished market and product base analysis. Market analysis of target competitors can be analyzed from technology-based analysis to market portfolio strategies. We can add as many competitors that you require data about in the format and data style you are looking for. Our team of analysts can also provide you data in crude raw excel files pivot tables (Fact book) or can assist you in creating presentations from the data sets available in the report.


