
Middle East And Africa Lyophilized Injectable Drugs Market
Market Size in USD Million
 USD
176.55 Million
USD
245.37 Million
2024
2032
USD
176.55 Million
USD
245.37 Million
2024
2032
| 2025 - 2032 | |
| USD 176.55 Million | |
| USD 245.37 Million | |
| % | |
|
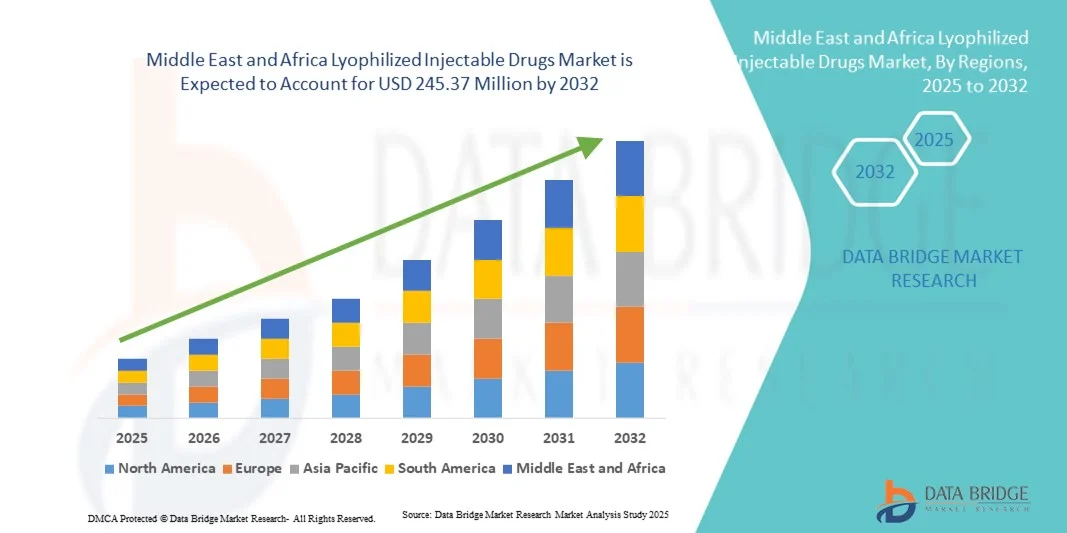
Middle East and Africa Lyophilized Injectable Drugs Market Size
- The Middle East and Africa lyophilized injectable drugs market size was valued at USD 176.55 million in 2024 and is expected to reach USD 245.37 million by 2032, at a CAGR of 4.2% during the forecast period
- The market growth is primarily driven by the increasing prevalence of chronic and infectious diseases, rising demand for long shelf-life formulations, and expanding biopharmaceutical manufacturing capabilities across the region
- In addition, the growing investments in healthcare infrastructure, coupled with rising awareness about sterile and stable injectable formulations, are fostering the adoption of lyophilized drugs in both hospital and outpatient settings. These factors collectively are propelling the market’s expansion across the Middle East and Africa
Middle East and Africa Lyophilized Injectable Drugs Market Analysis
- Lyophilized injectable drugs, which use freeze-drying to improve drug stability and shelf life, are witnessing increasing adoption across the Middle East and Africa as healthcare systems emphasize reliable, temperature-stable, and sterile formulations for both biologics and small-molecule therapies
- The market’s growth is driven by the rising prevalence of chronic and infectious diseases, expansion of biologics manufacturing, and increasing focus on advanced cold-chain management solutions to ensure product efficacy in diverse climatic conditions
- Saudi Arabia dominated the Middle East and Africa lyophilized injectable drugs market with the largest revenue share of 32.8% in 2024, attributed to strong governmental healthcare reforms, robust pharmaceutical manufacturing initiatives under Vision 2030, and expanding hospital infrastructure
- South Africa is expected to be the fastest-growing market during the forecast period, driven by increasing investments in healthcare facilities, growing public-private collaborations, and a surge in demand for injectable biologics and antibiotics
- The vials segment dominated the market with the largest market share of 46.5% in 2024, owing to its superior product stability, broad drug compatibility, and continued preference across hospitals and clinical settings for reconstitutable formulations
Report Scope and Middle East and Africa Lyophilized Injectable Drugs Market Segmentation
|
Attributes |
Middle East and Africa Lyophilized Injectable Drugs Key Market Insights |
|
Segments Covered |
|
|
Countries Covered |
Middle East and Africa
|
|
Key Market Players |
|
|
Market Opportunities |
|
|
Value Added Data Infosets |
In addition to the insights on market scenarios such as market value, growth rate, segmentation, geographical coverage, and major players, the market reports curated by the Data Bridge Market Research also include in-depth expert analysis, patient epidemiology, pipeline analysis, pricing analysis, and regulatory framework |
Middle East and Africa Lyophilized Injectable Drugs Market Trends
Rising Demand for Temperature-Stable and Long Shelf-Life Formulations
- A significant and accelerating trend in the Middle East and Africa lyophilized injectable drugs market is the growing demand for temperature-stable, long shelf-life formulations that address the region’s climatic challenges and limited cold-chain infrastructure. This trend is reshaping pharmaceutical manufacturing and distribution strategies
- For instance, Saudi Pharmaceutical Industries and Medical Appliances Corporation (SPIMACO) has expanded its lyophilization capabilities to enhance drug stability and meet the increasing regional demand for temperature-sensitive biologics and vaccines. Similarly, Julphar (Gulf Pharmaceutical Industries) has been advancing its injectable production lines to strengthen product durability and safety
- The increasing focus on lyophilized formulations is enabling improved handling, transport, and storage efficiency across hospital and clinic networks, particularly in rural areas with inconsistent refrigeration access. This ensures that life-saving injectable drugs remain potent throughout their supply chain journey
- Moreover, lyophilization supports the growing biopharmaceutical sector in the region by allowing companies to produce high-value biologics and vaccines with extended stability, facilitating wider distribution across markets with challenging logistics
- This trend toward stability-focused manufacturing is encouraging international and local pharmaceutical companies to invest in new freeze-drying technologies and production facilities. For instance, Egypt’s Eva Pharma has introduced advanced lyophilization units to enhance its injectable portfolio
- The growing emphasis on formulation stability and manufacturing innovation is expected to strengthen the region’s pharmaceutical resilience and reduce dependency on imports, driving long-term market growth
Middle East and Africa Lyophilized Injectable Drugs Market Dynamics
Driver
Expanding Biopharmaceutical Production and Healthcare Investments
- The increasing establishment of biopharmaceutical facilities and the rising investments in healthcare infrastructure across the Middle East and Africa are major drivers of lyophilized injectable drug market growth
- For instance, in March 2024, Saudi Arabia’s Public Investment Fund announced new partnerships with global pharmaceutical firms to localize biologics and sterile injectable production, fostering domestic capacity for lyophilized formulations
- As governments prioritize healthcare expansion and self-sufficiency, the demand for advanced injectable solutions with extended stability continues to grow, supporting both hospital supply and emergency care readiness
- Furthermore, ongoing initiatives to strengthen pharmaceutical cold chains and improve access to biologics are boosting the adoption of lyophilized drugs, which offer practical advantages in regions with limited storage conditions
- The enhanced focus on R&D, combined with incentives for local manufacturing and clinical research, is positioning Middle Eastern and African countries as emerging hubs for sterile injectable production
- Growing collaborations between public health agencies and private pharmaceutical players are expected to accelerate innovation and drive sustainable growth in the lyophilized injectable drugs market across the region
- Supportive regulatory reforms, including fast-track drug approvals and import substitution policies in Saudi Arabia and Egypt, are further boosting local lyophilized injectable drug production and market accessibility
Restraint/Challenge
High Production Costs and Limited Technological Infrastructure
- The high cost of lyophilization equipment, combined with limited regional expertise and technological infrastructure, presents a major challenge to market expansion across the Middle East and Africa
- For instance, smaller manufacturers in African nations often face difficulties establishing compliant sterile production facilities due to the capital-intensive nature of lyophilization technology and maintenance requirements
- Limited access to advanced freeze-drying equipment and skilled technical personnel constrains large-scale adoption and slows down technology transfer from global pharmaceutical leaders
- Furthermore, the cost burden associated with validation, quality assurance, and regulatory compliance increases overall production expenses, discouraging some local companies from entering the market
- Addressing these challenges through international partnerships, workforce training, and government-backed incentives for technological advancement will be essential to enhance domestic lyophilization capabilities and foster long-term market development
- The limited availability of funding and venture capital support for pharmaceutical innovation in several African economies continues to restrict the scaling of lyophilized drug manufacturing capacity
- Delays in regulatory approvals and inconsistent quality control standards across different countries in the region hinder smooth product distribution and discourage foreign direct investments in lyophilization facilities
Middle East and Africa Lyophilized Injectable Drugs Market Scope
The market is segmented on the basis of packaging, drug class, form, indication, route of administration, end user, and distribution channel.
- By Packaging
On the basis of packaging, the market is segmented into vials, dual-chamber syringes, dual-chamber cartridges, and others. The vials segment dominated the market with the largest revenue share of 46.5% in 2024, driven by its extensive use in storing lyophilized drugs due to superior protection against contamination and environmental exposure. Vials are cost-effective, easy to handle, and suitable for multiple reconstitutions, making them ideal for hospital pharmacies. Their durability and compatibility with various therapeutic classes, including vaccines, antibiotics, and biologics, strengthen their dominance. Furthermore, pharmaceutical manufacturers in Saudi Arabia and Egypt prefer vials due to their simple sealing mechanisms and compatibility with automated filling lines. The segment’s growth is further fueled by increased production of high-volume injectable formulations for chronic disease treatment.
The dual-chamber syringe segment is expected to witness the fastest growth rate during the forecast period, propelled by the growing adoption of ready-to-use formulations in both hospital and home care settings. Dual-chamber syringes allow drug reconstitution immediately before administration, reducing contamination risk and preparation time. For instance, pharmaceutical companies in the UAE are introducing dual-chamber systems to enhance patient safety and convenience. The ease of handling and single-use design make them highly suitable for biologics and emergency care applications. Growing acceptance among clinicians for self-administrable injectables is also driving this segment’s rapid expansion.
- By Drug Class
On the basis of drug class, the market is segmented into anti-infective, antineoplastic, diuretics, proton pump inhibitors, anesthetic, anticoagulant, NSAIDs, corticosteroids, and others. The anti-infective segment dominated the market in 2024 due to the high prevalence of bacterial and viral infections across the Middle East and Africa. Lyophilized anti-infectives offer long shelf life and improved stability under extreme temperatures, addressing cold-chain limitations in several African countries. Hospitals across Saudi Arabia, Egypt, and Kenya rely heavily on these drugs for critical and emergency care. The rising focus on reducing antimicrobial resistance has led to the increased use of injectable antibiotics in controlled formulations. Moreover, government procurement programs for essential anti-infective injectables have further strengthened this segment’s growth.
The antineoplastic segment is projected to grow at the fastest rate during the forecast period, driven by the increasing burden of cancer and expanding oncology treatment infrastructure. Lyophilized antineoplastic drugs are preferred for their enhanced stability and precision dosing. For instance, Egyptian and South African oncology centers are investing in freeze-dried formulations to maintain the potency of cytotoxic drugs. Advancements in biologic therapies and targeted treatments also depend heavily on lyophilized delivery formats. The segment benefits from rising patient awareness and improved access to oncology care supported by national cancer treatment programs.
- By Form
On the basis of form, the market is segmented into powder and liquid. The powder segment dominated the market in 2024, accounting for the highest revenue share due to its exceptional stability and longer shelf life. Powdered lyophilized drugs are easier to store and transport under variable temperature conditions, a critical advantage in regions with limited refrigeration. Pharmaceutical companies across Saudi Arabia and Egypt widely adopt powder formulations for biologics, vaccines, and antibiotics. The ease of reconstitution and reduced degradation risk make them ideal for hospital pharmacies. In addition, their cost-effectiveness in bulk production contributes to sustained demand in the market.
The liquid segment is anticipated to exhibit the fastest growth rate over the forecast period, driven by the rising preference for ready-to-use injectable formulations. These products reduce preparation time and are especially useful in emergency and intensive care settings. For instance, UAE-based pharmaceutical companies are increasingly producing liquid lyophilized injectables for anesthetics and anticoagulants. Improvements in aseptic filling and prefilled syringe technology are supporting market growth. Furthermore, the segment benefits from the growing trend toward patient-friendly and self-administrable injectable drugs.
- By Indication
On the basis of indication, the market is segmented into oncology, autoimmune diseases, hormonal disorders, respiratory diseases, gastrointestinal disorders, dermatological disorders, ophthalmic diseases, and others. The oncology segment dominated the market with the largest share in 2024, supported by the increasing incidence of cancer and growing access to advanced treatment therapies. Lyophilized formulations ensure stability and efficacy of chemotherapeutic agents, which are often temperature-sensitive. Leading hospitals in Saudi Arabia, Egypt, and South Africa rely on lyophilized oncology injectables for consistent therapeutic outcomes. These formulations also enable efficient inventory management in centralized hospital pharmacies. The ongoing expansion of cancer treatment facilities across the region continues to drive segment growth.
The autoimmune diseases segment is expected to register the fastest CAGR during the forecast period due to the rising diagnosis of rheumatoid arthritis, psoriasis, and lupus. Lyophilized biologics are becoming essential for managing these chronic conditions because of their enhanced stability and lower degradation risk. For instance, healthcare providers in Egypt and the UAE are increasingly adopting lyophilized monoclonal antibodies for autoimmune therapy. Technological advancements in biologic drug development and supportive reimbursement structures are further propelling this segment’s growth.
- By Route of Administration
On the basis of route of administration, the market is segmented into intravenous/infusion, intramuscular, and others. The intravenous/infusion segment dominated the market in 2024, attributed to its widespread use in hospitals for delivering antibiotics, chemotherapy, and biologics. Intravenous administration ensures immediate bioavailability and rapid therapeutic effect, which is critical in acute care. Hospitals in Saudi Arabia and the UAE extensively use lyophilized IV drugs for their stability and sterility. In addition, increasing demand for biologics and emergency treatments continues to reinforce this segment’s dominance. Ongoing investments in hospital infrastructure and infusion centers further strengthen growth prospects.
The intramuscular segment is projected to witness the fastest growth rate during the forecast period, driven by its convenience for outpatient and home-based care. Intramuscular formulations are easier to administer and require minimal equipment, making them suitable for resource-limited settings. For instance, Kenya and Egypt are expanding vaccination programs utilizing lyophilized intramuscular drugs. The reduced need for professional supervision and faster patient recovery times make this route increasingly popular. Rising awareness about self-administration and long-acting injectables also contributes to its growth.
- By End User
On the basis of end user, the market is segmented into hospitals, clinics, home healthcare, and others. The hospital segment held the largest share in 2024, supported by the high volume of injectable drug usage in inpatient and emergency settings. Hospitals serve as the primary point of care for oncology, infectious diseases, and critical conditions requiring lyophilized drugs. Their centralized procurement systems and controlled storage environments favor lyophilized formulations. For instance, hospitals in Saudi Arabia and Egypt have implemented advanced cold-chain solutions for large-scale injectable drug management. The availability of trained medical staff further drives segment dominance.
The home healthcare segment is forecasted to grow at the fastest CAGR, driven by the increasing shift toward self-administered injectable therapies and remote patient monitoring. Patients prefer lyophilized injectables due to their ease of reconstitution and portability. For instance, in the UAE and South Africa, patients managing hormonal and autoimmune disorders are increasingly using home-based injectable kits. The growth of telemedicine and e-health platforms has improved access to guidance for at-home administration. Rising healthcare costs are also pushing patients toward convenient, at-home treatment options.
- By Distribution Channel
On the basis of distribution channel, the market is segmented into direct tender, retail sales, and others. The direct tender segment dominated the market in 2024, as public hospitals and government healthcare systems procure lyophilized drugs in bulk through centralized tenders. This ensures consistent supply and cost control across the healthcare network. Saudi Arabia’s unified procurement system under the National Unified Procurement Company (NUPCO) and Egypt’s Ministry of Health bulk purchasing programs support this dominance. Direct tendering also ensures quality assurance and pricing transparency for essential medicines. The segment benefits from strong governmental support for healthcare accessibility and pharmaceutical localization.
The retail sales segment is expected to expand at the fastest rate during the forecast period due to the growing presence of specialized pharmacies and distribution chains offering injectable formulations. For instance, private pharmacy chains in the UAE and South Africa are increasing their stock of lyophilized biologics and chronic disease injectables. Rising consumer awareness and convenience of purchasing through local pharmacies drive this segment’s momentum. The growth of e-pharmacies and licensed online distributors also contributes to expanding retail reach across urban and semi-urban markets.
Middle East and Africa Lyophilized Injectable Drugs Market Regional Analysis
- Saudi Arabia dominated the Middle East and Africa lyophilized injectable drugs market with the largest revenue share of 32.8% in 2024, attributed to strong governmental healthcare reforms, robust pharmaceutical manufacturing initiatives under Vision 2030, and expanding hospital infrastructure
- Countries such as Saudi Arabia, the United Arab Emirates, and South Africa are leading the adoption, owing to expanding pharmaceutical manufacturing capabilities and government investments in healthcare infrastructure
- Furthermore, the rising prevalence of chronic diseases such as cancer, autoimmune disorders, and respiratory ailments has increased the demand for lyophilized drugs that ensure extended shelf life and consistent efficacy
The Saudi Arabia Lyophilized Injectable Drugs Market Insight
The Saudi Arabia lyophilized injectable drugs market held the largest revenue share in the Middle East and Africa in 2024, fueled by robust government investment in domestic drug production under Vision 2030 and increasing demand for advanced parenteral formulations. The country’s expanding biopharmaceutical sector and emphasis on self-sufficiency in healthcare products are key growth enablers. In addition, strategic partnerships with global pharmaceutical players to establish local manufacturing units are strengthening the supply of lyophilized drugs. Rising hospital infrastructure and an increasing focus on oncology and infectious disease treatments further contribute to market growth.
United Arab Emirates Lyophilized Injectable Drugs Market Insight
The UAE lyophilized injectable drugs market is anticipated to grow at a substantial CAGR during the forecast period, supported by expanding healthcare infrastructure, strong regulatory frameworks, and the government’s focus on life sciences innovation. The growing preference for lyophilized injectables in specialty care settings and the country’s investment in pharmaceutical free zones such as Dubai Science Park are accelerating adoption. Furthermore, increasing collaborations between local distributors and multinational drug manufacturers are enhancing access to high-quality sterile injectables. The UAE’s role as a medical hub in the Gulf region continues to attract major players to strengthen their footprint in the market.
South Africa Lyophilized Injectable Drugs Market Insight
The South Africa lyophilized injectable drugs market is projected to expand at a significant CAGR during the forecast period, driven by growing prevalence of chronic and infectious diseases and increasing public healthcare expenditure. The country’s pharmaceutical industry is focusing on expanding its sterile manufacturing capabilities, particularly in oncology and anti-infective drugs. Government-led initiatives to improve local production capacity and reduce import dependency are fostering market development. Moreover, rising awareness about the benefits of lyophilized formulations in ensuring drug stability and longer shelf life is propelling adoption in both public and private healthcare sectors.
Egypt Lyophilized Injectable Drugs Market Insight
The Egypt lyophilized injectable drugs market is expected to witness robust growth over the forecast period, attributed to a rapidly expanding population, growing healthcare spending, and increasing investments in domestic drug manufacturing. The government’s efforts to localize pharmaceutical production and partnerships with international players to introduce advanced lyophilization technologies are enhancing market capacity. The strong demand for oncology and anti-infective injectables is also driving segment expansion. Furthermore, favorable regulatory policies and initiatives promoting healthcare access in rural regions are supporting broader adoption of lyophilized formulations.
Middle East and Africa Lyophilized Injectable Drugs Market Share
The Middle East and Africa Lyophilized Injectable Drugs industry is primarily led by well-established companies, including:
- Pfizer Inc. (U.S.)
- Sanofi (France)
- GSK plc. (U.K.)
- F. Hoffmann-La Roche Ltd (Switzerland)
- Novartis AG (Switzerland)
- Merck & Co., Inc., (U.S.)
- Johnson & Johnson Services, Inc. (U.S.)
- Baxter (U.S.)
- Fresenius Kabi AG (Germany)
- B. Braun SE (Germany)
- Teva Pharmaceutical Industries Ltd. (Israel)
- Hikma Pharmaceuticals PLC (Jordan)
- Gulf Pharmaceutical Industries (U.A.E.)
- Aspen Pharmacare Holdings Limited (South Africa)
- Cipla (India)
- Viatris Inc. (U.S.)
- Amgen Inc. (U.S.)
- Novo Nordisk A/S (Denmark)
- Biocon Limited (India)
What are the Recent Developments in Middle East and Africa Lyophilized Injectable Drugs Market?
- In February 2025, the Africa CDC reported concrete progress via its “2nd Vaccines & Other Health Products Manufacturing Forum” (held in Cairo) where new partnerships and operational milestones were announced under the AVMA umbrella. For example, an Egyptian company EVA Pharma partnered with European biotech firms to establish an “end-to-biologics/mRNA development & production platform” in Africa
- In June 2024, Gavi, the Vaccine Alliance, in collaboration with the Africa Centres for Disease Control and Prevention (Africa CDC) and the African Union, officially launched the African Vaccine Manufacturing Accelerator (AVMA), a financing mechanism expected to put up to US USD 1.0-1.2 billion over ten years toward developing vaccine (and health-product) manufacturing in Africa
- In September 2021, Sinovac Biotech announced it was in talks to establish a manufacturing facility in South Africa (or partner with one) that would cover vaccine production for Africa, including bottling, labelling and eventually full production
- In August 2021, Egypt announced that its new VACSERA facility (dubbed a “vaccine city” in media) would begin operations around November 2021 and aim for annual capacity of roughly one billion doses, positioning Egypt as a hub for vaccine supply to Africa
- In June 2021, VACSERA (Egypt) and Sinovac Biotech signed an agreement to begin local production of the Sinovac COVID-19 vaccine in Egypt and the wider African region marking an early step in regionalizing injectable vaccine manufacture. According to Reuters, Egypt planned to begin producing vials around mid-June, after receiving raw materials for an initial set of doses
SKU-

- Interactive Data Analysis Dashboard
- Company Analysis Dashboard for high growth potential opportunities
- Research Analyst Access for customization & queries
- Competitor Analysis with Interactive dashboard
- Latest News, Updates & Trend analysis
- Harness the Power of Benchmark Analysis for Comprehensive Competitor Tracking
Data collection and base year analysis are done using data collection modules with large sample sizes. The stage includes obtaining market information or related data through various sources and strategies. It includes examining and planning all the data acquired from the past in advance. It likewise envelops the examination of information inconsistencies seen across different information sources. The market data is analysed and estimated using market statistical and coherent models. Also, market share analysis and key trend analysis are the major success factors in the market report. To know more, please request an analyst call or drop down your inquiry.
The key research methodology used by DBMR research team is data triangulation which involves data mining, analysis of the impact of data variables on the market and primary (industry expert) validation. Data models include Vendor Positioning Grid, Market Time Line Analysis, Market Overview and Guide, Company Positioning Grid, Patent Analysis, Pricing Analysis, Company Market Share Analysis, Standards of Measurement, Global versus Regional and Vendor Share Analysis. To know more about the research methodology, drop in an inquiry to speak to our industry experts.
Data Bridge Market Research is a leader in advanced formative research. We take pride in servicing our existing and new customers with data and analysis that match and suits their goal. The report can be customized to include price trend analysis of target brands understanding the market for additional countries (ask for the list of countries), clinical trial results data, literature review, refurbished market and product base analysis. Market analysis of target competitors can be analyzed from technology-based analysis to market portfolio strategies. We can add as many competitors that you require data about in the format and data style you are looking for. Our team of analysts can also provide you data in crude raw excel files pivot tables (Fact book) or can assist you in creating presentations from the data sets available in the report.


