
Middle East And Africa Mass Spectrometry Market
Market Size in USD Billion
 USD
2.81 Billion
USD
5.32 Billion
2024
2032
USD
2.81 Billion
USD
5.32 Billion
2024
2032
| 2025 - 2032 | |
| USD 2.81 Billion | |
| USD 5.32 Billion | |
| % | |
|
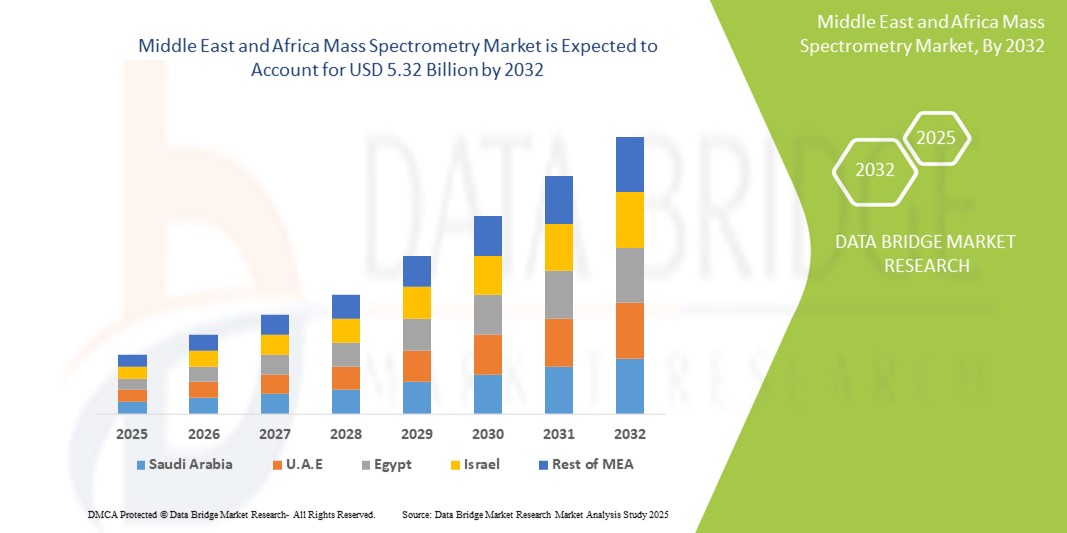
Middle East and Africa Mass Spectrometry Market Size
- The Middle East and Africa mass spectrometry market size was valued at USD 2.81 billion in 2024 and is expected to reach USD 5.32 billion by 2032, at a CAGR of 8.30% during the forecast period
- The market growth is largely fueled by the increasing demand for advanced diagnostic tools and analytical instrumentation in pharmaceutical, biotechnology, and environmental testing sectors, particularly as healthcare and research infrastructure continues to evolve across the region
- Furthermore, the rising prevalence of chronic diseases, growing government support for scientific research, and increasing adoption of high-throughput technologies are driving the integration of mass spectrometry in clinical and research applications. These converging factors are accelerating the adoption of mass spectrometry solutions, thereby significantly boosting the industry's growth
Middle East and Africa Mass Spectrometry Market Analysis
- Mass spectrometry, a powerful analytical technique used to identify and quantify chemical compounds, is becoming increasingly important in the Middle East and Africa for applications across pharmaceuticals, environmental testing, food safety, and clinical diagnostics due to its high sensitivity, accuracy, and ability to analyze complex mixtures
- The growing demand for mass spectrometry is primarily driven by expanding healthcare and research sectors, rising incidence of chronic and infectious diseases, and increasing regulatory emphasis on drug safety and environmental monitoring
- Saudi Arabia dominated the Middle East and Africa mass spectrometry market with the largest revenue share of 35.1% in 2024, supported by strong government investments in healthcare infrastructure, pharmaceutical research, and the establishment of modern laboratories through national health and science initiatives
- South Africa is expected to be the fastest-growing country in the Middle East and Africa mass spectrometry market during the forecast period due to growing research activities, academic collaborations, and the need for advanced diagnostic tools
- The hybrid mass spectrometry segment dominated the Middle East and Africa mass spectrometry market with a market share of 41.7% in 2024, driven by its superior analytical performance and widespread use in clinical diagnostics, proteomics, and drug discovery applications across GCC countries and South Africa
Report Scope and Middle East and Africa Mass Spectrometry Market Segmentation
|
Attributes |
Middle East and Africa Mass Spectrometry Key Market Insights |
|
Segments Covered |
|
|
Countries Covered |
Middle East and Africa
|
|
Key Market Players |
|
|
Market Opportunities |
|
|
Value Added Data Infosets |
In addition to the insights on market scenarios such as market value, growth rate, segmentation, geographical coverage, and major players, the market reports curated by the Data Bridge Market Research also include in-depth expert analysis, pricing analysis, brand share analysis, consumer survey, demography analysis, supply chain analysis, value chain analysis, raw material/consumables overview, vendor selection criteria, PESTLE Analysis, Porter Analysis, and regulatory framework. |
Middle East and Africa Mass Spectrometry Market Trends
“Rising Integration of Mass Spectrometry in Clinical and Environmental Applications”
- A significant and accelerating trend in the Middle East and Africa mass spectrometry market is the expanding integration of this analytical technology across clinical diagnostics and environmental testing sectors, driven by rising public health concerns, increased pollution monitoring, and growing emphasis on precision medicine
- For instance, healthcare institutions across Saudi Arabia and the UAE are increasingly incorporating mass spectrometry techniques such as LC-MS/MS for the early detection of metabolic and infectious diseases, as they provide high specificity and sensitivity over conventional diagnostic tools
- Environmental agencies across the region, particularly in South Africa, are leveraging mass spectrometry to monitor air and water quality, detect heavy metals, and ensure compliance with evolving environmental standards. Government-supported research programs are further encouraging the deployment of advanced analytical systems in laboratories and universities
- The technology is also witnessing increased adoption in food safety testing and forensic science, with public and private laboratories investing in hybrid and high-resolution mass spectrometers for complex compound analysis
- This rising cross-sector adoption is reshaping the regional demand landscape, encouraging vendors to introduce more application-specific, compact, and user-friendly mass spectrometry systems. Companies such as Thermo Fisher Scientific and Agilent Technologies are expanding their presence through partnerships and distributor networks to cater to this growing need
- The growing importance of regulatory compliance, accurate diagnostics, and real-time analysis is driving mass spectrometry’s integration into critical sectors, solidifying its role as a cornerstone technology in regional scientific and industrial development
Middle East and Africa Mass Spectrometry Market Dynamics
Driver
“Increasing Demand from Clinical Diagnostics and Pharmaceutical Research”
- The growing need for accurate, rapid, and sensitive analytical tools in clinical diagnostics and pharmaceutical development is a key driver of the Middle East and Africa mass spectrometry market
- For instance, in 2024, several hospitals and diagnostic centers in Saudi Arabia and the UAE expanded their capabilities by investing in LC-MS/MS and hybrid mass spectrometry systems for high-throughput analysis of disease biomarkers and therapeutic drug monitoring
- As governments in the region increase their healthcare expenditure and support for biomedical research, institutions are prioritizing mass spectrometry for its ability to deliver precise molecular insights essential for targeted treatment and vaccine development
- Additionally, the pharmaceutical industry in countries like Egypt and South Africa is turning to mass spectrometry for quality control, metabolomics, and compound characterization, driving sustained equipment demand
- The push towards personalized medicine, coupled with the expansion of clinical laboratories and academic research centers, is further accelerating the integration of mass spectrometry technologies in healthcare and life sciences applications across the region
Restraint/Challenge
“High Cost and Technical Skill Requirements”
- One of the major challenges facing the Middle East and Africa mass spectrometry market is the high initial cost of instruments and the need for specialized technical expertise to operate and interpret results
- For instance, advanced hybrid mass spectrometry systems can require significant capital investment, which may limit adoption among smaller laboratories or research centers with constrained budgets
- Furthermore, the operation of mass spectrometry equipment demands skilled personnel for sample preparation, instrument calibration, and data analysis, which can be a barrier in regions with limited access to trained analytical chemists or laboratory scientists
- While vendors are working to introduce more automated and user-friendly systems, the technical complexity of mass spectrometry continues to restrict broader penetration, particularly in low-resource settings or rural areas
- Addressing this challenge will require coordinated efforts in workforce training, capacity building through academic partnerships, and the availability of cost-effective solutions tailored to the region’s specific application needs
Middle East and Africa Mass Spectrometry Market Scope
The market is segmented on the basis of technology, modality, application, end user, and distribution channel.
- By Technology
On the basis of technology, the Middle East and Africa mass spectrometry market is segmented into hybrid mass spectrometry, single mass spectrometry, and others. The hybrid mass spectrometry segment dominated the market with the largest revenue share of 41.7% in 2024, driven by its enhanced sensitivity, resolution, and accuracy in complex sample analysis. Its superior performance in proteomics, metabolomics, and pharmacokinetics studies makes it highly valuable for research and clinical laboratories in countries like Saudi Arabia and South Africa. The growing demand for precision diagnostics and advanced analytical techniques continues to drive the adoption of hybrid systems across the region.
The single mass spectrometry segment is expected to register the fastest growth from 2025 to 2032, owing to its affordability and suitability for routine analysis in food testing, petrochemical, and academic applications. Many smaller laboratories and institutions prefer single mass spectrometry systems for basic quantitative and qualitative analysis due to lower operational complexity and cost-effectiveness.
- By Modality
On the basis of modality, the Middle East and Africa mass spectrometry market is segmented into benchtop and standalone. The benchtop segment dominated the market with the largest market revenue share in 2024, attributed to its high usage in clinical and pharmaceutical laboratories for research, drug discovery, and quality control applications. Benchtop systems offer flexibility and integration with chromatography systems, making them the preferred choice for high-performance analytical environments.
The standalone segment is expected to witness the fastest CAGR from 2025 to 2032, driven by its portability and suitability for on-site testing in environmental monitoring, forensic investigations, and field-based applications, especially in remote or underserved regions.
- By Application
On the basis of application, the market is segmented into life science research, drug discovery, environmental testing, food testing, applied industries, clinical diagnostics, and others. The clinical diagnostics segment dominated the market with the largest market revenue share in 2024, driven by increasing use of mass spectrometry in biomarker analysis, metabolic screening, and infectious disease testing, particularly in hospitals and diagnostics centers across Saudi Arabia and South Africa.
The environmental testing segment is anticipated to witness the fastest growth rate from 2025 to 2032, fueled by rising environmental awareness and government regulations on pollution control and water quality assessment across the region.
- By End User
On the basis of end user, the Middle East and Africa mass spectrometry market is segmented into pharmaceutical industry, research and academic institutes, food & beverage industry, petrochemical industry, and others. The pharmaceutical industry segment dominated the market with the largest market revenue share in 2024, due to mass spectrometry’s critical role in drug development, validation, and quality assurance processes. Significant investment by pharmaceutical manufacturers in Saudi Arabia and Egypt is contributing to the demand.
The research and academic institutes segment is expected to witness the fastest growth from 2025 to 2032, supported by growing government funding, international collaborations, and expanding university-based laboratory infrastructure across the region.
- By Distribution Channel
On the basis of distribution channel, the Middle East and Africa mass spectrometry market is segmented into direct tenders, retail sales, and others. The direct tenders segment held the largest market revenue share in 2024, driven by bulk equipment procurement by hospitals, public laboratories, and government-funded institutions through centralized purchasing systems, particularly in the GCC region.
The retail sales segment is expected to witness the fastest CAGR from 2025 to 2032, due to increasing availability of mass spectrometry systems through specialized distributors and online platforms, catering to the needs of smaller labs and private clinics in urban areas.
Middle East and Africa Mass Spectrometry Market Regional Analysis
- Saudi Arabia dominated the Middle East and Africa mass spectrometry market with the largest revenue share of 35.1% in 2024, supported by strong government investments in healthcare infrastructure, pharmaceutical research, and the establishment of modern laboratories through national health and science initiatives
- The country’s emphasis on advancing medical diagnostics and scientific research has led to increased deployment of advanced mass spectrometry systems in hospitals, research institutions, and environmental agencies
- This growth is further supported by national health strategies, rising demand for precision medicine, and collaborations with global analytical instrument manufacturers, establishing mass spectrometry as a crucial technology across both public and private sector
The Saudi Arabia Mass Spectrometry Market Insight
The Saudi Arabia mass spectrometry market captured the largest revenue share in the Middle East and Africa region in 2024, supported by national health transformation programs and robust investments in scientific research. The country’s focus on biotechnology, pharmaceutical innovation, and clinical diagnostics has spurred the installation of hybrid and LC-MS systems in leading hospitals and research centers. With a vision to establish itself as a regional healthcare and research hub, Saudi Arabia continues to lead in adopting high-end analytical technologies.
South Africa Mass Spectrometry Market Insight
The South Africa mass spectrometry market is projected to grow at a notable CAGR during the forecast period, driven by a rising need for environmental testing, food quality assurance, and academic research. Government initiatives aimed at enhancing laboratory capacity and increasing regulatory scrutiny in industries such as mining, agriculture, and pharmaceuticals are propelling demand. Additionally, universities and research institutes are playing a key role in expanding applications of mass spectrometry in proteomics and disease biomarker studies.
United Arab Emirates (UAE) Mass Spectrometry Market Insight
The UAE mass spectrometry market is expected to expand steadily, fueled by advancements in diagnostic technologies and strong support for innovation in the life sciences sector. The country's investment in medical tourism, research collaborations, and laboratory automation is enhancing the adoption of mass spectrometry in both public and private sectors. Demand for portable and user-friendly systems is also growing, particularly in clinical diagnostics and food safety applications, aligning with the UAE’s focus on health security and sustainability.
Middle East and Africa Mass Spectrometry Market Share
The Middle East and Africa mass spectrometry industry is primarily led by well-established companies, including:
- Thermo Fisher Scientific Inc. (U.S.)
- Agilent Technologies, Inc. (U.S.)
- Waters Corporation (U.S.)
- Bruker Corporation (U.S.)
- Shimadzu Corporation (Japan)
- PerkinElmer (U.S.)
- JEOL Ltd. (Japan)
- LECO Corporation (U.S.)
- Analytik Jena GmbH (Germany)
- Hitachi High-Tech Corporation (Japan)
- Danaher Corporation (U.S.)
- MKS Instruments, Inc. (U.S.)
- Biotage AB (Sweden)
- Advion, Inc. (U.S.)
- KNAUER Wissenschaftliche Geräte GmbH (Germany)
- Hiden Analytical Ltd. (U.K.)
- MassTech, Inc. (U.S.)
- Isotopx Ltd. (U.K.)
- Markes International Ltd. (U.K.)
What are the Recent Developments in Middle East and Africa Mass Spectrometry Market?
- In May 2024, Thermo Fisher Scientific Inc. announced the expansion of its operations in the United Arab Emirates through the establishment of a regional training and application support center. This facility is designed to enhance the adoption and operational efficiency of advanced analytical instruments, including mass spectrometry systems, across the Middle East. The initiative underscores Thermo Fisher’s commitment to providing localized technical support and fostering skill development among laboratory professionals in the region
- In April 2024, Agilent Technologies Inc. partnered with King Abdullah University of Science and Technology (KAUST) in Saudi Arabia to support ongoing research in metabolomics and proteomics using state-of-the-art hybrid mass spectrometry platforms. This collaboration aims to strengthen the country’s scientific capabilities in molecular diagnostics and drug discovery, contributing to the broader goal of building a knowledge-based economy under Saudi Vision 2030
- In March 2024, Waters Corporation launched a mobile mass spectrometry outreach program in South Africa in collaboration with local universities and healthcare institutions. The program is designed to promote awareness, education, and accessibility to high-resolution mass spectrometry technologies for students, researchers, and diagnostic labs in underserved areas. This initiative reflects Waters’ focus on capacity building and advancing analytical science in emerging markets
- In February 2024, Bruker Corporation announced the installation of its timsTOF Pro 2 mass spectrometer at the American University in Cairo, marking a significant upgrade in Egypt’s proteomics research capabilities. The system will be utilized for advanced biomedical and pharmaceutical studies, facilitating high-throughput analysis and biomarker discovery. This move highlights Bruker’s dedication to supporting life science research across Africa through innovative instrumentation
- In January 2024, Shimadzu Corporation expanded its distributor network across the Middle East to strengthen regional accessibility and after-sales support for its mass spectrometry product line. This strategic move aims to meet growing demand in clinical diagnostics, food safety testing, and environmental monitoring. Shimadzu’s investment in regional infrastructure demonstrates its commitment to fostering scientific excellence and market presence in the Middle East and Africa
SKU-

- Interactive Data Analysis Dashboard
- Company Analysis Dashboard for high growth potential opportunities
- Research Analyst Access for customization & queries
- Competitor Analysis with Interactive dashboard
- Latest News, Updates & Trend analysis
- Harness the Power of Benchmark Analysis for Comprehensive Competitor Tracking
Table of Content
1 INTRODUCTION
1.1 OBJECTIVES OF THE STUDY
1.2 MARKET DEFINITION
1.3 OVERVIEW OF MEA, SAUDI ARABIA AND SEA CAR-T CELL THERAPY TREATMENT MARKET
1.4 CURRENCY AND PRICING
1.5 LIMITATIONS
1.6 MARKETS COVERED
2 MARKET SEGMENTATION
2.1 MARKETS COVERED
2.2 GEOGRAPHICAL SCOPE
2.3 YEARS CONSIDERED FOR THE STUDY
2.4 DBMR TRIPOD DATA VALIDATION MODEL
2.5 PRIMARY INTERVIEWS WITH KEY OPINION LEADERS
2.6 MULTIVARIATE MODELLING
2.7 MARKET APPLICATION COVERAGE GRID
2.8 PRODUCT LIFELINE CURVE
2.9 DBMR MARKET POSITION GRID
2.1 VENDOR SHARE ANALYSIS
2.11 SECONDARY SOURCES
2.12 ASSUMPTIONS
3 EXECUTIVE SUMMARY
4 PREMIUM INSIGHT
4.1 PESTEL ANALYSIS
4.2 PORTER’S FIVE FORCES
4.3 PIPELINE ANALYSIS
5 MARKET OVERVIEW
5.1 DRIVERS
5.1.1 INCREASING PREVALENCE OF CANCER AND OTHER TARGET DISEASES
5.1.2 GROWING AWARENESS AND ACCEPTANCE OF CAR-T CELL THERAPY
5.1.3 SUPPORTIVE GOVERNMENT INITIATIVES AND FUNDING FOR HEALTHCARE INNOVATION
5.2 RESTRAINTS
5.2.1 HIGH COST OF CAR-T CELL THERAPY
5.2.2 REGULATORY HURDLES RESULT THE DELAY IN CAR T-CELL THERAPY APPROVAL
5.3 OPPORTUNITIES
5.3.1 THE EXTENSIVE PIPELINE OF CAR-T CELL THERAPY
5.3.2 THE DEVELOPMENT OF NOVEL THERAPIES AND COMBINATION TREATMENTS
5.4 CHALLENGES
5.4.1 POTENTIAL RISKS AND ADVERSE EFFECTS OF TREATMENT
5.4.2 COMPETITION FROM ALTERNATIVE TREATMENTS AND THERAPIES
6 MEA, SAUDI ARABIA AND SEA CAR-T CELL THERAPY TREATMENTN MARKET, BY PRODUCT
6.1 OVERVIEW
6.2 AUTOLOGOUS CAR-T CELLS
6.3 ALLOGENEIC CAR-T CELLS
7 MEA, SAUDI ARABIA AND SEA CAR-T CELL THERAPY MARKET BY STRUCTURE
7.1 OVERVIEW
7.2 SECOND GENERATION CAR-T CELLS
7.3 THIRD GENERATION CAR-T CELLS
7.4 FOURTH GENERATION CAR-T CELLS
7.5 FIRST GENERATION CAR-T CELLS
8 MEA, SAUDI ARABIA AND SEA CAR-T CELL THERAPY MARKET, BY TARGET ANTIGEN
8.1 OVERVIEW
8.2 ANTIGENS ON HEMATOLOGIC MALIGNANCIES
8.2.1 CLUSTER OF DIFFERENTIATION-19 (CD-19)
8.2.2 CLUSTER OF DIFFERENTIATION-30 (CD-30)
8.2.3 CLUSTER OF DIFFERENTIATION-22 (CD-22)
8.2.4 CLUSTER OF DIFFERENTIATION-20 (CD-20)
8.2.5 CLUSTER OF DIFFERENTIATION-33 (CD-33)
8.3 ANTIGENS ON SOLID TUMORS
8.4 OTHERS
9 MEA, SAUDI ARABIA AND SEA CAR-T CELL THERAPY MARKET, BY BRAND
9.1 OVERVIEW
9.2 KYMRIAH
9.3 YESCARTA
9.4 TECARTUS
9.5 OTHERS
10 MEA, SAUDI ARABIA AND SEA CAR-T CELL THERAPY MARKET, BY THERAPEUTICS APPLICATION
10.1 OVERVIEW
10.2 DIFFUSE LARGE B-CELL LYMPHOMA
10.3 FOLLICULAR LYMPHOMA
10.4 ACUTE LYMPHOBLASTIC LEUKAEMIA (ALL)
10.5 MANTLE CELL LYMPHOMA
10.6 MULTIPLE MYELOMA
10.7 LUNG CANCER
10.8 CHRONIC LYMPHOCYTIC LEUKEMIA
10.9 GASTRIC CANCER
10.1 PANCREATIC CANCER
10.11 BREAST CANCER
10.12 OTHERS
11 MEA, SAUDI ARABIA AND SEA CAR-T CELL THERAPY MARKET, BY END USER
11.1 OVERVIEW
11.2 HOSPITALS
11.3 SPECIALTY CLINICS
11.4 OTHERS
12 MEA, SAUDI ARABIA AND SEA CAR-T CELL THERAPY MARKET BY, DISTRIBUTION CHANNEL
12.1 OVERVIEW
12.2 HOSPITAL PHARMACY
12.3 OTHERS
13 MEA, SAUDI ARABIA, SEA CAR-T CELL THERAPY MARKET, BY COUNTRY
13.1 MEA
13.1.1 SAUDI ARABIA
13.1.2 U.A.E.
13.1.3 SOUTH AFRICA
13.1.4 ISRAEL
13.1.5 KUWAIT
13.1.6 EGYPT
13.1.7 REST OF MIDDLE EAST & AFRICA
13.2 SEA
13.2.1 SINGAPORE
13.2.2 MALAYSIA
13.2.3 THAILAND
13.2.4 INDONESIA
13.2.5 PHILIPPINES
13.2.6 VIETNAM
14 MEA AND SEA CAR-T CELL THERAPY MARKET: COMPANY LANDSCAPE
14.1 COMPANY SHARE ANALYSIS: MEA
14.2 COMPANY SHARE ANALYSIS: NORTH AMERICA
15 SWOT ANALYSIS
16 COMPANY PROFILE
16.1 NOVARTIS AG
16.1.1 COMPANY SNAPSHOT
16.1.2 REVENUE ANALYSIS
16.1.3 PRODUCT PORTFOLIO
16.1.4 RECENT DEVELOPMENTS
16.2 GILEAD SCIENCES, INC.
16.2.1 COMPANY SNAPSHOT
16.2.2 REVENUE ANALYSIS
16.2.3 PRODUCT PORTFOLIO
16.2.4 RECENT DEVELOPMENTS
16.3 BRISTOL-MYERS SQUIBB COMPANY
16.3.1 COMPANY SNAPSHOT
16.3.2 REVENUE ANALYSIS
16.3.3 PRODUCT PORTFOLIO
16.3.4 RECENT DEVELOPMENTS
16.4 JOHNSON & JOHNSON SERVICES, INC.
16.4.1 COMPANY SNAPSHOT
16.4.2 REVENUE ANALYSIS
16.4.3 PRODUCT PORTFOLIO
16.4.4 RECENT DEVELOPMENTS
17 QUESTIONNAIRE
18 RELATED REPORTS
List of Table
TABLE 1 MEA, SAUDI ARABIA AND SEA CAR-T CELL THERAPY TREATMENT MARKET, PIPELINE ANALYSIS
TABLE 2 TOTAL STATISTICS OF PREVELENCE RATE OF CANCER -2022(KENYA)
TABLE 3 SEA CAR-T CELL THERAPY TREATMENT MARKET, BY PRODUCT, 2022-2031 (USD MILLION)
TABLE 4 MEA CAR-T CELL THERAPY TREATMENT MARKET, BY PRODUCT, 2022-2031 (USD MILLION)
TABLE 5 SEA CAR-T CELL THERAPY TREATMENT MARKET, BY STRUCTURE, 2022-2031 (USD MILLION)
TABLE 6 MEA CAR-T CELL THERAPY TREATMENT MARKET, BY STRUCTURE, 2022-2031 (USD MILLION)
TABLE 7 SEA CAR-T CELL THERAPY TREATMENT MARKET, BY TARGET ANTIGEN, 2022-2031 (USD MILLION)
TABLE 8 MEA CAR-T CELL THERAPY TREATMENT MARKET, BY TARGET ANTIGEN, 2022-2031 (USD MILLION)
TABLE 9 SEA ANTIGENS ON HEMATOLOGIC MALIGNANCIES IN CAR-T CELL THERAPY TREATMENT MARKET, BY TARGETED ANTIGENS, 2022-2031 (USD MILLION)
TABLE 10 MEA ANTIGENS ON HEMATOLOGIC MALIGNANCIES IN CAR-T CELL THERAPY TREATMENT MARKET, BY TARGETED ANTIGENS, 2022-2031 (USD MILLION)
TABLE 11 SEA ANTIGENS ON SOLID TUMORS IN CAR-T CELL THERAPY TREATMENT MARKET, BY TARGETED ANTIGENS, 2022-2031 (USD MILLION)
TABLE 12 MEA ANTIGENS ON SOLID TUMORS IN CAR-T CELL THERAPY TREATMENT MARKET, BY TARGETED ANTIGENS, 2022-2031 (USD MILLION)
TABLE 13 SEA CAR-T CELL THERAPY TREATMENT MARKET, BY BRAND, 2022-2031 (USD MILLION)
TABLE 14 MEA CAR-T CELL THERAPY TREATMENT MARKET, BY BRAND, 2022-2031 (USD MILLION)
TABLE 15 SEA CAR-T CELL THERAPY TREATMENT MARKET, BY THERAPEUTICS APPLICATION, 2022-2031 (USD MILLION)
TABLE 16 MEA CAR-T CELL THERAPY TREATMENT MARKET, BY THERAPEUTICS APPLICATION, 2022-2031 (USD MILLION)
TABLE 17 SEA CAR-T CELL THERAPY TREATMENT MARKET, BY END USER, 2022-2031 (USD MILLION)
TABLE 18 MEA CAR-T CELL THERAPY TREATMENT MARKET, BY END USER, 2022-2031 (USD MILLION)
TABLE 19 SEA CAR-T CELL THERAPY TREATMENT MARKET, BY DISTRIBUTION CHANNEL, 2022-2031 (USD MILLION)
TABLE 20 MEA CAR-T CELL THERAPY TREATMENT MARKET, BY END USER, 2022-2031 (USD MILLION)
TABLE 21 MIDDLE EAST & AFRICA CAR-T CELL THERAPY TREATMENT MARKET, BY REGION, 2022-2031 (USD MILLION)
TABLE 22 SAUDI ARABIA CAR-T CELL THERAPY TREATMENT MARKET, BY PRODUCT, 2022-2031 (USD MILLION)
TABLE 23 SAUDI ARABIA CAR-T CELL THERAPY TREATMENT MARKET, BY STRUCTURE 2022-2031 (USD MILLION)
TABLE 24 SAUDI ARABIA CAR-T CELL THERAPY TREATMENT MARKET, BY TARGETED ANTIGENS, 2022-2031 (USD MILLION)
TABLE 25 SAUDI ARABIA ANTIGENS ON HEMATOLOGIC MALIGNANCIES IN CAR-T CELL THERAPY TREATMENT MARKET, BY TARGETED ANTIGENS, 2022-2031 (USD MILLION)
TABLE 26 SAUDI ARABIA CAR-T CELL THERAPY TREATMENT MARKET, BY BRAND, 2022-2031 (USD MILLION)
TABLE 27 SAUDI ARABIA CAR-T CELL THERAPY TREATMENT MARKET, BY THERAPEUTIC APPLICATION, 2022-2031 (USD MILLION)
TABLE 28 SAUDI ARABIA CAR-T CELL THERAPY TREATMENT MARKET, BY END USER, 2022-2031 (USD MILLION)
TABLE 29 SAUDI ARABIA CAR-T CELL THERAPY TREATMENT MARKET, BY DISTRIBUTION CHANNEL, 2022-2031 (USD MILLION)
TABLE 30 U.A.E. CAR-T CELL THERAPY TREATMENT MARKET, BY PRODUCT, 2022-2031 (USD MILLION)
TABLE 31 U.A.E. CAR-T CELL THERAPY TREATMENT MARKET, BY STRUCTURE 2022-2031 (USD MILLION)
TABLE 32 U.A.E. CAR-T CELL THERAPY TREATMENT MARKET, BY TARGETED ANTIGENS, 2022-2031 (USD MILLION)
TABLE 33 U.A.E. ANTIGENS ON HEMATOLOGIC MALIGNANCIES IN CAR-T CELL THERAPY TREATMENT MARKET, BY TARGETED ANTIGENS, 2022-2031 (USD MILLION)
TABLE 34 U.A.E. CAR-T CELL THERAPY TREATMENT MARKET, BY BRAND, 2022-2031 (USD MILLION)
TABLE 35 U.A.E. CAR-T CELL THERAPY TREATMENT MARKET, BY THERAPEUTIC APPLICATION, 2022-2031 (USD MILLION)
TABLE 36 U.A.E. CAR-T CELL THERAPY TREATMENT MARKET, BY END USER, 2022-2031 (USD MILLION)
TABLE 37 U.A.E. CAR-T CELL THERAPY TREATMENT MARKET, BY DISTRIBUTION CHANNEL, 2022-2031 (USD MILLION)
TABLE 38 SOUTH AFRICA CAR-T CELL THERAPY TREATMENT MARKET, BY PRODUCT, 2022-2031 (USD MILLION)
TABLE 39 SOUTH AFRICA CAR-T CELL THERAPY TREATMENT MARKET, BY STRUCTURE 2022-2031 (USD MILLION)
TABLE 40 SOUTH AFRICA CAR-T CELL THERAPY TREATMENT MARKET, BY TARGETED ANTIGENS, 2022-2031 (USD MILLION)
TABLE 41 SOUTH AFRICA ANTIGENS ON HEMATOLOGIC MALIGNANCIES IN CAR-T CELL THERAPY TREATMENT MARKET, BY TARGETED ANTIGENS, 2022-2031 (USD MILLION)
TABLE 42 SOUTH AFRICA CAR-T CELL THERAPY TREATMENT MARKET, BY BRAND, 2022-2031 (USD MILLION)
TABLE 43 SOUTH AFRICA CAR-T CELL THERAPY TREATMENT MARKET, BY THERAPEUTIC APPLICATION, 2022-2031 (USD MILLION)
TABLE 44 SOUTH AFRICA CAR-T CELL THERAPY TREATMENT MARKET, BY END USER, 2022-2031 (USD MILLION)
TABLE 45 SOUTH AFRICA CAR-T CELL THERAPY TREATMENT MARKET, BY DISTRIBUTION CHANNEL, 2022-2031 (USD MILLION)
TABLE 46 ISRAEL CAR-T CELL THERAPY TREATMENT MARKET, BY PRODUCT, 2022-2031 (USD MILLION)
TABLE 47 ISRAEL CAR-T CELL THERAPY TREATMENT MARKET, BY STRUCTURE 2022-2031 (USD MILLION)
TABLE 48 ISRAEL CAR-T CELL THERAPY TREATMENT MARKET, BY TARGETED ANTIGENS, 2022-2031 (USD MILLION)
TABLE 49 ISRAEL ANTIGENS ON HEMATOLOGIC MALIGNANCIES IN CAR-T CELL THERAPY TREATMENT MARKET, BY TARGETED ANTIGENS, 2022-2031 (USD MILLION)
TABLE 50 ISRAEL CAR-T CELL THERAPY TREATMENT MARKET, BY BRAND, 2022-2031 (USD MILLION)
TABLE 51 ISRAEL CAR-T CELL THERAPY TREATMENT MARKET, BY THERAPEUTIC APPLICATION, 2022-2031 (USD MILLION)
TABLE 52 ISRAEL CAR-T CELL THERAPY TREATMENT MARKET, BY END USER, 2022-2031 (USD MILLION)
TABLE 53 ISRAEL CAR-T CELL THERAPY TREATMENT MARKET, BY DISTRIBUTION CHANNEL, 2022-2031 (USD MILLION)
TABLE 54 KUWAIT CAR-T CELL THERAPY TREATMENT MARKET, BY PRODUCT, 2022-2031 (USD MILLION)
TABLE 55 KUWAIT CAR-T CELL THERAPY TREATMENT MARKET, BY STRUCTURE 2022-2031 (USD MILLION)
TABLE 56 KUWAIT CAR-T CELL THERAPY TREATMENT MARKET, BY TARGETED ANTIGENS, 2022-2031 (USD MILLION)
TABLE 57 KUWAIT ANTIGENS ON HEMATOLOGIC MALIGNANCIES IN CAR-T CELL THERAPY TREATMENT MARKET, BY TARGETED ANTIGENS, 2022-2031 (USD MILLION)
TABLE 58 KUWAIT CAR-T CELL THERAPY TREATMENT MARKET, BY BRAND, 2022-2031 (USD MILLION)
TABLE 59 KUWAIT CAR-T CELL THERAPY TREATMENT MARKET, BY THERAPEUTIC APPLICATION, 2022-2031 (USD MILLION)
TABLE 60 KUWAIT CAR-T CELL THERAPY TREATMENT MARKET, BY END USER, 2022-2031 (USD MILLION)
TABLE 61 KUWAIT CAR-T CELL THERAPY TREATMENT MARKET, BY DISTRIBUTION CHANNEL, 2022-2031 (USD MILLION)
TABLE 62 EGYPT CAR-T CELL THERAPY TREATMENT MARKET, BY PRODUCT, 2022-2031 (USD MILLION)
TABLE 63 EGYPT CAR-T CELL THERAPY TREATMENT MARKET, BY STRUCTURE 2022-2031 (USD MILLION)
TABLE 64 EGYPT CAR-T CELL THERAPY TREATMENT MARKET, BY TARGETED ANTIGENS, 2022-2031 (USD MILLION)
TABLE 65 EGYPT ANTIGENS ON HEMATOLOGIC MALIGNANCIES IN CAR-T CELL THERAPY TREATMENT MARKET, BY TARGETED ANTIGENS, 2022-2031 (USD MILLION)
TABLE 66 EGYPT CAR-T CELL THERAPY TREATMENT MARKET, BY BRAND, 2022-2031 (USD MILLION)
TABLE 67 EGYPT CAR-T CELL THERAPY TREATMENT MARKET, BY THERAPEUTIC APPLICATION, 2022-2031 (USD MILLION)
TABLE 68 EGYPT CAR-T CELL THERAPY TREATMENT MARKET, BY END USER, 2022-2031 (USD MILLION)
TABLE 69 EGYPT CAR-T CELL THERAPY TREATMENT MARKET, BY DISTRIBUTION CHANNEL, 2022-2031 (USD MILLION)
TABLE 70 REST OF MIDDLE EAST & AFRICA CAR-T CELL THERAPY TREATMENT MARKET, BY PRODUCT, 2022-2031 (USD MILLION)
TABLE 71 SEA CAR-T CELL THERAPY TREATMENT MARKET, BY REGION, 2022-2031 (USD MILLION)
TABLE 72 SINGAPORE CAR-T CELL THERAPY TREATMENT MARKET, BY PRODUCT, 2022-2031 (USD MILLION)
TABLE 73 SINGAPORE CAR-T CELL THERAPY TREATMENT MARKET, BY STRUCTURE 2022-2031 (USD MILLION)
TABLE 74 SINGAPORE CAR-T CELL THERAPY TREATMENT MARKET, BY TARGETED ANTIGENS, 2022-2031 (USD MILLION)
TABLE 75 SINGAPORE ANTIGENS ON HEMATOLOGIC MALIGNANCIES IN CAR-T CELL THERAPY TREATMENT MARKET, BY TARGETED ANTIGENS, 2022-2031 (USD MILLION)
TABLE 76 SINGAPORE CAR-T CELL THERAPY TREATMENT MARKET, BY BRAND, 2022-2031 (USD MILLION)
TABLE 77 SINGAPORE CAR-T CELL THERAPY TREATMENT MARKET, BY THERAPEUTIC APPLICATION, 2022-2031 (USD MILLION)
TABLE 78 SINGAPORE CAR-T CELL THERAPY TREATMENT MARKET, BY END USER, 2022-2031 (USD MILLION)
TABLE 79 SINGAPORE CAR-T CELL THERAPY TREATMENT MARKET, BY DISTRIBUTION CHANNEL, 2022-2031 (USD MILLION)
TABLE 80 MALAYSIA CAR-T CELL THERAPY TREATMENT MARKET, BY PRODUCT, 2022-2031 (USD MILLION)
TABLE 81 MALAYSIA CAR-T CELL THERAPY TREATMENT MARKET, BY STRUCTURE 2022-2031 (USD MILLION)
TABLE 82 MALAYSIA CAR-T CELL THERAPY TREATMENT MARKET, BY TARGETED ANTIGENS, 2022-2031 (USD MILLION)
TABLE 83 MALAYSIA ANTIGENS ON HEMATOLOGIC MALIGNANCIES IN CAR-T CELL THERAPY TREATMENT MARKET, BY TARGETED ANTIGENS, 2022-2031 (USD MILLION)
TABLE 84 MALAYSIA CAR-T CELL THERAPY TREATMENT MARKET, BY BRAND, 2022-2031 (USD MILLION)
TABLE 85 MALAYSIA CAR-T CELL THERAPY TREATMENT MARKET, BY THERAPEUTIC APPLICATION, 2022-2031 (USD MILLION)
TABLE 86 MALAYSIA CAR-T CELL THERAPY TREATMENT MARKET, BY END USER, 2022-2031 (USD MILLION)
TABLE 87 MALAYSIA CAR-T CELL THERAPY TREATMENT MARKET, BY DISTRIBUTION CHANNEL, 2022-2031 (USD MILLION)
TABLE 88 THAILAND CAR-T CELL THERAPY TREATMENT MARKET, BY PRODUCT, 2022-2031 (USD MILLION)
TABLE 89 THAILAND CAR-T CELL THERAPY TREATMENT MARKET, BY STRUCTURE 2022-2031 (USD MILLION)
TABLE 90 THAILAND CAR-T CELL THERAPY TREATMENT MARKET, BY TARGETED ANTIGENS, 2022-2031 (USD MILLION)
TABLE 91 THAILAND ANTIGENS ON HEMATOLOGIC MALIGNANCIES IN CAR-T CELL THERAPY TREATMENT MARKET, BY TARGETED ANTIGENS, 2022-2031 (USD MILLION)
TABLE 92 THAILAND CAR-T CELL THERAPY TREATMENT MARKET, BY BRAND, 2022-2031 (USD MILLION)
TABLE 93 THAILAND CAR-T CELL THERAPY TREATMENT MARKET, BY THERAPEUTIC APPLICATION, 2022-2031 (USD MILLION)
TABLE 94 THAILAND CAR-T CELL THERAPY TREATMENT MARKET, BY END USER, 2022-2031 (USD MILLION)
TABLE 95 THAILAND CAR-T CELL THERAPY TREATMENT MARKET, BY DISTRIBUTION CHANNEL, 2022-2031 (USD MILLION)
TABLE 96 INDONESIA CAR-T CELL THERAPY TREATMENT MARKET, BY PRODUCT, 2022-2031 (USD MILLION)
TABLE 97 INDONESIA CAR-T CELL THERAPY TREATMENT MARKET, BY STRUCTURE 2022-2031 (USD MILLION)
TABLE 98 INDONESIA CAR-T CELL THERAPY TREATMENT MARKET, BY TARGETED ANTIGENS, 2022-2031 (USD MILLION)
TABLE 99 INDONESIA ANTIGENS ON HEMATOLOGIC MALIGNANCIES IN CAR-T CELL THERAPY TREATMENT MARKET, BY TARGETED ANTIGENS, 2022-2031 (USD MILLION)
TABLE 100 INDONESIA CAR-T CELL THERAPY TREATMENT MARKET, BY BRAND, 2022-2031 (USD MILLION)
TABLE 101 INDONESIA CAR-T CELL THERAPY TREATMENT MARKET, BY THERAPEUTIC APPLICATION, 2022-2031 (USD MILLION)
TABLE 102 INDONESIA CAR-T CELL THERAPY TREATMENT MARKET, BY END USER, 2022-2031 (USD MILLION)
TABLE 103 INDONESIA CAR-T CELL THERAPY TREATMENT MARKET, BY DISTRIBUTION CHANNEL, 2022-2031 (USD MILLION)
TABLE 104 PHILIPPINES CAR-T CELL THERAPY TREATMENT MARKET, BY PRODUCT, 2022-2031 (USD MILLION)
TABLE 105 PHILIPPINES CAR-T CELL THERAPY TREATMENT MARKET, BY STRUCTURE 2022-2031 (USD MILLION)
TABLE 106 PHILIPPINES CAR-T CELL THERAPY TREATMENT MARKET, BY TARGETED ANTIGENS, 2022-2031 (USD MILLION)
TABLE 107 PHILIPPINES ANTIGENS ON HEMATOLOGIC MALIGNANCIES IN CAR-T CELL THERAPY TREATMENT MARKET, BY TARGETED ANTIGENS, 2022-2031 (USD MILLION)
TABLE 108 PHILIPPINES CAR-T CELL THERAPY TREATMENT MARKET, BY BRAND, 2022-2031 (USD MILLION)
TABLE 109 PHILIPPINES CAR-T CELL THERAPY TREATMENT MARKET, BY THERAPEUTIC APPLICATION, 2022-2031 (USD MILLION)
TABLE 110 PHILIPPINES CAR-T CELL THERAPY TREATMENT MARKET, BY END USER, 2022-2031 (USD MILLION)
TABLE 111 PHILIPPINES CAR-T CELL THERAPY TREATMENT MARKET, BY DISTRIBUTION CHANNEL, 2022-2031 (USD MILLION)
TABLE 112 VIETNAM CAR-T CELL THERAPY TREATMENT MARKET, BY PRODUCT, 2022-2031 (USD MILLION)
TABLE 113 VIETNAM CAR-T CELL THERAPY TREATMENT MARKET, BY STRUCTURE 2022-2031 (USD MILLION)
TABLE 114 VIETNAM CAR-T CELL THERAPY TREATMENT MARKET, BY TARGETED ANTIGENS, 2022-2031 (USD MILLION)
TABLE 115 VIETNAM ANTIGENS ON HEMATOLOGIC MALIGNANCIES IN CAR-T CELL THERAPY TREATMENT MARKET, BY TARGETED ANTIGENS, 2022-2031 (USD MILLION)
TABLE 116 VIETNAM CAR-T CELL THERAPY TREATMENT MARKET, BY BRAND, 2022-2031 (USD MILLION)
TABLE 117 VIETNAM CAR-T CELL THERAPY TREATMENT MARKET, BY THERAPEUTIC APPLICATION, 2022-2031 (USD MILLION)
TABLE 118 VIETNAM CAR-T CELL THERAPY TREATMENT MARKET, BY END USER, 2022-2031 (USD MILLION)
TABLE 119 VIETNAM CAR-T CELL THERAPY TREATMENT MARKET, BY DISTRIBUTION CHANNEL, 2022-2031 (USD MILLION)
List of Figure
FIGURE 1 MEA, SAUDI ARABIA AND SEA CAR-T CELL THERAPY TREATMENT MARKET: SEGMENTATION
FIGURE 2 MEA, SAUDI ARABIA AND SEA CAR-T CELL THERAPY TREATMENT MARKET: DATA TRIANGULATION
FIGURE 3 MEA, SAUDI ARABIA AND SEA CAR-T CELL THERAPY TREATMENT MARKET: DROC ANALYSIS
FIGURE 4 MEA, SAUDI ARABIA AND SEA CAR-T CELL THERAPY TREATMENT MARKET: REGIONAL VS COUNTRY MARKET ANALYSIS
FIGURE 5 MEA, SAUDI ARABIA AND SEA CAR-T CELL THERAPY TREATMENT MARKET: COMPANY RESEARCH ANALYSIS
FIGURE 6 MEA, SAUDI ARABIA AND SEA CAR-T CELL THERAPY TREATMENT MARKET: INTERVIEW DEMOGRAPHICS
FIGURE 7 MEA, SAUDI ARABIA AND SEA CAR-T CELL THERAPY TREATMENT MARKET: MULTIVARIATE MODELLING
FIGURE 8 MEA, SAUDI ARABIA AND SEA CAR-T CELL THERAPY TREATMENT MARKET: MARKET APPLICATION COVERAGE GRID
FIGURE 9 MEA, SAUDI ARABIA AND SEA CAR-T CELL THERAPY TREATMENT MARKET: DBMR MARKET POSITION GRID
FIGURE 10 MEA, SAUDI ARABIA AND SEA CAR-T CELL THERAPY TREATMENT MARKET: VENDOR SHARE ANALYSIS
FIGURE 11 MEA, SAUDI ARABIA AND SEA CAR-T CELL THERAPY TREATMENT MARKET: SEGMENTATION
FIGURE 12 INCREASING INVESTMENT IN RESEARCH AND DEVELOPMENT IS EXPECTED TO DRIVE THE MEA, SAUDI ARABIA AND SEA CAR-T CELL THERAPY TREATMENT MARKET IN THE FORECAST PERIOD OF 2024 TO 2031
FIGURE 13 DRIVERS, RESTRAINTS, OPPORTUNITIES, AND CHALLENGES OF THE GLOBAL DIALYSIS MACHINES AND CONSUMABLES MARKET
FIGURE 14 SEA CAR-T CELL THERAPY TREATMENTMARKET: BY PRODUCT, 2031
FIGURE 15 SEA CAR-T CELL THERAPY TREATMENTMARKET: BY PRODUCT, CAGR (2024-2031)
FIGURE 16 SEA CAR-T CELL THERAPY TREATMENTMARKET: BY PRODUCT, LIFELINE CURVE
FIGURE 17 MEA CAR-T CELL THERAPY TREATMENTMARKET: BY PRODUCT, 2031
FIGURE 18 MEA CAR-T CELL THERAPY TREATMENTMARKET: BY PRODUCT, CAGR (2027-2031)
FIGURE 19 MEA CAR-T CELL THERAPY TREATMENTMARKET: BY PRODUCT, LIFELINE CURVE
FIGURE 20 SEA CAR-T CELL THERAPY TREATMENTMARKET: BY STRUCTURE, 2031
FIGURE 21 SEA CAR-T CELL THERAPY TREATMENTMARKET: BY STRUCTURE, CAGR (2024-2031)
FIGURE 22 SEA CAR-T CELL THERAPY TREATMENTMARKET: BY STRUCTURE, LIFELINE CURVE
FIGURE 23 MEA CAR-T CELL THERAPY TREATMENTMARKET: BY STRUCTURE, 2031
FIGURE 24 MEA CAR-T CELL THERAPY TREATMENTMARKET: BY STRUCTURE, CAGR (2027-2031)
FIGURE 25 MEA CAR-T CELL THERAPY TREATMENTMARKET: BY STRUCTURE, LIFELINE CURVE
FIGURE 26 SEA CAR-T CELL THERAPY TREATMENT MARKET: BY TARGET ANTIGEN, 2031
FIGURE 27 SEA CAR-T CELL THERAPY TREATMENT MARKET: BY TARGET ANTIGEN, CAGR (2024-2031)
FIGURE 28 SEA CAR-T CELL THERAPY TREATMENT MARKET: BY TARGET ANTIGEN, LIFELINE CURVE
FIGURE 29 MEA CAR-T CELL THERAPY TREATMENT MARKET: BY TARGET ANTIGEN, 2031
FIGURE 30 MEA CAR-T CELL THERAPY TREATMENTMARKET: BY TARGET ANTIGEN, CAGR (2027-2031)
FIGURE 31 MEA CAR-T CELL THERAPY TREATMENTMARKET: BY TARGET ANTIGEN, LIFELINE CURVE
FIGURE 32 SEA CAR-T CELL THERAPY TREATMENT MARKET: BY BRAND, 2031
FIGURE 33 SEA CAR-T CELL THERAPY TREATMENT MARKET: BY BRAND, CAGR (2024-2031)
FIGURE 34 SEA CAR-T CELL THERAPY TREATMENT MARKET: BY BRAND, LIFELINE CURVE
FIGURE 35 MEA CAR-T CELL THERAPY TREATMENT MARKET: BY BRAND, 2031
FIGURE 36 MEA CAR-T CELL THERAPY TREATMENTMARKET: BY BRAND, CAGR (2027-2031)
FIGURE 37 MEA CAR-T CELL THERAPY TREATMENTMARKET: BY BRAND, LIFELINE CURVE
FIGURE 38 SEA CAR-T CELL THERAPY TREATMENT MARKET: BY THERAPEUTICS APPLICATION, 2031
FIGURE 39 SEA CAR-T CELL THERAPY TREATMENT MARKET: BY THERAPEUTICS APPLICATION, CAGR (2024-2031)
FIGURE 40 SEA CAR-T CELL THERAPY TREATMENT MARKET: BY THERAPEUTICS APPLICATION, LIFELINE CURVE
FIGURE 41 MEA CAR-T CELL THERAPY TREATMENT MARKET: BY THERAPEUTICS APPLICATION, 2031
FIGURE 42 MEA CAR-T CELL THERAPY TREATMENTMARKET: BY THERAPEUTICS APPLICATION, CAGR (2027-2031)
FIGURE 43 MEA CAR-T CELL THERAPY TREATMENTMARKET: BY THERAPEUTICS APPLICATION, LIFELINE CURVE
FIGURE 44 SEA CAR-T CELL THERAPY TREATMENTMARKET: BY END USER, 2031
FIGURE 45 SEA CAR-T CELL THERAPY TREATMENTMARKET: BY END USER, CAGR (2024-2031)
FIGURE 46 SEA CAR-T CELL THERAPY TREATMENTMARKET: BY END USER, LIFELINE CURVE
FIGURE 47 MEA CAR-T CELL THERAPY TREATMENTMARKET: BY END USER, 2031
FIGURE 48 MEA CAR-T CELL THERAPY TREATMENTMARKET: BY END USER, CAGR (2027-2031)
FIGURE 49 MEA CAR-T CELL THERAPY TREATMENTMARKET: BY END USER, LIFELINE CURVE
FIGURE 50 SEA CAR-T CELL THERAPY TREATMENT MARKET: BY DISTRIBUTION CHANNEL, 2031
FIGURE 51 SEA CAR-T CELL THERAPY TREATMENT MARKET: BY DISTRIBUTION CHANNEL, CAGR (2024-2031)
FIGURE 52 SEA CAR-T CELL THERAPY TREATMENT MARKET: BY DISTRIBUTION CHANNEL, LIFELINE CURVE
FIGURE 53 MEA CAR-T CELL THERAPY TREATMENT MARKET: BY DISTRIBUTION CHANNEL, 2031
FIGURE 54 MEA CAR-T CELL THERAPY TREATMENT MARKET: BY DISTRIBUTION CHANNEL, CAGR (2027-2031)
FIGURE 55 MEA CAR-T CELL THERAPY TREATMENT MARKET: BY DISTRIBUTION CHANNEL, LIFELINE CURVE
FIGURE 56 MEA, CAR-T CELL THERAPY MARKET: SNAPSHOT (2023)
FIGURE 57 SEA, CAR-T CELL THERAPY MARKET: SNAPSHOT (2023)
FIGURE 58 MEA CAR-T CELL THERAPY MARKET: COMPANY SHARE 2023 (%)
FIGURE 59 SEA CAR-T CELL THERAPY MARKET: COMPANY SHARE 2023 (%)
Data collection and base year analysis are done using data collection modules with large sample sizes. The stage includes obtaining market information or related data through various sources and strategies. It includes examining and planning all the data acquired from the past in advance. It likewise envelops the examination of information inconsistencies seen across different information sources. The market data is analysed and estimated using market statistical and coherent models. Also, market share analysis and key trend analysis are the major success factors in the market report. To know more, please request an analyst call or drop down your inquiry.
The key research methodology used by DBMR research team is data triangulation which involves data mining, analysis of the impact of data variables on the market and primary (industry expert) validation. Data models include Vendor Positioning Grid, Market Time Line Analysis, Market Overview and Guide, Company Positioning Grid, Patent Analysis, Pricing Analysis, Company Market Share Analysis, Standards of Measurement, Global versus Regional and Vendor Share Analysis. To know more about the research methodology, drop in an inquiry to speak to our industry experts.
Data Bridge Market Research is a leader in advanced formative research. We take pride in servicing our existing and new customers with data and analysis that match and suits their goal. The report can be customized to include price trend analysis of target brands understanding the market for additional countries (ask for the list of countries), clinical trial results data, literature review, refurbished market and product base analysis. Market analysis of target competitors can be analyzed from technology-based analysis to market portfolio strategies. We can add as many competitors that you require data about in the format and data style you are looking for. Our team of analysts can also provide you data in crude raw excel files pivot tables (Fact book) or can assist you in creating presentations from the data sets available in the report.


