Middle East And Africa Mea Radiotherapy Market
Market Size in USD Million
CAGR :
%
USD
362.38 Million
USD
655.69 Million
2024
2032
| 2025 –2032 | |
| USD 362.38 Million | |
| USD 655.69 Million | |
|
|
|
|
Middle East and Africa Radiotherapy Market Segmentation, By Product And Services (Services, Product, And Software), Type (External-Beam Radiation Therapy, Internal Radiation Therapy, Systemic Radiotherapy/ Radiopharmaceuticals, And Others), Application (Breast Cancer, Lung Cancer, Prostate Cancer, Colorectal Cancer, Lymphoma, Liver Cancer, Thyroid Cancer, Brain Cancer, Cervical Cancer, Spine Cancer, Others), End User (Hospitals, Radiation Therapy Centers, Specialty Clinics, And Others), Distribution Channel (Direct Tenders, Third Party Distributors, and Others) - Trends and Forecast to 2032
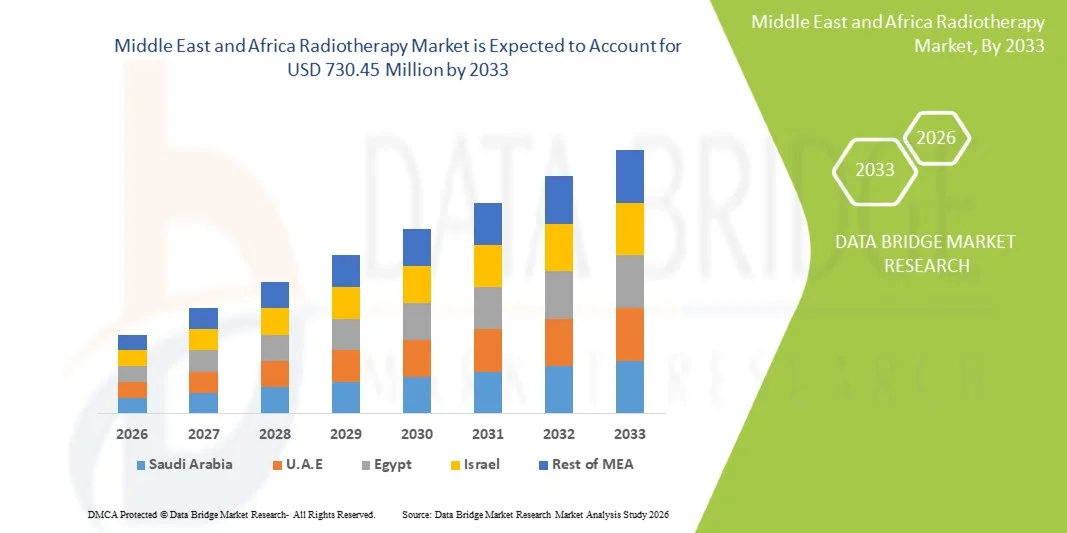
Middle East and Africa Radiotherapy Market Size
- The Middle East and Africa radiotherapy market size was valued at USD 362.38 million in 2024 and is expected to reach USD 655.69 million by 2032, at a CAGR of 8.1% during the forecast period
- The market growth is growing prevalence of cancer disease, novel technology in radiotherapy for cancer treatment and increasing adoption of radiotherapy devices and procedures
- Furthermore, the market is expected to increasing healthcare expenditure for cancer treatment, growing government initiatives toward cancer treatment and rising patients’ awareness towards cancer treatment
Middle East and Africa Radiotherapy Market Analysis
- The Middle East and Africa rise in cancer prevalence, increasing adoption of advanced radiotherapy techniques such as intensity-modulated radiotherapy (IMRT), stereotactic body radiotherapy (SBRT), and proton therapy, along with technological advancements in imaging and treatment planning systems, are key driving factors expected to propel the growth of the Middle East and Africa radiotherapy market
- Key factors such as rising demand for non-invasive and targeted cancer treatment solutions, growing investments in oncology-focused R&D, continuous innovation in radiotherapy equipment, and supportive government policies and funding for cancer care infrastructure are driving the growth of the Middle East and Africa radiotherapy market
- South Africa dominated Middle East and Africa radiotherapy market with the market share of 27.97% in 2024 and is expected to grow with the fastest CAGR of 9.7% in the forecast period of 2025 to 2032 due to growing prevalence of cancer disease, novel technology in radiotherapy for cancer treatment and increasing adoption of radiotherapy devices and procedures
- The external beam radiotherapy segment dominated the market with a 63.45% market share in 2024, growing with the CAGR of 8.4% in the forecast period of 2025 to 2032. driven growing prevalence of cancer disease, novel technology in radiotherapy for cancer treatment and increasing adoption of radiotherapy devices and procedures
Report Scope and Middle East and Africa Radiotherapy Market Segmentation
|
Attributes |
Middle East and Africa Radiotherapy Key Market Insights |
|
Segments Covered |
|
|
Countries Covered |
Middle East and Africa
|
|
Key Market Players |
|
|
Market Opportunities |
|
|
Value Added Data Infosets |
In addition to the insights on market scenarios such as market value, growth rate, segmentation, geographical coverage, and major players, the market reports curated by the Data Bridge Market Research also include depth expert analysis, patient epidemiology, pipeline analysis, pricing analysis, and regulatory framework. |
Middle East and Africa Radiotherapy Market Trends
“Rising Demand for Advanced, Non-Invasive, And Precision-Based Cancer Treatment Solutions Across Healthcare Systems”
- Demand for advanced, non-invasive, and precision-based cancer treatment solutions is growing rapidly—driven by increasing cancer prevalence, rising patient awareness, and a shift toward personalized medicine across healthcare systems. Radiotherapy technologies address these demands by offering targeted, effective treatment options that minimize side effects and improve patient outcomes
- As healthcare providers aim to reduce treatment-related complications and enhance quality of care, there is a growing shift toward integrating advanced radiotherapy techniques such as image-guided radiotherapy (IGRT), intensity-modulated radiotherapy (IMRT), and proton therapy. This transition is crucial for meeting stringent regulatory standards, improving treatment efficacy, and supporting the Middle East and Africa move toward value-based care
- Major industry players such as Siemens Healthineers, Elekta, Varian (a Siemens company), and Accuray are significantly increasing their R&D efforts to develop cutting-edge radiotherapy equipment and software that offer higher precision, automation, and integration with artificial intelligence, further driving innovation and market growth
- Advancements in imaging, treatment planning, and delivery technologies—such as adaptive radiotherapy, stereotactic radiosurgery (SRS), and proton beam therapy—are enhancing treatment accuracy, patient safety, and operational efficiency. These innovations are enabling broader adoption across hospitals and specialty centers and supporting the expansion of the Middle East and Africa radiotherapy market
Middle East and Africa Radiotherapy Market Dynamics
“Growing Prevalence of Cancer Disease”
- The rising Middle East and Africa demand for advanced, precise, and patient-friendly cancer treatment solutions—driven by increasing cancer prevalence, growing patient awareness, and the shift toward personalized, less invasive therapies—is putting pressure on healthcare providers and manufacturers to innovate and upgrade radiotherapy technologies across hospitals, specialty clinics, and cancer centers. To meet this demand, companies are accelerating investments in next-generation radiotherapy equipment, software, and treatment planning systems to deliver higher accuracy, improved patient outcomes, and streamlined workflows at scale. These advancements are building smarter, more efficient oncology care ecosystems, much like how precision medicine is reshaping healthcare delivery
- For instance, in early 2025, researchers from leading oncology institutes highlighted the growing prominence of proton therapy and adaptive radiotherapy as transformative approaches in cancer treatment. Their studies emphasize the benefits of these cutting-edge technologies in minimizing radiation exposure to healthy tissues while enhancing tumor targeting, significantly improving patient quality of life. The report highlights the increasing importance of integrating advanced imaging and AI-driven treatment planning as vital components in the evolving landscape of cancer care, playing a critical role in enhancing radiotherapy efficacy as a personalized and integrative approach
- These investments are not only transforming radiotherapy capabilities but also enabling broader adoption of sophisticated treatment modalities across emerging markets and high-growth segments like pediatric oncology and rare cancers. Leading players such as Siemens, Elekta, Varian (Siemens), and Accuracy are investing heavily in innovative radiotherapy systems, AI-powered software, and patient-centric solutions to maintain competitive advantage and improve treatment performance across applications
- In addition, the ongoing commitment from governments, research institutions, and private industry toward improving cancer care infrastructure and advancing radiotherapy innovation is playing a pivotal role in shaping a more effective Middle East and Africa oncology market. These initiatives are establishing advanced radiotherapy as a cornerstone of modern cancer treatment and a major growth driver in the transition toward safer, more precise, and patient-aligned therapies
Restraint/Challenge
“Lack of Skilled and Certified Professionals”
- The shortage of skilled and certified radiotherapy professionals remains one of the most significant restraints limiting the growth and broader adoption of advanced radiotherapy technologies worldwide. Radiotherapy treatment requires highly trained oncologists, medical physicists, dosimetrists, and radiation therapists to ensure precise treatment planning, safe delivery, and effective patient management—skills that are in short supply, especially in developing regions
- Furthermore, the complexity of modern radiotherapy techniques—such as intensity-modulated radiotherapy (IMRT), stereotactic radiosurgery (SRS), and proton therapy—demands continuous professional training and certification to keep pace with technological advancements. The lack of standardized training programs and accreditation frameworks across many countries exacerbates the issue, often leading to suboptimal treatment outcomes and limiting the ability to fully leverage sophisticated radiotherapy equipment
- For instance, in March 2025, a study by the International Atomic Energy Agency (IAEA) highlighted that many low- and middle-income countries face critical shortages of trained radiotherapy staff, which significantly delays the implementation of new treatment technologies and restricts patient access to quality care. The report emphasized the urgent need for international collaboration to develop scalable training programs and certification pathways tailored to resource-limited settings
- Similarly, a 2024 survey conducted by the American Society for Radiation Oncology (ASTRO) revealed that despite growing investments in advanced radiotherapy systems across the United States, many centers struggle to recruit and retain qualified medical physicists and dosimetrists, directly impacting treatment efficiency and patient throughput
- The shortage of skilled professionals coupled with the increasing complexity of radiotherapy techniques continues to act as a barrier to the widespread adoption and optimal utilization of radiotherapy services. While ongoing efforts in education, certification, and remote training are underway, addressing these workforce challenges remains critical to unlocking the full potential of the Middle East and Africa radiotherapy market
Middle East and Africa Radiotherapy Market Scope
The market is segmented on the basis of product, application type, procedure type, usability, end user, and distribution channel.
• By Product and Services
On the basis of Product and Services, the Middle East and Africa radiotherapy market is segmented into services, products and software. In 2025, the services segment is expected to dominate the market with a market share of 57.20% growing with the highest CAGR of 8.4% in the forecast period of 2025 to 2032, driven by growing prevalence of cancer disease, novel technology in radiotherapy for cancer treatment and increasing adoption of radiotherapy devices and procedures.
- By Type
On the basis Type, the Middle East and Africa radiotherapy market is segmented into external-beam radiation therapy, internal radiation therapy, systemic radiotherapy/radiopharmaceuticals, others. In 2025, the external-beam radiation therapy segment is expected to dominate the market with a market share of 66.07% growing with the highest CAGR of 8.3% in the forecast period of 2025 to 2032, driven by expected to increasing healthcare expenditure for cancer treatment, growing government initiatives toward cancer treatment and rising patients’ awareness towards cancer treatment.
- By Application
On the basis of Application, the Middle East and Africa radiotherapy market is segmented into breast cancer, lung cancer, prostate cancer, colorectal cancer, lymphoma, liver cancer, thyroid cancer, brain cancer, cervical cancer, spine cancer and others. In 2025, the breast cancer segment is expected to dominate the market with a market share of 24.19% growing with the highest CAGR of 9.2% in the forecast period of 2025 to 2032 driven by growing prevalence of cancer disease, novel technology in radiotherapy for cancer treatment and increasing adoption of radiotherapy devices and procedures.
- By End User
On the basis of end user, the Middle East and Africa radiotherapy market is segmented into hospitals, radiation therapy centers, specialty clinics, academic & research institutes, others. In 2024, the Hospitals segment dominated the market with a 64.57% market share and growing with the CAGR of 8.5% in the forecast period of 2025 to 2032 driven expected to increasing healthcare expenditure for cancer treatment, growing government initiatives toward cancer treatment and rising patients awareness towards cancer treatment
- By Distribution Channel
On the basis of Distribution Channel, the Middle East and Africa radiotherapy market is segmented into direct tenders, third-party distributors and others. In 2024, the direct tenders segment dominated the market with a 82.16% market share and growing with the CAGR of 8.2% in the forecast period of 2025 to 2032 driven by growing prevalence of cancer disease, novel technology in radiotherapy for cancer treatment and increasing adoption of radiotherapy devices and procedures.
Middle East and Africa Radiotherapy Market Regional Analysis
- South Africa in Middle East and Africa radiotherapy market is expected to reach USD 208.26 thousand by 2032, from USD 101.36 Thousand in 2024, growing at the CAGR of 9.7% in the forecast period of 2025 to 2032
- South Africa allocates a significant portion of its GDP to healthcare, ensuring substantial funding for cutting-edge cancer treatment technologies, including advanced radiotherapy procedures. In contrast, emerging markets are increasing their healthcare spending due to growing cancer prevalence and rising awareness of modern treatment options. The availability of funding from both public and private sectors plays a crucial role in expanding access to radiotherapy services.
- In South America, radiotherapy is widely available and integrated into standard oncology care. In contrast, emerging markets with developing healthcare infrastructure are experiencing rapid growth in access to radiotherapy services, driven by expanding hospital networks and increasing healthcare budgets. As healthcare systems become more centralized or privatized, increased investments in advanced radiotherapy equipment and software promote market growth and improve treatment accessibility.
Saudi Arabia Radiotherapy Market Insight
The Saudi Arabia radiotherapy market is expected to register the CAGR of 8.3% from 2025 to 2032, driven by expected to increasing healthcare expenditure for cancer treatment, growing government initiatives toward cancer treatment and rising patients’ awareness towards cancer treatment.
U.A.E Radiotherapy Market Insight
The U.A.E radiotherapy market is expected to register the CAGR of 7.9% from 2025 to 2032, driven by expected to increasing healthcare expenditure for cancer treatment, growing government initiatives toward cancer treatment and rising patients’ awareness towards cancer treatment.
Middle East and Africa Radiotherapy Market Share
The Middle East and Africa radiotherapy market is primarily led by well-established companies, including:
- Siemens Healthcare GmbH (Germany)
- Hitachi, Ltd. (Japan)
- General Electric Company (U.S.)
- Koninklijke Philips N.V. (Netherlands)
- Elekta (Sweden)
- ZEISS International (Germany)
- IBA Worldwide (Belgium)
- Canon Medical Systems Corporation (Japan)
- Accuray Incorporated (U.S.)
- Brainlab (Germany)
- United Imaging Healthcare Co., Ltd. (China)
- Eckert & Ziegler BEBIG (Germany)
- ViewRay Systems, Inc. (U.S.)
- P-Cure (Israel)
Latest Developments in Middle East and Africa Radiotherapy Market
- In May 2024, Siemens Healthineers and Varian unveiled new advancements in radiation oncology at ESTRO 2024, including HyperSight imaging, ARIA CORE oncology management, and more accessible MRI for radiotherapy
- In September 2024, Ballad Health has entered a 10-year, USD 260 million collaboration with Varian, a Siemens Healthineers company, to transform cancer care in the Appalachian Highlands. This partnership will bring advanced oncology technology, including linear accelerators and digital management solutions, to six cancer centers, enhancing treatment precision and accessibility for rural communities
- In 2023, Hitachi expanded its Digital Systems & Services (DSS) segment through cloud, AI, and IoT solutions. This included further development of its Lumada platform and integration of South AmericaLogic, an IT service company
- In May 2025, GE HealthCare is significantly expanding its radiation oncology portfolio at ESTRO 2025 with new AI-enabled solutions, including the MR Contour DL for efficient organ segmentation. They are also enhancing their Intelligent Radiation Therapy (iRT) software to integrate MR and AI-driven workflows, aiming for more precise and timely cancer treatment
- In April 2024, GE HealthCare has finalized its acquisition of MIM Software, a Middle East and Africa provider of medical imaging analysis and AI solutions. This strategic move bolsters GE HealthCare's portfolio, particularly in radiation oncology, by integrating MIM Software's advanced tools for image analysis, workflow automation, and AI-powered segmentation and contouring into its precision care strategy
SKU-
Get online access to the report on the World's First Market Intelligence Cloud
- Interactive Data Analysis Dashboard
- Company Analysis Dashboard for high growth potential opportunities
- Research Analyst Access for customization & queries
- Competitor Analysis with Interactive dashboard
- Latest News, Updates & Trend analysis
- Harness the Power of Benchmark Analysis for Comprehensive Competitor Tracking
Table of Content
1 INTRODUCTION
1.1 OBJECTIVES OF THE STUDY
1.2 MARKET DEFINITION
1.3 OVERVIEW OF THE MIDDLE EAST AND AFRICA RADIOTHERAPY MARKET
1.4 CURRENCY AND PRICING
1.5 LIMITATIONS
1.6 MARKETS COVERED
2 MARKET SEGMENTATION
2.1 MARKETS COVERED
2.2 GEOGRAPHICAL SCOPE
2.3 YEARS CONSIDERED FOR THE STUDY
2.4 DBMR TRIPOD DATA VALIDATION MODEL
2.5 PRIMARY INTERVIEWS WITH KEY OPINION LEADERS
2.6 MULTIVARIATE MODELLING
2.7 PRODUCT & SERVICES SEGMENT LIFELINE CURVE
2.8 MARKET END USER COVERAGE GRID
2.9 DBMR MARKET POSITION GRID
2.1 VENDOR SHARE ANALYSIS
2.11 SECONDARY SOURCES
2.12 ASSUMPTIONS
3 EXECUTIVE SUMMARY
4 PREMIUM INSIGHTS
4.1 PESTLE ANALYSIS
4.2 PORTER'S FIVE FORCES MODEL
4.3 PRICING ANALYSIS
5 REGULATORY GUIDELINES FOR RADIOTHERAPY
5.1 U.S REGULATORY GUIDELINES FOR RADIOTHERAPY
5.2 EUROPE REGULATORY GUIDELINE FOR RADIOTHERAPY
5.3 INDIA REGULATORY GUIDELINE FOR RADIOTHERAPY
5.4 CLEARANCE OF THE UNIT BY AERB (TYPE APPROVED OR NOC-ISSUED EQUIPMENT)
5.5 CHINA REGULATORY GUIDELINE FOR RADIOTHERAPY
5.6 ELEMENTS OF RADIATION PROTECTION PROGRAM -
6 MARKET OVERVIEW
6.1 DRIVERS
6.1.1 GROWING PREVALENCE OF CANCER DISEASE
6.1.2 NOVEL TECHNOLOGY IN RADIOTHERAPY FOR CANCER TREATMENT
6.1.3 INCREASING ADOPTION OF RADIOTHERAPY DEVICES AND PROCEDURES
6.1.4 RISING PREFERENCE FOR NON-SURGICAL PROCEDURES
6.2 RESTRAINTS
6.2.1 LACK OF SKILLED AND CERTIFIED PROFESSIONALS
6.2.2 HIGH COST OF TREATMENT AND RADIOTHERAPY PROCEDURE
6.3 OPPORTUNITIES
6.3.1 INCREASING HEALTHCARE EXPENDITURE FOR CANCER TREATMENT
6.3.2 GROWING GOVERNMENT INITIATIVES TOWARD CANCER TREATMENT
6.3.3 RISING PATIENTS AWARENESS TOWARDS CANCER TREATMENT
6.4 CHALLENGES
6.4.1 STRICT REGULATIONS AND STANDARDS FOR APPROVAL AND COMMERCIALIZATION OF RADIOTHERAPY PRODUCTS
6.4.2 RISK OF RADIATION EXPOSURE
7 MIDDLE EAST AND AFRICA RADIOTHERAPY MARKET, BY PRODUCT & SERVICES
7.1 OVERVIEW
7.2 SERVICES
7.3 PRODUCT
7.4 SOFTWARE
8 MIDDLE EAST AND AFRICA RADIOTHERAPY MARKET, BY TYPE
8.1 OVERVIEW
8.2 EXTERNAL-BEAM RADIATION THERAPY
8.3 INTERNAL RADIATION THERAPY
8.4 SYSTEMIC RADIOTHERAPY/ RADIOPHARMACEUTICALS
8.5 OTHERS
9 MIDDLE EAST AND AFRICA RADIOTHERAPY MARKET, BY APPLICATION
9.1 OVERVIEW
9.2 BREAST CANCER
9.3 LUNG CANCER
9.4 PROSTATE CANCER
9.5 COLORECTAL CANCER
9.6 LYMPHOMA
9.7 LIVER CANCER
9.8 THYROID CANCER
9.9 BRAIN CANCER
9.1 CERVICAL CANCER
9.11 SPINE CANCER
9.12 OTHERS
10 MIDDLE EAST AND AFRICA RADIOTHERAPY MARKET, BY END USER
10.1 OVERVIEW
10.2 HOSPITALS
10.3 RADIATION THERAPY CENTERS
10.4 SPECIALTY CLINICS
10.5 OTHERS
11 MIDDLE EAST AND AFRICA RADIOTHERAPY MARKET, BY DISTRIBUTION CHANNEL
11.1 OVERVIEW
11.2 DIRECT TENDERS
11.3 THIRD PARTY DISTRIBUTORS
11.4 OTHERS
12 MIDDLE EAST AND AFRICA RADIOTHERAPY MARKET, BY REGION
12.1 MIDDLE EAST AND AFRICA
12.1.1 SOUTH AFRICA
12.1.2 SAUDI ARABIA
12.1.3 U.A.E.
12.1.4 EGYPT
12.1.5 BAHRAIN
12.1.6 KUWAIT
12.1.7 QATAR
12.1.8 OMAN
12.1.9 MOROCCO
12.1.10 REST OF MIDDLE EAST AND AFRICA
13 MIDDLE EAST AND AFRICA RADIOTHERAPY MARKET: COMPANY LANDSCAPE
13.1 COMPANY SHARE ANALYSIS: MIDDLE EAST AND AFRICA
14 SWOT ANALYSIS
15 MIDDLE EAST AND AFRICA RADIOTHERAPY MARKET, COMPANY PROFILE
15.1 SIEMENS HEALTHCARE GMBH
15.1.1 COMPANY SNAPSHOT
15.1.2 REVENUE ANALYSIS
15.1.3 COMPANY SHARE ANALYSIS
15.1.4 PRODUCT PORTFOLIO
15.1.5 RECENT DEVELOPMENTS
15.2 HITACHI, LTD.
15.2.1 COMPANY SNAPSHOT
15.2.2 REVENUE ANALYSIS
15.2.3 COMPANY SHARE ANALYSIS
15.2.4 PRODUCT PORTFOLIO
15.2.5 RECENT DEVELOPMENTS
15.3 GENERAL ELECTRIC COMPANY
15.3.1 COMPANY SNAPSHOT
15.3.2 REVENUE ANALYSIS
15.3.3 COMPANY SHARE ANALYSIS
15.3.4 PRODUCT PORTFOLIO
15.3.5 RECENT DEVELOPMENTS
15.4 KONINKLIJKE PHILIPS N.V.
15.4.1 COMPANY SNAPSHOT
15.4.2 REVENUE ANALYSIS
15.4.3 COMPANY SHARE ANALYSIS
15.4.4 PRODUCT PORTFOLIO
15.4.5 RECENT DEVELOPMENTS
15.5 ELEKTA
15.5.1 COMPANY SNAPSHOT
15.5.2 REVENUE ANALYSIS
15.5.3 COMPANY SHARE ANALYSIS
15.5.4 PRODUCT PORTFOLIO
15.5.5 RECENT DEVELOPMENTS
15.6 ACCURACY INCORPORATED
15.6.1 COMPANY SNAPSHOT
15.6.2 REVENUE ANALYSIS
15.6.3 PRODUCT PORTFOLIO
15.6.4 RECENT DEVELOPMENTS
15.7 BEBIG MEDICAL.
15.7.1 COMPANY SNAPSHOT
15.7.2 PRODUCT PORTFOLIO
15.7.3 RECENT DEVELOPMENTS
15.8 BRAINLAB
15.8.1 COMPANY SNAPSHOT
15.8.2 PRODUCT PORTFOLIO
15.8.3 RECENT DEVELOPMENTS
15.9 CANON MEDICAL SYSTEMS CORPORATION
15.9.1 COMPANY SNAPSHOT
15.9.2 REVENUE ANALYSIS
15.9.3 PRODUCT PORTFOLIO
15.9.4 RECENT DEVELOPMENTS
15.1 ECKERT & ZIEGLER BEBIG
15.10.1 COMPANY SNAPSHOT
15.10.2 REVENUE ANALYSIS
15.10.3 PRODUCT PORTFOLIO
15.10.4 RECENT DEVELOPMENTS
15.11 IBA WORLDWIDE
15.11.1 COMPANY SNAPSHOT
15.11.2 REVENUE ANALYSIS
15.11.3 PRODUCT PORTFOLIO
15.11.4 RECENT DEVELOPMENTS
15.12 LINATECH INC
15.12.1 COMPANY SNAPSHOT
15.12.2 PRODUCT PORTFOLIO
15.12.3 RECENT DEVELOPMENT
15.13 MEVION MEDICAL SYSTEMS
15.13.1 COMPANY SNAPSHOT
15.13.2 PRODUCT PORTFOLIO
15.13.3 RECENT DEVELOPMENTS
15.14 NORDION (CANADA) INC. (A SUBSIDIARY OF SOTERA HEALTH)
15.14.1 COMPANY SNAPSHOT
15.14.2 PRODUCT PORTFOLIO
15.14.3 RECENT DEVELOPMENTS
15.15 P-CURE
15.15.1 COMPANY SNAPSHOT
15.15.2 PRODUCT PORTFOLIO
15.15.3 RECENT DEVELOPMENT
15.16 UNITED IMAGING HEALTHCARE CO., LTD
15.16.1 COMPANY SNAPSHOT
15.16.2 PRODUCT PORTFOLIO
15.16.3 RECENT DEVELOPMENT
15.17 VIEWRAY SYSTEMS, INC.
15.17.1 COMPANY SNAPSHOT
15.17.2 PRODUCT PORTFOLIO
15.17.3 RECENT DEVELOPMENT
15.18 ZEISS INTERNATIONAL
15.18.1 COMPANY SNAPSHOT
15.18.2 REVENUE ANALYSIS
15.18.3 COMPANY SHARE ANALYSIS
15.18.4 PRODUCT PORTFOLIO
15.18.5 RECENT DEVELOPMENTS
16 QUESTIONNAIRE
17 RELATED REPORTS
List of Table
TABLE 1 MIDDLE EAST AND AFRICA RADIOTHERAPY MARKET: AVERAGE SELLING PRICE OF EQUIPMENT, SOFTWARE AND SERVICES
TABLE 2 MIDDLE EAST AND AFRICA RADIOTHERAPY MARKET, BY PRODUCT & SERVICES, 2018-2032 (USD THOUSAND)
TABLE 3 MIDDLE EAST AND AFRICA SERVICES IN RADIOTHERAPY MARKET, BY REGION, 2018-2032 (USD THOUSAND)
TABLE 4 MIDDLE EAST AND AFRICA PRODUCT IN RADIOTHERAPY MARKET, BY REGION, 2018-2032 (USD THOUSAND)
TABLE 5 MIDDLE EAST AND AFRICA PRODUCT IN RADIOTHERAPY MARKET, BY PRODUCT & SERVICES, 2018-2032 (USD THOUSAND)
TABLE 6 MIDDLE EAST AND AFRICA EXTERNAL BEAM RADIOTHERAPY IN RADIOTHERAPY MARKET, BY PRODUCT & SERVICES, 2018-2032 (USD THOUSAND)
TABLE 7 MIDDLE EAST AND AFRICA PROTON THERAPY IN RADIOTHERAPY MARKET, BY PRODUCT & SERVICES, 2018-2032 (USD THOUSAND)
TABLE 8 MIDDLE EAST AND AFRICA INTERNAL RADIATION THERAPY IN RADIOTHERAPY MARKET, BY PRODUCT & SERVICES, 2018-2032 (USD THOUSAND)
TABLE 9 MIDDLE EAST AND AFRICA SYSTEMIC RADIOTHERAPY/RADIOPHARMACEUTICALS IN RADIOTHERAPY MARKET, BY PRODUCT & SERVICES, 2018-2032 (USD THOUSAND)
TABLE 10 MIDDLE EAST AND AFRICA SOFTWARE IN RADIOTHERAPY MARKET, BY REGION, 2018-2032 (USD THOUSAND)
TABLE 11 MIDDLE EAST AND AFRICA SOFTWARE IN RADIOTHERAPY MARKET, BY PRODUCT & SERVICES, 2018-2032 (USD THOUSAND)
TABLE 12 MIDDLE EAST AND AFRICA RADIOTHERAPY MARKET, BY TYPE, 2018-2032 (USD THOUSAND)
TABLE 13 MIDDLE EAST AND AFRICA EXTERNAL-BEAM RADIATION THERAPY IN RADIOTHERAPY MARKET, BY REGION, 2018-2032 (USD THOUSAND)
TABLE 14 MIDDLE EAST AND AFRICA EXTERNAL-BEAM RADIATION THERAPY IN RADIOTHERAPY MARKET, BY TYPE, 2018-2032 (USD THOUSAND)
TABLE 15 MIDDLE EAST AND AFRICA INTERNAL RADIATION THERAPY IN RADIOTHERAPY MARKET, BY REGION, 2018-2032 (USD THOUSAND)
TABLE 16 MIDDLE EAST AND AFRICA INTERNAL RADIATION THERAPY IN RADIOTHERAPY MARKET, BY TYPE, 2018-2032 (USD THOUSAND)
TABLE 17 MIDDLE EAST AND AFRICA SYSTEMIC RADIOTHERAPY/ RADIOPHARMACEUTICALS IN RADIOTHERAPY MARKET, BY REGION, 2018-2032 (USD THOUSAND)
TABLE 18 MIDDLE EAST AND AFRICA OTHERS IN RADIOTHERAPY MARKET, BY REGION, 2018-2032 (USD THOUSAND)
TABLE 19 MIDDLE EAST AND AFRICA RADIOTHERAPY MARKET, BY APPLICATION, 2018-2032 (USD THOUSAND)
TABLE 20 MIDDLE EAST AND AFRICA BREAST CANCER IN RADIOTHERAPY MARKET, BY REGION, 2018-2032 (USD THOUSAND)
TABLE 21 MIDDLE EAST AND AFRICA LUNG CANCER IN RADIOTHERAPY MARKET, BY REGION, 2018-2032 (USD THOUSAND)
TABLE 22 MIDDLE EAST AND AFRICA PROSTATE CANCER IN RADIOTHERAPY MARKET, BY REGION, 2018-2032 (USD THOUSAND)
TABLE 23 MIDDLE EAST AND AFRICA COLORECTAL CANCER IN RADIOTHERAPY MARKET, BY REGION, 2018-2032 (USD THOUSAND)
TABLE 24 MIDDLE EAST AND AFRICA LYMPHOMA IN RADIOTHERAPY MARKET, BY REGION, 2018-2032 (USD THOUSAND)
TABLE 25 MIDDLE EAST AND AFRICA LIVER CANCER IN RADIOTHERAPY MARKET, BY REGION, 2018-2032 (USD THOUSAND)
TABLE 26 MIDDLE EAST AND AFRICA THYROID CANCER IN RADIOTHERAPY MARKET, BY REGION, 2018-2032 (USD THOUSAND)
TABLE 27 MIDDLE EAST AND AFRICA BRAIN CANCER IN RADIOTHERAPY MARKET, BY REGION, 2018-2032 (USD THOUSAND)
TABLE 28 MIDDLE EAST AND AFRICA CERVICAL CANCER IN RADIOTHERAPY MARKET, BY REGION, 2018-2032 (USD THOUSAND)
TABLE 29 MIDDLE EAST AND AFRICA SPINE CANCER IN RADIOTHERAPY MARKET, BY REGION, 2018-2032 (USD THOUSAND)
TABLE 30 MIDDLE EAST AND AFRICA OTHERS IN RADIOTHERAPY MARKET, BY REGION, 2018-2032 (USD THOUSAND)
TABLE 31 MIDDLE EAST AND AFRICA RADIOTHERAPY MARKET, BY END USER, 2018-2032 (USD THOUSAND)
TABLE 32 MIDDLE EAST AND AFRICA HOSPITALS IN RADIOTHERAPY MARKET, BY REGION, 2018-2032 (USD THOUSAND)
TABLE 33 MIDDLE EAST AND AFRICA RADIATION THERAPY CENTERS IN RADIOTHERAPY MARKET, BY REGION, 2018-2032 (USD THOUSAND)
TABLE 34 MIDDLE EAST AND AFRICA SPECIALTY CLINICS IN RADIOTHERAPY MARKET, BY REGION, 2018-2032 (USD THOUSAND)
TABLE 35 MIDDLE EAST AND AFRICA OTHERS IN RADIOTHERAPY MARKET, BY REGION, 2018-2032 (USD THOUSAND)
TABLE 36 MIDDLE EAST AND AFRICA RADIOTHERAPY MARKET, BY DISTRIBUTION CHANNEL, 2018-2032 (USD THOUSAND)
TABLE 37 MIDDLE EAST AND AFRICA DIRECT TENDERS IN RADIOTHERAPY MARKET, BY REGION, 2018-2032 (USD THOUSAND)
TABLE 38 MIDDLE EAST AND AFRICA THIRD PARTY DISTRIBUTORS IN RADIOTHERAPY MARKET, BY REGION, 2018-2032 (USD THOUSAND)
TABLE 39 MIDDLE EAST AND AFRICA OTHERS IN RADIOTHERAPY MARKET, BY REGION, 2018-2032 (USD THOUSAND)
TABLE 40 MIDDLE EAST AND AFRICA RADIOTHERAPY MARKET, BY COUNTRY, 2018-2032 (USD THOUSAND)
TABLE 41 MIDDLE EAST AND AFRICA RADIOTHERAPY MARKET, BY PRODUCT & SERVICES, 2018-2032 (USD THOUSAND)
TABLE 42 MIDDLE EAST AND AFRICA PRODUCT IN RADIOTHERAPY MARKET, BY PRODUCT & SERVICES, 2018-2032 (USD THOUSAND)
TABLE 43 MIDDLE EAST AND AFRICA EXTERNAL BEAM RADIOTHERAPY IN RADIOTHERAPY MARKET, BY PRODUCT & SERVICES, 2018-2032 (USD THOUSAND)
TABLE 44 MIDDLE EAST AND AFRICA PROTON THERAPY IN RADIOTHERAPY MARKET, BY PRODUCT & SERVICES, 2018-2032 (USD THOUSAND)
TABLE 45 MIDDLE EAST AND AFRICA INTERNAL RADIATION THERAPY IN RADIOTHERAPY MARKET, BY PRODUCT & SERVICES, 2018-2032 (USD THOUSAND)
TABLE 46 MIDDLE EAST AND AFRICA SYSTEMIC RADIOTHERAPY/RADIOPHARMACEUTICALS IN RADIOTHERAPY MARKET, BY PRODUCT & SERVICES, 2018-2032 (USD THOUSAND)
TABLE 47 MIDDLE EAST AND AFRICA SOFTWARE IN RADIOTHERAPY MARKET, BY PRODUCT & SERVICES, 2018-2032 (USD THOUSAND)
TABLE 48 MIDDLE EAST AND AFRICA RADIOTHERAPY MARKET, BY TYPE, 2018-2032 (USD THOUSAND)
TABLE 49 MIDDLE EAST AND AFRICA EXTERNAL-BEAM RADIATION THERAPY IN RADIOTHERAPY MARKET, BY TYPE, 2018-2032 (USD THOUSAND)
TABLE 50 MIDDLE EAST AND AFRICA INTERNAL RADIATION THERAPY IN RADIOTHERAPY MARKET, BY TYPE, 2018-2032 (USD THOUSAND)
TABLE 51 MIDDLE EAST AND AFRICA RADIOTHERAPY MARKET, BY APPLICATION, 2018-2032 (USD THOUSAND)
TABLE 52 MIDDLE EAST AND AFRICA RADIOTHERAPY MARKET, BY END USER, 2018-2032 (USD THOUSAND)
TABLE 53 MIDDLE EAST AND AFRICA RADIOTHERAPY MARKET, BY DISTRIBUTION CHANNEL, 2018-2032 (USD THOUSAND)
TABLE 54 SOUTH AFRICA RADIOTHERAPY MARKET, BY PRODUCT & SERVICES, 2018-2032 (USD THOUSAND)
TABLE 55 SOUTH AFRICA PRODUCT IN RADIOTHERAPY MARKET, BY PRODUCT & SERVICES, 2018-2032 (USD THOUSAND)
TABLE 56 SOUTH AFRICA EXTERNAL BEAM RADIOTHERAPY IN RADIOTHERAPY MARKET, BY PRODUCT & SERVICES, 2018-2032 (USD THOUSAND)
TABLE 57 SOUTH AFRICA PROTON THERAPY IN RADIOTHERAPY MARKET, BY PRODUCT & SERVICES, 2018-2032 (USD THOUSAND)
TABLE 58 SOUTH AFRICA INTERNAL RADIATION THERAPY IN RADIOTHERAPY MARKET, BY PRODUCT & SERVICES, 2018-2032 (USD THOUSAND)
TABLE 59 SOUTH AFRICA SYSTEMIC RADIOTHERAPY/RADIOPHARMACEUTICALS IN RADIOTHERAPY MARKET, BY PRODUCT & SERVICES, 2018-2032 (USD THOUSAND)
TABLE 60 SOUTH AFRICA SOFTWARE IN RADIOTHERAPY MARKET, BY PRODUCT & SERVICES, 2018-2032 (USD THOUSAND)
TABLE 61 SOUTH AFRICA RADIOTHERAPY MARKET, BY TYPE, 2018-2032 (USD THOUSAND)
TABLE 62 SOUTH AFRICA EXTERNAL-BEAM RADIATION THERAPY IN RADIOTHERAPY MARKET, BY TYPE, 2018-2032 (USD THOUSAND)
TABLE 63 SOUTH AFRICA INTERNAL RADIATION THERAPY IN RADIOTHERAPY MARKET, BY TYPE, 2018-2032 (USD THOUSAND)
TABLE 64 SOUTH AFRICA RADIOTHERAPY MARKET, BY APPLICATION, 2018-2032 (USD THOUSAND)
TABLE 65 SOUTH AFRICA RADIOTHERAPY MARKET, BY END USER, 2018-2032 (USD THOUSAND)
TABLE 66 SOUTH AFRICA RADIOTHERAPY MARKET, BY DISTRIBUTION CHANNEL, 2018-2032 (USD THOUSAND)
TABLE 67 SAUDI ARABIA RADIOTHERAPY MARKET, BY PRODUCT & SERVICES, 2018-2032 (USD THOUSAND)
TABLE 68 SAUDI ARABIA PRODUCT IN RADIOTHERAPY MARKET, BY PRODUCT & SERVICES, 2018-2032 (USD THOUSAND)
TABLE 69 SAUDI ARABIA EXTERNAL BEAM RADIOTHERAPY IN RADIOTHERAPY MARKET, BY PRODUCT & SERVICES, 2018-2032 (USD THOUSAND)
TABLE 70 SAUDI ARABIA PROTON THERAPY IN RADIOTHERAPY MARKET, BY PRODUCT & SERVICES, 2018-2032 (USD THOUSAND)
TABLE 71 SAUDI ARABIA INTERNAL RADIATION THERAPY IN RADIOTHERAPY MARKET, BY PRODUCT & SERVICES, 2018-2032 (USD THOUSAND)
TABLE 72 SAUDI ARABIA SYSTEMIC RADIOTHERAPY/RADIOPHARMACEUTICALS IN RADIOTHERAPY MARKET, BY PRODUCT & SERVICES, 2018-2032 (USD THOUSAND)
TABLE 73 SAUDI ARABIA SOFTWARE IN RADIOTHERAPY MARKET, BY PRODUCT & SERVICES, 2018-2032 (USD THOUSAND)
TABLE 74 SAUDI ARABIA RADIOTHERAPY MARKET, BY TYPE, 2018-2032 (USD THOUSAND)
TABLE 75 SAUDI ARABIA EXTERNAL-BEAM RADIATION THERAPY IN RADIOTHERAPY MARKET, BY TYPE, 2018-2032 (USD THOUSAND)
TABLE 76 SAUDI ARABIA INTERNAL RADIATION THERAPY IN RADIOTHERAPY MARKET, BY TYPE, 2018-2032 (USD THOUSAND)
TABLE 77 SAUDI ARABIA RADIOTHERAPY MARKET, BY APPLICATION, 2018-2032 (USD THOUSAND)
TABLE 78 SAUDI ARABIA RADIOTHERAPY MARKET, BY END USER, 2018-2032 (USD THOUSAND)
TABLE 79 SAUDI ARABIA RADIOTHERAPY MARKET, BY DISTRIBUTION CHANNEL, 2018-2032 (USD THOUSAND)
TABLE 80 U.A.E. RADIOTHERAPY MARKET, BY PRODUCT & SERVICES, 2018-2032 (USD THOUSAND)
TABLE 81 U.A.E. PRODUCT IN RADIOTHERAPY MARKET, BY PRODUCT & SERVICES, 2018-2032 (USD THOUSAND)
TABLE 82 U.A.E. EXTERNAL BEAM RADIOTHERAPY IN RADIOTHERAPY MARKET, BY PRODUCT & SERVICES, 2018-2032 (USD THOUSAND)
TABLE 83 U.A.E. PROTON THERAPY IN RADIOTHERAPY MARKET, BY PRODUCT & SERVICES, 2018-2032 (USD THOUSAND)
TABLE 84 U.A.E. INTERNAL RADIATION THERAPY IN RADIOTHERAPY MARKET, BY PRODUCT & SERVICES, 2018-2032 (USD THOUSAND)
TABLE 85 U.A.E. SYSTEMIC RADIOTHERAPY/RADIOPHARMACEUTICALS IN RADIOTHERAPY MARKET, BY PRODUCT & SERVICES, 2018-2032 (USD THOUSAND)
TABLE 86 U.A.E. SOFTWARE IN RADIOTHERAPY MARKET, BY PRODUCT & SERVICES, 2018-2032 (USD THOUSAND)
TABLE 87 U.A.E. RADIOTHERAPY MARKET, BY TYPE, 2018-2032 (USD THOUSAND)
TABLE 88 U.A.E. EXTERNAL-BEAM RADIATION THERAPY IN RADIOTHERAPY MARKET, BY TYPE, 2018-2032 (USD THOUSAND)
TABLE 89 U.A.E. INTERNAL RADIATION THERAPY IN RADIOTHERAPY MARKET, BY TYPE, 2018-2032 (USD THOUSAND)
TABLE 90 U.A.E. RADIOTHERAPY MARKET, BY APPLICATION, 2018-2032 (USD THOUSAND)
TABLE 91 U.A.E. RADIOTHERAPY MARKET, BY END USER, 2018-2032 (USD THOUSAND)
TABLE 92 U.A.E. RADIOTHERAPY MARKET, BY DISTRIBUTION CHANNEL, 2018-2032 (USD THOUSAND)
TABLE 93 EGYPT RADIOTHERAPY MARKET, BY PRODUCT & SERVICES, 2018-2032 (USD THOUSAND)
TABLE 94 EGYPT PRODUCT IN RADIOTHERAPY MARKET, BY PRODUCT & SERVICES, 2018-2032 (USD THOUSAND)
TABLE 95 EGYPT EXTERNAL BEAM RADIOTHERAPY IN RADIOTHERAPY MARKET, BY PRODUCT & SERVICES, 2018-2032 (USD THOUSAND)
TABLE 96 EGYPT PROTON THERAPY IN RADIOTHERAPY MARKET, BY PRODUCT & SERVICES, 2018-2032 (USD THOUSAND)
TABLE 97 EGYPT INTERNAL RADIATION THERAPY IN RADIOTHERAPY MARKET, BY PRODUCT & SERVICES, 2018-2032 (USD THOUSAND)
TABLE 98 EGYPT SYSTEMIC RADIOTHERAPY/RADIOPHARMACEUTICALS IN RADIOTHERAPY MARKET, BY PRODUCT & SERVICES, 2018-2032 (USD THOUSAND)
TABLE 99 EGYPT SOFTWARE IN RADIOTHERAPY MARKET, BY PRODUCT & SERVICES, 2018-2032 (USD THOUSAND)
TABLE 100 EGYPT RADIOTHERAPY MARKET, BY TYPE, 2018-2032 (USD THOUSAND)
TABLE 101 EGYPT EXTERNAL-BEAM RADIATION THERAPY IN RADIOTHERAPY MARKET, BY TYPE, 2018-2032 (USD THOUSAND)
TABLE 102 EGYPT INTERNAL RADIATION THERAPY IN RADIOTHERAPY MARKET, BY TYPE, 2018-2032 (USD THOUSAND)
TABLE 103 EGYPT RADIOTHERAPY MARKET, BY APPLICATION, 2018-2032 (USD THOUSAND)
TABLE 104 EGYPT RADIOTHERAPY MARKET, BY END USER, 2018-2032 (USD THOUSAND)
TABLE 105 EGYPT RADIOTHERAPY MARKET, BY DISTRIBUTION CHANNEL, 2018-2032 (USD THOUSAND)
TABLE 106 BAHRAIN RADIOTHERAPY MARKET, BY PRODUCT & SERVICES, 2018-2032 (USD THOUSAND)
TABLE 107 BAHRAIN PRODUCT IN RADIOTHERAPY MARKET, BY PRODUCT & SERVICES, 2018-2032 (USD THOUSAND)
TABLE 108 BAHRAIN EXTERNAL BEAM RADIOTHERAPY IN RADIOTHERAPY MARKET, BY PRODUCT & SERVICES, 2018-2032 (USD THOUSAND)
TABLE 109 BAHRAIN PROTON THERAPY IN RADIOTHERAPY MARKET, BY PRODUCT & SERVICES, 2018-2032 (USD THOUSAND)
TABLE 110 BAHRAIN INTERNAL RADIATION THERAPY IN RADIOTHERAPY MARKET, BY PRODUCT & SERVICES, 2018-2032 (USD THOUSAND)
TABLE 111 BAHRAIN SYSTEMIC RADIOTHERAPY/RADIOPHARMACEUTICALS IN RADIOTHERAPY MARKET, BY PRODUCT & SERVICES, 2018-2032 (USD THOUSAND)
TABLE 112 BAHRAIN SOFTWARE IN RADIOTHERAPY MARKET, BY PRODUCT & SERVICES, 2018-2032 (USD THOUSAND)
TABLE 113 BAHRAIN RADIOTHERAPY MARKET, BY TYPE, 2018-2032 (USD THOUSAND)
TABLE 114 BAHRAIN EXTERNAL-BEAM RADIATION THERAPY IN RADIOTHERAPY MARKET, BY TYPE, 2018-2032 (USD THOUSAND)
TABLE 115 BAHRAIN INTERNAL RADIATION THERAPY IN RADIOTHERAPY MARKET, BY TYPE, 2018-2032 (USD THOUSAND)
TABLE 116 BAHRAIN RADIOTHERAPY MARKET, BY APPLICATION, 2018-2032 (USD THOUSAND)
TABLE 117 BAHRAIN RADIOTHERAPY MARKET, BY END USER, 2018-2032 (USD THOUSAND)
TABLE 118 BAHRAIN RADIOTHERAPY MARKET, BY DISTRIBUTION CHANNEL, 2018-2032 (USD THOUSAND)
TABLE 119 KUWAIT RADIOTHERAPY MARKET, BY PRODUCT & SERVICES, 2018-2032 (USD THOUSAND)
TABLE 120 KUWAIT PRODUCT IN RADIOTHERAPY MARKET, BY PRODUCT & SERVICES, 2018-2032 (USD THOUSAND)
TABLE 121 KUWAIT EXTERNAL BEAM RADIOTHERAPY IN RADIOTHERAPY MARKET, BY PRODUCT & SERVICES, 2018-2032 (USD THOUSAND)
TABLE 122 KUWAIT PROTON THERAPY IN RADIOTHERAPY MARKET, BY PRODUCT & SERVICES, 2018-2032 (USD THOUSAND)
TABLE 123 KUWAIT INTERNAL RADIATION THERAPY IN RADIOTHERAPY MARKET, BY PRODUCT & SERVICES, 2018-2032 (USD THOUSAND)
TABLE 124 KUWAIT SYSTEMIC RADIOTHERAPY/RADIOPHARMACEUTICALS IN RADIOTHERAPY MARKET, BY PRODUCT & SERVICES, 2018-2032 (USD THOUSAND)
TABLE 125 KUWAIT SOFTWARE IN RADIOTHERAPY MARKET, BY PRODUCT & SERVICES, 2018-2032 (USD THOUSAND)
TABLE 126 KUWAIT RADIOTHERAPY MARKET, BY TYPE, 2018-2032 (USD THOUSAND)
TABLE 127 KUWAIT EXTERNAL-BEAM RADIATION THERAPY IN RADIOTHERAPY MARKET, BY TYPE, 2018-2032 (USD THOUSAND)
TABLE 128 KUWAIT INTERNAL RADIATION THERAPY IN RADIOTHERAPY MARKET, BY TYPE, 2018-2032 (USD THOUSAND)
TABLE 129 KUWAIT RADIOTHERAPY MARKET, BY APPLICATION, 2018-2032 (USD THOUSAND)
TABLE 130 KUWAIT RADIOTHERAPY MARKET, BY END USER, 2018-2032 (USD THOUSAND)
TABLE 131 KUWAIT RADIOTHERAPY MARKET, BY DISTRIBUTION CHANNEL, 2018-2032 (USD THOUSAND)
TABLE 132 QATAR RADIOTHERAPY MARKET, BY PRODUCT & SERVICES, 2018-2032 (USD THOUSAND)
TABLE 133 QATAR PRODUCT IN RADIOTHERAPY MARKET, BY PRODUCT & SERVICES, 2018-2032 (USD THOUSAND)
TABLE 134 QATAR EXTERNAL BEAM RADIOTHERAPY IN RADIOTHERAPY MARKET, BY PRODUCT & SERVICES, 2018-2032 (USD THOUSAND)
TABLE 135 QATAR PROTON THERAPY IN RADIOTHERAPY MARKET, BY PRODUCT & SERVICES, 2018-2032 (USD THOUSAND)
TABLE 136 QATAR INTERNAL RADIATION THERAPY IN RADIOTHERAPY MARKET, BY PRODUCT & SERVICES, 2018-2032 (USD THOUSAND)
TABLE 137 QATAR SYSTEMIC RADIOTHERAPY/RADIOPHARMACEUTICALS IN RADIOTHERAPY MARKET, BY PRODUCT & SERVICES, 2018-2032 (USD THOUSAND)
TABLE 138 QATAR SOFTWARE IN RADIOTHERAPY MARKET, BY PRODUCT & SERVICES, 2018-2032 (USD THOUSAND)
TABLE 139 QATAR RADIOTHERAPY MARKET, BY TYPE, 2018-2032 (USD THOUSAND)
TABLE 140 QATAR EXTERNAL-BEAM RADIATION THERAPY IN RADIOTHERAPY MARKET, BY TYPE, 2018-2032 (USD THOUSAND)
TABLE 141 QATAR INTERNAL RADIATION THERAPY IN RADIOTHERAPY MARKET, BY TYPE, 2018-2032 (USD THOUSAND)
TABLE 142 QATAR RADIOTHERAPY MARKET, BY APPLICATION, 2018-2032 (USD THOUSAND)
TABLE 143 QATAR RADIOTHERAPY MARKET, BY END USER, 2018-2032 (USD THOUSAND)
TABLE 144 QATAR RADIOTHERAPY MARKET, BY DISTRIBUTION CHANNEL, 2018-2032 (USD THOUSAND)
TABLE 145 OMAN RADIOTHERAPY MARKET, BY PRODUCT & SERVICES, 2018-2032 (USD THOUSAND)
TABLE 146 OMAN PRODUCT IN RADIOTHERAPY MARKET, BY PRODUCT & SERVICES, 2018-2032 (USD THOUSAND)
TABLE 147 OMAN EXTERNAL BEAM RADIOTHERAPY IN RADIOTHERAPY MARKET, BY PRODUCT & SERVICES, 2018-2032 (USD THOUSAND)
TABLE 148 OMAN PROTON THERAPY IN RADIOTHERAPY MARKET, BY PRODUCT & SERVICES, 2018-2032 (USD THOUSAND)
TABLE 149 OMAN INTERNAL RADIATION THERAPY IN RADIOTHERAPY MARKET, BY PRODUCT & SERVICES, 2018-2032 (USD THOUSAND)
TABLE 150 OMAN SYSTEMIC RADIOTHERAPY/RADIOPHARMACEUTICALS IN RADIOTHERAPY MARKET, BY PRODUCT & SERVICES, 2018-2032 (USD THOUSAND)
TABLE 151 OMAN SOFTWARE IN RADIOTHERAPY MARKET, BY PRODUCT & SERVICES, 2018-2032 (USD THOUSAND)
TABLE 152 OMAN RADIOTHERAPY MARKET, BY TYPE, 2018-2032 (USD THOUSAND)
TABLE 153 OMAN EXTERNAL-BEAM RADIATION THERAPY IN RADIOTHERAPY MARKET, BY TYPE, 2018-2032 (USD THOUSAND)
TABLE 154 OMAN INTERNAL RADIATION THERAPY IN RADIOTHERAPY MARKET, BY TYPE, 2018-2032 (USD THOUSAND)
TABLE 155 OMAN RADIOTHERAPY MARKET, BY APPLICATION, 2018-2032 (USD THOUSAND)
TABLE 156 OMAN RADIOTHERAPY MARKET, BY END USER, 2018-2032 (USD THOUSAND)
TABLE 157 OMAN RADIOTHERAPY MARKET, BY DISTRIBUTION CHANNEL, 2018-2032 (USD THOUSAND)
TABLE 158 MOROCCO RADIOTHERAPY MARKET, BY PRODUCT & SERVICES, 2018-2032 (USD THOUSAND)
TABLE 159 MOROCCO PRODUCT IN RADIOTHERAPY MARKET, BY PRODUCT & SERVICES, 2018-2032 (USD THOUSAND)
TABLE 160 MOROCCO EXTERNAL BEAM RADIOTHERAPY IN RADIOTHERAPY MARKET, BY PRODUCT & SERVICES, 2018-2032 (USD THOUSAND)
TABLE 161 MOROCCO PROTON THERAPY IN RADIOTHERAPY MARKET, BY PRODUCT & SERVICES, 2018-2032 (USD THOUSAND)
TABLE 162 MOROCCO INTERNAL RADIATION THERAPY IN RADIOTHERAPY MARKET, BY PRODUCT & SERVICES, 2018-2032 (USD THOUSAND)
TABLE 163 MOROCCO SYSTEMIC RADIOTHERAPY/RADIOPHARMACEUTICALS IN RADIOTHERAPY MARKET, BY PRODUCT & SERVICES, 2018-2032 (USD THOUSAND)
TABLE 164 MOROCCO SOFTWARE IN RADIOTHERAPY MARKET, BY PRODUCT & SERVICES, 2018-2032 (USD THOUSAND)
TABLE 165 MOROCCO RADIOTHERAPY MARKET, BY TYPE, 2018-2032 (USD THOUSAND)
TABLE 166 MOROCCO EXTERNAL-BEAM RADIATION THERAPY IN RADIOTHERAPY MARKET, BY TYPE, 2018-2032 (USD THOUSAND)
TABLE 167 MOROCCO INTERNAL RADIATION THERAPY IN RADIOTHERAPY MARKET, BY TYPE, 2018-2032 (USD THOUSAND)
TABLE 168 MOROCCO RADIOTHERAPY MARKET, BY APPLICATION, 2018-2032 (USD THOUSAND)
TABLE 169 MOROCCO RADIOTHERAPY MARKET, BY END USER, 2018-2032 (USD THOUSAND)
TABLE 170 MOROCCO RADIOTHERAPY MARKET, BY DISTRIBUTION CHANNEL, 2018-2032 (USD THOUSAND)
TABLE 171 REST OF MIDDLE EAST AND AFRICA RADIOTHERAPY MARKET, BY PRODUCT & SERVICES, 2018-2032 (USD THOUSAND)
List of Figure
FIGURE 1 MIDDLE EAST AND AFRICA RADIOTHERAPY MARKET: SEGMENTATION
FIGURE 2 MIDDLE EAST AND AFRICA RADIOTHERAPY MARKET: DATA TRIANGULATION
FIGURE 3 MIDDLE EAST AND AFRICA RADIOTHERAPY MARKET: DROC ANALYSIS
FIGURE 4 MIDDLE EAST AND AFRICA RADIOTHERAPY MARKET: MIDDLE EAST AND AFRICA VS REGIONAL MARKET ANALYSIS
FIGURE 5 MIDDLE EAST AND AFRICA RADIOTHERAPY MARKET: COMPANY RESEARCH ANALYSIS
FIGURE 6 MIDDLE EAST AND AFRICA RADIOTHERAPY MARKET: INTERVIEW DEMOGRAPHICS
FIGURE 7 MIDDLE EAST AND AFRICA RADIOTHERAPY MARKET: MULTIVARIATE MODELLING
FIGURE 8 MIDDLE EAST AND AFRICA RADIOTHERAPY MARKET: PRODUCT & SERVICES LIFELINE CURVE
FIGURE 9 MIDDLE EAST AND AFRICA RADIOTHERAPY MARKET: MARKET END USER COVERAGE GRID
FIGURE 10 MIDDLE EAST AND AFRICA RADIOTHERAPY MARKET: DBMR MARKET POSITION GRID
FIGURE 11 MIDDLE EAST AND AFRICA RADIOTHERAPY MARKET: VENDOR SHARE ANALYSIS
FIGURE 12 MIDDLE EAST AND AFRICA RADIOTHERAPY MARKET: SEGMENTATION
FIGURE 13 MIDDLE EAST AND AFRICA RADIOTHERAPY MARKET: EXECUTIVE SUMMARY
FIGURE 14 MIDDLE EAST AND AFRICA RADIOTHERAPY MARKET: STRATEGIC DECISIONS
FIGURE 15 NOVEL TECHNOLOGY IN RADIOTHERAPY FOR CANCER TREATMENT IS EXPECTED TO DRIVE THE GROWTH OF THE MIDDLE EAST AND AFRICA RADIOTHERAPY MARKET FROM 2025 TO 2032
FIGURE 16 THE SERVICES SEGMENT IS EXPECTED TO ACCOUNT FOR THE LARGEST SHARE OF THE MIDDLE EAST AND AFRICA RADIOTHERAPY MARKET IN 2025 & 2032
FIGURE 17 DRIVERS, RESTRAINTS, OPPORTUNITIES AND CHALLENGES OF MIDDLE EAST AND AFRICA RADIOTHERAPY MARKET
FIGURE 18 MIDDLE EAST AND AFRICA RADIOTHERAPY MARKET: BY PRODUCT & SERVICES, 2024
FIGURE 19 MIDDLE EAST AND AFRICA RADIOTHERAPY MARKET: BY PRODUCT & SERVICES, 2025-2032 (USD THOUSAND)
FIGURE 20 MIDDLE EAST AND AFRICA RADIOTHERAPY MARKET: BY PRODUCT & SERVICES, CAGR (2025-2032)
FIGURE 21 MIDDLE EAST AND AFRICA RADIOTHERAPY MARKET: BY PRODUCT & SERVICES, LIFELINE CURVE
FIGURE 22 MIDDLE EAST AND AFRICA RADIOTHERAPY MARKET: BY TYPE, 2024
FIGURE 23 MIDDLE EAST AND AFRICA RADIOTHERAPY MARKET: BY TYPE, 2025-2032 (USD THOUSAND)
FIGURE 24 MIDDLE EAST AND AFRICA RADIOTHERAPY MARKET: BY TYPE, CAGR (2025-2032)
FIGURE 25 MIDDLE EAST AND AFRICA RADIOTHERAPY MARKET: BY TYPE, LIFELINE CURVE
FIGURE 26 MIDDLE EAST AND AFRICA RADIOTHERAPY MARKET: BY APPLICATION, 2024
FIGURE 27 MIDDLE EAST AND AFRICA RADIOTHERAPY MARKET: BY APPLICATION, 2025-2032 (USD THOUSAND)
FIGURE 28 MIDDLE EAST AND AFRICA RADIOTHERAPY MARKET: BY APPLICATION, CAGR (2025-2032)
FIGURE 29 MIDDLE EAST AND AFRICA RADIOTHERAPY MARKET: BY APPLICATION, LIFELINE CURVE
FIGURE 30 MIDDLE EAST AND AFRICA RADIOTHERAPY MARKET: BY END USER, 2024
FIGURE 31 MIDDLE EAST AND AFRICA RADIOTHERAPY MARKET: BY END USER, 2025-2032 (USD THOUSAND)
FIGURE 32 MIDDLE EAST AND AFRICA RADIOTHERAPY MARKET: BY END USER, CAGR (2025-2032)
FIGURE 33 MIDDLE EAST AND AFRICA RADIOTHERAPY MARKET: BY END USER LIFELINE CURVE
FIGURE 34 MIDDLE EAST AND AFRICA RADIOTHERAPY MARKET: BY DISTRIBUTION CHANNEL, 2024
FIGURE 35 MIDDLE EAST AND AFRICA RADIOTHERAPY MARKET: BY DISTRIBUTION CHANNEL, 2025-2032 (USD THOUSAND)
FIGURE 36 MIDDLE EAST AND AFRICA RADIOTHERAPY MARKET: BY DISTRIBUTION CHANNEL, CAGR (2025-2032)
FIGURE 37 MIDDLE EAST AND AFRICA RADIOTHERAPY MARKET: BY DISTRIBUTION CHANNEL, LIFELINE CURVE
FIGURE 38 MIDDLE EAST AND AFRICA RADIOTHERAPY MARKET: SNAPSHOT (2024)
FIGURE 39 MIDDLE EAST AND AFRICA RADIOTHERAPY MARKET: COMPANY SHARE 2024 (%)
Research Methodology
Data collection and base year analysis are done using data collection modules with large sample sizes. The stage includes obtaining market information or related data through various sources and strategies. It includes examining and planning all the data acquired from the past in advance. It likewise envelops the examination of information inconsistencies seen across different information sources. The market data is analysed and estimated using market statistical and coherent models. Also, market share analysis and key trend analysis are the major success factors in the market report. To know more, please request an analyst call or drop down your inquiry.
The key research methodology used by DBMR research team is data triangulation which involves data mining, analysis of the impact of data variables on the market and primary (industry expert) validation. Data models include Vendor Positioning Grid, Market Time Line Analysis, Market Overview and Guide, Company Positioning Grid, Patent Analysis, Pricing Analysis, Company Market Share Analysis, Standards of Measurement, Global versus Regional and Vendor Share Analysis. To know more about the research methodology, drop in an inquiry to speak to our industry experts.
Customization Available
Data Bridge Market Research is a leader in advanced formative research. We take pride in servicing our existing and new customers with data and analysis that match and suits their goal. The report can be customized to include price trend analysis of target brands understanding the market for additional countries (ask for the list of countries), clinical trial results data, literature review, refurbished market and product base analysis. Market analysis of target competitors can be analyzed from technology-based analysis to market portfolio strategies. We can add as many competitors that you require data about in the format and data style you are looking for. Our team of analysts can also provide you data in crude raw excel files pivot tables (Fact book) or can assist you in creating presentations from the data sets available in the report.

