
Middle East And Africa Mobility As A Service Market
Market Size in USD Billion
 USD
29.01 Billion
USD
259.46 Billion
2025
2033
USD
29.01 Billion
USD
259.46 Billion
2025
2033
| 2026 - 2033 | |
| USD 29.01 Billion | |
| USD 259.46 Billion | |
| % | |
|
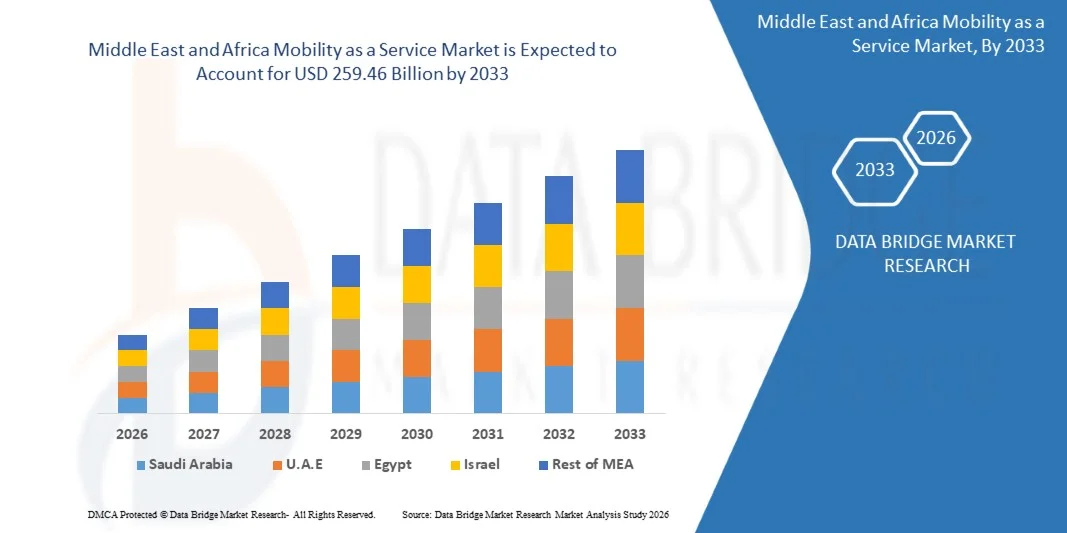
Middle East and Africa Mobility as a Service Market Size
- The Middle East and Africa Mobility as a Service Market size was valued at USD 29.01 billion in 2025 and is expected to reach USD 259.46 billion by 2033, at a CAGR of 31.50% during the forecast period.
- The market growth is primarily driven by increasing urbanization, rising smartphone penetration, and advancements in AI and IoT technologies, which are facilitating seamless, on-demand, and integrated mobility solutions across the region.
- Additionally, growing consumer preference for cost-effective, flexible, and sustainable transportation options is encouraging the adoption of MaaS platforms, further accelerating market expansion and positioning the region as a key hub for innovative mobility solutions.
Middle East and Africa Mobility as a Service Market Analysis
- Mobility as a Service (MaaS), providing integrated, on-demand, and multi-modal transportation solutions, is becoming an essential component of urban mobility in both public and private sectors due to its convenience, real-time accessibility, and seamless integration with digital platforms.
- The rising demand for MaaS is primarily driven by increasing urbanization, growing smartphone penetration, environmental concerns, and a shift toward cost-effective and sustainable transportation options.
- U.A.E. dominated the Middle East and Africa Mobility as a Service Market with the largest revenue share of 32.5% in 2025, supported by early adoption of digital mobility solutions, high disposable incomes, and a strong presence of key industry players, with the U.S. witnessing significant growth in app-based ride-sharing and integrated mobility platforms, driven by innovations from both established mobility providers and tech startups.
- Saudi Arabia is expected to be the fastest-growing region in the Middle East and Africa Mobility as a Service Market during the forecast period due to rapid urbanization, expanding public transport networks, and rising disposable incomes.
- The ride-hailing segment dominated the market with the largest revenue share of 38.6% in 2025, driven by widespread smartphone adoption, urban congestion challenges, and the convenience of on-demand travel.
Report Scope and Middle East and Africa Mobility as a Service Market Segmentation
|
Attributes |
Mobility as a Service Key Market Insights |
|
Segments Covered |
|
|
Countries Covered |
Middle East and Africa
|
|
Key Market Players |
|
|
Market Opportunities |
|
|
Value Added Data Infosets |
In addition to the market insights such as market value, growth rate, market segments, geographical coverage, market players, and market scenario, the market report curated by the Data Bridge Market Research team includes in-depth expert analysis, import/export analysis, pricing analysis, production consumption analysis, and pestle analysis. |
Middle East and Africa Mobility as a Service Market Trends
“Enhanced Convenience Through AI and Predictive Mobility”
- A significant and accelerating trend in the Middle East and Africa Mobility as a Service Market is the increasing integration of artificial intelligence (AI) and predictive analytics into MaaS platforms, enhancing user convenience, personalization, and operational efficiency.
- For instance, apps such as Careem and Bolt utilize AI-driven routing and predictive demand algorithms to optimize ride allocation, reduce waiting times, and improve trip efficiency, offering a seamless and highly responsive mobility experience.
- AI integration in MaaS enables features such as learning user travel patterns to suggest optimal routes, providing intelligent notifications about delays or disruptions, and dynamically adjusting pricing and vehicle availability. For example, Moovit uses AI to deliver real-time multi-modal transit recommendations based on user habits, traffic conditions, and service disruptions.
- The seamless integration of MaaS platforms with voice assistants and digital ecosystems allows users to plan, book, and manage multi-modal journeys through a single interface, including ride-hailing, public transport, and micromobility options. This unified control enhances convenience and encourages broader adoption of MaaS services.
- This trend towards more intelligent, predictive, and interconnected mobility solutions is fundamentally reshaping user expectations for urban transport. Consequently, companies such as Uber and JoRide are developing AI-enabled features, including predictive ride availability, smart route suggestions, and voice-activated trip management through platforms like Google Assistant and Amazon Alexa.
- The demand for MaaS platforms that offer seamless AI-driven optimization and voice-enabled control is growing rapidly across both private and public transportation sectors, as consumers increasingly prioritize convenience, efficiency, and integrated urban mobility solutions.
Middle East and Africa Mobility as a Service Market Dynamics
Driver
“Growing Need Due to Urbanization, Environmental Concerns, and Digital Adoption”
- The increasing challenges of urban congestion, rising environmental awareness, and the accelerating adoption of digital transportation platforms are significant drivers for the heightened demand for Mobility as a Service (MaaS) in the Middle East and Africa.
- For instance, in early 2025, Careem launched AI-powered predictive ride allocation in several UAE cities, aiming to reduce traffic congestion and optimize fleet utilization. Such strategies by leading companies are expected to drive MaaS market growth during the forecast period.
- As consumers seek cost-effective, flexible, and eco-friendly alternatives to private car ownership, MaaS platforms offer advanced features such as real-time ride tracking, multi-modal route planning, and dynamic pricing, providing a compelling upgrade over traditional transportation options.
- Furthermore, the growing popularity of smartphone-based mobility apps and integrated digital ecosystems is making MaaS an essential component of urban transport, offering seamless connectivity with public transit, ride-hailing, and micromobility services.
- The convenience of on-demand booking, cashless payments, multi-modal trip planning, and the ability to access services through mobile applications are key factors propelling the adoption of MaaS across both personal and corporate transportation sectors. The trend towards app-based travel management and increasing availability of user-friendly platforms further contributes to market expansion.
Restraint/Challenge
“Concerns Regarding Data Privacy, Cybersecurity, and Infrastructure Limitations”
- Concerns surrounding data privacy, cybersecurity, and inconsistent transportation infrastructure pose significant challenges to broader MaaS adoption. As MaaS platforms rely on digital connectivity and user data, they are susceptible to cyberattacks and data breaches, raising consumer anxieties regarding the safety of personal and payment information.
- For instance, reports of vulnerabilities in ride-hailing apps or public transit integration platforms have made some users hesitant to adopt fully digital mobility solutions.
- Addressing these concerns through secure encryption, robust authentication protocols, and regular system updates is crucial for building consumer trust. Companies such as Uber and Bolt emphasize their cybersecurity measures and data protection features to reassure users. Additionally, inconsistent public transport networks, limited digital infrastructure in certain regions, and high initial costs of app-based subscriptions can be barriers to adoption, particularly in developing areas.
- While MaaS platforms are becoming more affordable and accessible, perceived reliability issues or concerns over service coverage can still hinder widespread adoption, especially among first-time users or price-sensitive consumers.
- Overcoming these challenges through enhanced cybersecurity, investment in digital infrastructure, government support for integrated mobility, and consumer education on app safety will be vital for sustained market growth in the region.
Middle East and Africa Mobility as a Service Market Scope
The mobility as a service market is segmented on the basis of service type, solution, transportation type, vehicle type, application platform, requirement type, organization size and usage.
- By Service Type
On the basis of service type, the Middle East and Africa Mobility as a Service Market is segmented into car sharing, bus sharing, train, ride-hailing, bicycle sharing, self-driving cars, and others. The ride-hailing segment dominated the market with the largest revenue share of 38.6% in 2025, driven by widespread smartphone adoption, urban congestion challenges, and the convenience of on-demand travel. Consumers increasingly prefer app-based ride-hailing for both short and medium-distance commutes due to its affordability, time efficiency, and door-to-door service.
The bicycle-sharing segment is expected to witness the fastest CAGR of 22.4% from 2026 to 2033, fueled by growing environmental awareness, government initiatives promoting green mobility, and increasing investments in micromobility infrastructure. The expansion of shared mobility services in urban areas, coupled with supportive policies and rising demand for eco-friendly transport, is driving the rapid adoption of bicycle-sharing solutions across the region.
- By Solution
On the basis of solution, the Middle East and Africa Mobility as a Service Market is segmented into navigation solutions, ticketing solutions, technology platforms, insurance services, telecom connectivity providers, and payment engines. Technology platforms dominated the market with the largest revenue share of 41.3% in 2025, as they provide the critical backbone for MaaS operations, including ride management, multi-modal integration, and real-time tracking.
Payment engines are expected to witness the fastest CAGR of 20.8% during the forecast period, driven by the increasing demand for seamless cashless transactions and integration with digital wallets. The rapid adoption of contactless payments and the expansion of smartphone-based payment solutions across the region are enabling smoother user experiences, fostering the growth of MaaS adoption, and encouraging partnerships between mobility operators and fintech providers.
- By Transportation Type
On the basis of transportation type, the Middle East and Africa Mobility as a Service Market is segmented into public and private transportation. The private transportation segment dominated the market with the largest revenue share of 57.2% in 2025, primarily due to the popularity of ride-hailing services, car-sharing platforms, and app-based taxi services that offer flexible and convenient travel.
Public transportation is expected to witness the fastest CAGR of 18.9% during the forecast period, driven by government initiatives to modernize urban transit systems, integration with MaaS platforms, and increasing urban population density. Investments in digital ticketing, real-time tracking, and multi-modal transport apps are enabling public transit operators to enhance accessibility and convenience, accelerating MaaS adoption among commuters who rely on buses, trains, and metro systems.
- By Vehicle Type
On the basis of vehicle type, the Middle East and Africa Mobility as a Service Market is segmented into four-wheelers, buses, trains, and micro-mobility vehicles. Four-wheelers dominated the market with the largest revenue share of 52.5% in 2025, driven by the prevalence of app-based car rentals, ride-hailing services, and corporate mobility solutions.
Micro-mobility vehicles, including e-scooters and bicycles, are expected to witness the fastest CAGR of 23.1% from 2026 to 2033, fueled by increasing environmental awareness, government support for sustainable transport, and growing urban congestion. The adoption of micro-mobility solutions is rapidly expanding in cities with dense traffic, offering flexible last-mile connectivity and complementing existing public and private transportation networks.
- By Application Platform
On the basis of application platform, the Middle East and Africa Mobility as a Service Market is segmented into iOS, Android, and others. The Android segment dominated the market with the largest revenue share of 63.4% in 2025, driven by the higher penetration of Android smartphones across the region, particularly in developing countries.
The iOS segment is expected to witness the fastest CAGR of 19.7% during the forecast period, fueled by growing adoption among premium smartphone users and integration with advanced MaaS applications. Cross-platform compatibility and user-friendly interfaces are essential for MaaS adoption, enabling commuters to access ride-hailing, ticketing, and multi-modal planning services seamlessly on their preferred devices.
- By Requirement Type
On the basis of requirement type, the Middle East and Africa Mobility as a Service Market is segmented into first and last mile connectivity, off-peak and shift work commute, daily commuter, airport or mass transit stations trips, inter-city trips, and others. Daily commuter trips dominated the market with the largest revenue share of 44.1% in 2025, driven by the need for reliable, cost-effective, and flexible solutions for routine urban travel.
First and last mile connectivity is expected to witness the fastest CAGR of 21.5% during the forecast period, supported by the expansion of micromobility networks, bike-sharing schemes, and integration with public transport hubs. This segment is critical for enhancing commuter convenience and ensuring seamless multi-modal travel experiences.
- By Organization Size
On the basis of organization size, the Middle East and Africa Mobility as a Service Market is segmented into large enterprises and small and medium-sized enterprises (SMEs). Large enterprises dominated the market with the largest revenue share of 59.3% in 2025, driven by corporate mobility programs, employee transport solutions, and fleet management services that enhance operational efficiency.
SMEs are expected to witness the fastest CAGR of 22.0% during the forecast period, fueled by growing adoption of flexible mobility services, cost-effective solutions, and digital platforms that help smaller organizations manage transportation needs efficiently. The increasing availability of scalable MaaS solutions tailored for SMEs is accelerating market penetration across diverse business segments.
- By Usage
On the basis of usage, the Middle East and Africa Mobility as a Service Market is segmented into commercial and personal. Personal usage dominated the market with the largest revenue share of 54.6% in 2025, driven by the widespread adoption of ride-hailing, car-sharing, and micro-mobility solutions for individual commuters.
Commercial usage is expected to witness the fastest CAGR of 20.9% from 2026 to 2033, fueled by growing demand for employee transport, corporate fleet management, and logistics solutions. Businesses are increasingly leveraging MaaS platforms to optimize costs, improve employee satisfaction, and integrate transportation planning into broader operational strategies, supporting robust growth in the commercial segment.
Middle East and Africa Mobility as a Service Market Regional Analysis
- U.A.E. dominated the Middle East and Africa Mobility as a Service Market with the largest revenue share of 32.5% in 2025, driven by the growing adoption of digital mobility solutions, high urbanization, and increased awareness of app-based transportation platforms.
- Consumers in the region highly value the convenience, real-time tracking, and seamless integration offered by MaaS platforms with other digital services such as navigation apps, payment solutions, and public transport schedules.
- This widespread adoption is further supported by high disposable incomes, a tech-savvy population, and a preference for flexible, cost-effective, and sustainable transportation options, establishing MaaS as a preferred mobility solution for both personal and corporate users.
Saudi Arabia MaaS Market Insight
The Saudi Arabia Mobility as a Service Market is experiencing significant growth, driven by rapid urbanization, government initiatives to modernize transport infrastructure, and rising smartphone penetration. Consumers are increasingly adopting app-based ride-hailing, car-sharing, and multi-modal transport solutions to navigate congested urban areas. The market is further supported by the Vision 2030 plan, which emphasizes smart city development, sustainable mobility, and digitalization of transportation. Corporate mobility programs and investments in integrated MaaS platforms are also boosting adoption across commercial and residential sectors.
U.A.E. MaaS Market Insight
The U.A.E. Mobility as a Service Market is witnessing robust expansion, fueled by a tech-savvy population, high disposable incomes, and the widespread use of smartphones. The popularity of ride-hailing services, combined with government investments in smart city initiatives and public transport integration, is driving MaaS adoption. Dubai and Abu Dhabi are leading hubs for app-based mobility solutions, offering seamless integration with taxis, metro systems, and buses. The adoption of AI-powered features, real-time navigation, and cashless payments further enhances convenience, encouraging both residents and businesses to rely on MaaS platforms.
South Africa MaaS Market Insight
The South Africa Mobility as a Service Market is growing steadily, supported by increasing urbanization, a rising need for flexible commuting options, and the expansion of app-based ride-hailing and car-sharing services. Consumers are prioritizing affordable, convenient, and reliable mobility solutions, particularly in major urban centers such as Johannesburg and Cape Town. The market is further driven by the adoption of mobile payment platforms, integration with public transport, and growing awareness of environmentally friendly transportation alternatives. Demand is also rising among corporate clients seeking fleet management and employee commute solutions.
Egypt MaaS Market Insight
The Egypt Mobility as a Service Market is poised for rapid growth due to the country’s increasing urban population, traffic congestion challenges, and expanding smartphone penetration. Consumers are adopting ride-hailing, bus-sharing, and multi-modal transport services to navigate congested cities such as Cairo and Alexandria. The government’s push for smart city initiatives, investment in public transportation infrastructure, and digital payment solutions are further boosting the market. Integration of real-time route planning, multi-modal ticketing, and app-based fleet services enhances convenience for both personal and commercial users, driving widespread MaaS adoption across the country.
Middle East and Africa Mobility as a Service Market Share
The Mobility as a Service industry is primarily led by well-established companies, including:
- Uber (U.S.)
- Careem (U.A.E.)
- Bolt (Estonia)
- Ola (India)
- Didi Chuxing (China)
- Moovit (Israel)
- Free Now (Germany)
- Via (U.S.)
- BlaBlaCar (France)
- LeCab (France)
- MAX (South Africa)
- Karhoo (U.K.)
- CleverShuttle (Germany)
- Heetch (France)
- Transit (U.S.)
- JoRide (U.A.E.)
- Yango (Russia)
- Grab (Singapore)
- Terra Mobility (South Africa)
- Swvl (Egypt)
What are the Recent Developments in Middle East and Africa Mobility as a Service Market?
- In April 2025, Careem, a leading ride-hailing platform in the Middle East, launched an AI-powered predictive ride allocation system in Riyadh, Saudi Arabia, aimed at reducing traffic congestion and improving urban mobility efficiency. This initiative underscores Careem’s commitment to delivering innovative, data-driven transportation solutions tailored to the needs of local commuters, reinforcing its leadership in the rapidly growing Middle East and Africa Mobility as a Service Market.
- In March 2025, Uber introduced its multi-modal MaaS integration in Dubai, allowing users to seamlessly plan trips combining ride-hailing, metro, and bus services. The feature enhances commuter convenience by offering real-time route optimization, fare comparison, and unified payment options. This launch highlights Uber’s focus on providing comprehensive mobility solutions in alignment with smart city initiatives across the UAE.
- In March 2025, Bolt expanded its operations in Cape Town, South Africa, deploying electric vehicle fleets and integrating sustainable ride-hailing services into its platform. This expansion emphasizes Bolt’s commitment to eco-friendly urban transport solutions, promoting greener mobility and supporting regional efforts to reduce carbon emissions.
- In February 2025, JoRide, a UAE-based MaaS provider, partnered with Dubai’s Roads and Transport Authority (RTA) to offer first- and last-mile connectivity solutions, integrating bicycles, e-scooters, and shared mobility options with public transit. This collaboration demonstrates JoRide’s focus on creating seamless, multi-modal urban mobility experiences while enhancing accessibility for commuters.
- In January 2025, Moovit, an Israel-based MaaS technology platform, rolled out a unified ticketing and navigation solution across major cities in Egypt, enabling users to access buses, metro, and ride-hailing services through a single mobile app. The initiative reinforces Moovit’s dedication to leveraging advanced technology for efficient, user-friendly, and interconnected urban transport systems in the Middle East and Africa.
SKU-

- Interactive Data Analysis Dashboard
- Company Analysis Dashboard for high growth potential opportunities
- Research Analyst Access for customization & queries
- Competitor Analysis with Interactive dashboard
- Latest News, Updates & Trend analysis
- Harness the Power of Benchmark Analysis for Comprehensive Competitor Tracking
Data collection and base year analysis are done using data collection modules with large sample sizes. The stage includes obtaining market information or related data through various sources and strategies. It includes examining and planning all the data acquired from the past in advance. It likewise envelops the examination of information inconsistencies seen across different information sources. The market data is analysed and estimated using market statistical and coherent models. Also, market share analysis and key trend analysis are the major success factors in the market report. To know more, please request an analyst call or drop down your inquiry.
The key research methodology used by DBMR research team is data triangulation which involves data mining, analysis of the impact of data variables on the market and primary (industry expert) validation. Data models include Vendor Positioning Grid, Market Time Line Analysis, Market Overview and Guide, Company Positioning Grid, Patent Analysis, Pricing Analysis, Company Market Share Analysis, Standards of Measurement, Global versus Regional and Vendor Share Analysis. To know more about the research methodology, drop in an inquiry to speak to our industry experts.
Data Bridge Market Research is a leader in advanced formative research. We take pride in servicing our existing and new customers with data and analysis that match and suits their goal. The report can be customized to include price trend analysis of target brands understanding the market for additional countries (ask for the list of countries), clinical trial results data, literature review, refurbished market and product base analysis. Market analysis of target competitors can be analyzed from technology-based analysis to market portfolio strategies. We can add as many competitors that you require data about in the format and data style you are looking for. Our team of analysts can also provide you data in crude raw excel files pivot tables (Fact book) or can assist you in creating presentations from the data sets available in the report.


