
Middle East And Africa Multiple Hereditary Exostosis Market
Market Size in USD Million
 USD
4.80 Million
USD
6.51 Million
2024
2032
USD
4.80 Million
USD
6.51 Million
2024
2032
| 2025 - 2032 | |
| USD 4.80 Million | |
| USD 6.51 Million | |
| % | |
|
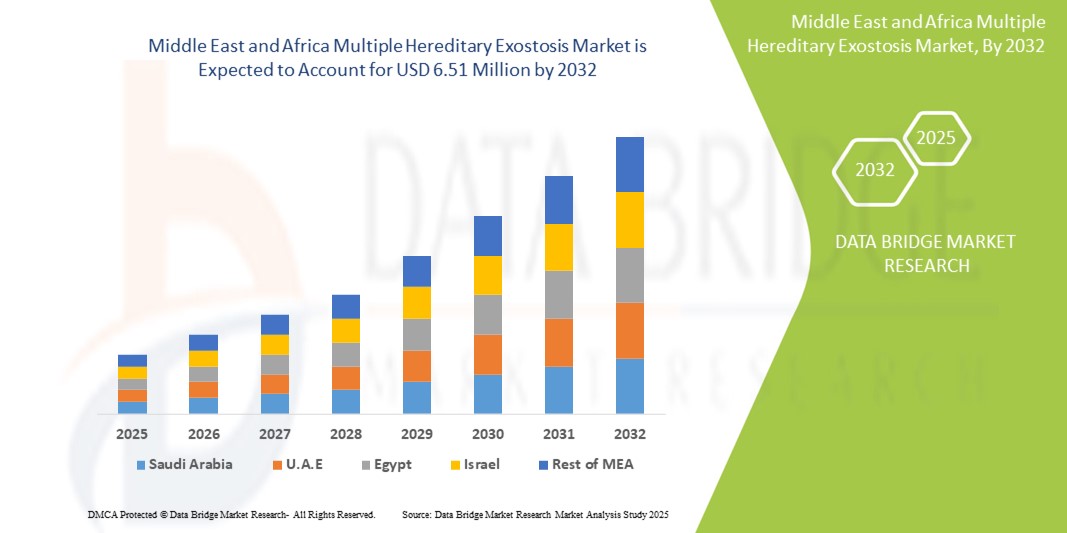
Middle East and Africa Multiple Hereditary Exostosis Market Size
- The Middle East and Africa multiple hereditary exostosis market size was valued at USD 4.80 million in 2024 and is expected to reach USD 6.51 million by 2032, at a CAGR of 3.90% during the forecast period
- The market growth is largely fueled by increased awareness of rare genetic disorders, improving diagnostic infrastructure, and gradual advancements in genetic testing technologies across the region
- Furthermore, rising support from government and non-profit organizations for rare disease research, along with growing investment in personalized and precision medicine, is creating a more favorable environment for early diagnosis and treatment of MHE. These converging factors are contributing to steady uptake of targeted therapies and genetic services, thereby driving the market’s growth trajectory across MEA
Middle East and Africa Multiple Hereditary Exostosis Market Analysis
- Multiple hereditary exostosis (MHE), a rare genetic disorder characterized by the growth of multiple benign bone tumors, is gaining increased attention in the Middle East and Africa due to improving diagnostic capabilities, growing patient advocacy, and rising focus on rare disease healthcare needs across the region
- The demand for early diagnosis and advanced treatment options for MHE is driven by increasing awareness among healthcare providers and patients, alongside expanding access to genetic counseling and imaging technologies
- South Africa dominated the Middle East and Africa multiple hereditary exostosis market with the largest revenue share of 28.9% in 2024, supported by its relatively advanced healthcare infrastructure, active research programs on genetic disorders, and the presence of specialized medical institutions catering to rare conditions
- United Arab Emirates (UAE) is expected to be the fastest-growing country in the Middle East and Africa multiple hereditary exostosis market during the forecast period due to rising government healthcare spending, increased medical tourism, and the launch of rare disease registries and precision medicine initiatives
- Sessile segment dominated the Middle East and Africa multiple hereditary exostosis market with a market share of 55.2% in 2024, driven by its higher prevalence in patients and easier detection through standard imaging techniques
Report Scope and Middle East and Africa Multiple Hereditary Exostosis Market Segmentation
|
Attributes |
Middle East and Africa Multiple Hereditary Exostosis Key Market Insights |
|
Segments Covered |
|
|
Countries Covered |
Middle East and Africa
|
|
Key Market Players |
|
|
Market Opportunities |
|
|
Value Added Data Infosets |
In addition to the insights on market scenarios such as market value, growth rate, segmentation, geographical coverage, and major players, the market reports curated by the Data Bridge Market Research also include in-depth expert analysis, pricing analysis, brand share analysis, consumer survey, demography analysis, supply chain analysis, value chain analysis, raw material/consumables overview, vendor selection criteria, PESTLE Analysis, Porter Analysis, and regulatory framework. |
Middle East and Africa Multiple Hereditary Exostosis Market Trends
“Advancements in Genetic Testing and Early Diagnosis”
- A significant and accelerating trend in the Middle East and Africa multiple hereditary exostosis (MHE) market is the growing adoption of advanced genetic testing and imaging technologies, which are enhancing early diagnosis and personalized care strategies for affected individuals across the region
- For instance, leading healthcare institutions in countries such as the UAE and South Africa are increasingly incorporating next-generation sequencing (NGS) and MRI-based monitoring into standard care practices for rare skeletal disorders such as MHE
- Genetic testing enables early identification of the EXT1 and EXT2 gene mutations responsible for MHE, facilitating timely interventions and improved clinical outcomes. Institutions in Saudi Arabia and Egypt have begun partnering with international genetic laboratories to expand accessibility to these diagnostic tools
- The availability of MRI and CT scans in tertiary care centers allows for accurate mapping of tumor growth and skeletal deformities, supporting better surgical planning and long-term monitoring
- These diagnostic advancements are contributing to a shift toward more proactive disease management, empowering healthcare providers to design individualized treatment pathways and delay or prevent functional impairments
- As awareness of MHE grows among medical professionals and patients, the demand for comprehensive diagnostic evaluations is expected to rise, further strengthening the role of precision medicine in the rare disease landscape of the MEA region
Middle East and Africa Multiple Hereditary Exostosis Market Dynamics
Driver
“Growing Awareness, Specialist Care, and Supportive Government Policies”
- The Increasing awareness of rare genetic disorders such as MHE, coupled with improving healthcare infrastructure and availability of specialist care centers, is driving market growth in the Middle East and Africa
- For instance, South Africa’s state-funded rare disease programs and genetic counseling initiatives have significantly boosted early detection and access to treatment options for patients with MHE
- Government efforts in countries such as Saudi Arabia and the UAE to invest in rare disease registries, promote genomic medicine, and improve access to orthopedic surgery and physiotherapy are creating a supportive environment for market expansion
- The rising presence of advocacy groups and medical outreach programs is also helping reduce stigma and improve patient education about the long-term effects of untreated MHE
- Increased medical tourism to specialized orthopedic centers in the Gulf region is another factor contributing to the growing demand for surgical treatments and post-operative rehabilitation services
Restraint/Challenge
“High Cost of Genetic Testing and Limited Awareness in Remote Areas”
- Despite progress, the high cost of genetic testing and specialized imaging tools continues to limit widespread access to early MHE diagnosis, particularly in low-income and rural areas
- Many countries in Sub-Saharan Africa still face significant gaps in diagnostic infrastructure, with limited availability of CT or MRI machines, and a shortage of trained genetic counselors or orthopedic specialists
- The rarity of the condition and lack of national awareness campaigns in some regions often result in delayed diagnosis, misdiagnosis, or inadequate long-term care, leading to worsened patient outcomes
- Out-of-pocket expenses for surgeries and follow-up care can be substantial, especially in systems with limited insurance coverage or government support for rare diseases
- Overcoming these challenges will require cross-sector collaborations, increased public-private funding for rare disease programs, and expanded training for healthcare professionals in the identification and management of genetic skeletal disorders such as MHE
Middle East and Africa Multiple Hereditary Exostosis Market Scope
The market is segmented on the basis of type, treatment, diagnosis, site, age group, and end user.
- By Type
On the basis of type, the Middle East and Africa multiple hereditary exostosis market is segmented into sessile and pedunculated. The sessile segment dominated the market with the largest revenue share of 55.2% in 2024, driven by its higher prevalence in MHE cases and more straightforward identification through diagnostic imaging such as X-rays and MRIs. Sessile osteochondromas, due to their broader base and greater potential for complications such as nerve compression or deformity, often require closer monitoring and intervention. This has increased diagnostic and treatment demand related to this subtype.
The pedunculated segment is expected to witness the fastest CAGR from 2025 to 2032, as improved imaging accessibility allows for better identification and differentiation of bone lesion types, especially in specialized clinics and urban hospitals.
- By Treatment
On the basis of treatment, the Middle East and Africa multiple hereditary exostosis market is segmented into surgery, medication, and others. The surgery segment accounted for the highest market share in 2024, driven by the fact that surgical removal remains the primary treatment for symptomatic osteochondromas, especially those causing pain, deformity, or impaired function. Growing orthopedic specialization in regional hospitals and medical tourism to countries such as UAE and South Africa also support this segment.
The medication segment is expected to witness the fastest CAGR from 2025 to 2032, primarily used for pain management or inflammation control, though it remains supportive rather than curative. Innovations in gene-targeted therapy and supportive pharmaceutical care could contribute to long-term growth in this segment.
- By Diagnosis
On the basis of diagnosis, the Middle East and Africa multiple hereditary exostosis market is segmented into X-ray, Computed Tomography (CT) scan, Magnetic Resonance Imaging (MRI), genetic tests, and others. The X-ray segment leads the market due to its widespread availability and cost-effectiveness in detecting bony outgrowths associated with MHE. It is often the first-line diagnostic tool in both public and private healthcare facilities.
MRI is anticipated to register the fastest growth rate through 2032, as it offers more detailed visualization of cartilage caps and soft tissue involvement, which are crucial for surgical planning. Increasing investment in advanced diagnostic infrastructure across urban centers in Saudi Arabia, UAE, and Egypt supports this trend.
- By Site
On the basis of site, the Middle East and Africa multiple hereditary exostosis market is segmented into legs, arms, shoulders, pelvis, fingers, and toes. The legs segment held the largest share in 2024, as lower limb deformities are the most frequently reported in MHE patients, often leading to gait disturbances and orthopedic intervention. The focus on correcting leg-length discrepancies and angular deformities has driven the demand for early diagnosis and corrective surgery.
The arms and shoulders segments is expected to witness the fastest CAGR from 2025 to 2032, particularly in pediatric patients, where growth-related complications are common.
- By Age Group
On the basis of age group, the Middle East and Africa multiple hereditary exostosis market is segmented into pediatric and adult. The pediatric segment dominated the market in 2024, as MHE is a genetic disorder that often manifests in early childhood, with visible symptoms appearing before adolescence. Pediatric patients frequently require long-term monitoring and multiple interventions over their growth period, resulting in higher demand for diagnostic and treatment services in this group.
The adult segment is expected to witness the fastest CAGR from 2025 to 2032, due to increasing diagnosis of late-presenting or previously undiagnosed cases, as well as continued monitoring of childhood MHE survivors.
- By End User
On the basis of end user, the Middle East and Africa multiple hereditary exostosis market is segmented into hospitals, specialty clinics, ambulatory surgical centers, and others. The hospital segment led the market with the largest share in 2024, as most surgical interventions and advanced diagnostic services are centralized in hospital settings with multidisciplinary expertise.
Specialty clinics are expected to witness the fastest growth during the forecast period, supported by the rising number of orthopedic and genetic clinics focused on rare disorders in urban hubs across Saudi Arabia, UAE, and South Africa. These clinics offer specialized, patient-centric care with faster diagnosis and access to surgical expertise
Middle East and Africa Multiple Hereditary Exostosis Market Regional Analysis
- South Africa dominated the Middle East and Africa multiple hereditary exostosis market with the largest revenue share of 28.9% in 2024, supported by its relatively advanced healthcare infrastructure, active research programs on genetic disorders, and the presence of specialized medical institutions catering to rare conditions
- The country’s healthcare system prioritizes early diagnosis and personalized care, with growing access to MRI, genetic testing, and specialized orthopedic treatment, especially in leading urban hospitals and research centers
- This regional leadership is further reinforced by national health strategies promoting rare disease awareness, expanding patient registries, and enhancing collaboration between local institutions and international research bodies, establishing Saudi Arabia as a key hub for MHE diagnosis and treatment across the MEA region
The Saudi Arabia Multiple Hereditary Exostosis Market Insight
The Saudi Arabia multiple hereditary exostosis market captured the largest revenue share in the region in 2024, driven by strong government investment in genomic medicine, specialized orthopedic care, and rare disease research. The launch of national-level genetic screening programs and access to advanced diagnostics such as MRI and CT scanning have significantly strengthened early MHE identification and treatment. In addition, partnerships between Saudi healthcare institutions and international research organizations are enhancing clinical outcomes and encouraging innovation in rare disease management.
United Arab Emirates (UAE) Multiple Hereditary Exostosis Market Insight
The UAE multiple hereditary exostosis market is projected to grow at a substantial CAGR during the forecast period, fueled by advancements in medical tourism, increased awareness of genetic conditions, and high per capita healthcare spending. The availability of world-class specialty clinics and early access to surgical care make the UAE a hub for MHE treatment in the Gulf region. Government-led precision medicine programs and increased public education on rare diseases further support the market’s upward trajectory.
South Africa Multiple Hereditary Exostosis Market Insight
The South Africa multiple hereditary exostosis market is expanding steadily due to a growing focus on rare disease diagnosis and increased access to public healthcare services. The country's integration of genetic counseling and imaging diagnostics in tertiary hospitals has improved detection rates. While challenges persist in rural areas, urban centers are seeing rising demand for pediatric orthopedic care, which is essential for managing MHE. Collaborations with international organizations are also helping to improve rare disease research capacity in South Africa.
Egypt Multiple Hereditary Exostosis Market Insight
The Egypt multiple hereditary exostosis market is gaining traction, driven by the country’s strategic focus on healthcare reform and rare disease inclusion in national policy frameworks. Academic medical centers are increasingly equipped with diagnostic technologies such as genetic testing and MRIs, enabling better patient identification. Public health initiatives and physician training programs are gradually raising awareness, while partnerships with NGOs and regional research bodies are helping to bridge care gaps in underserved populations.
Middle East and Africa Multiple Hereditary Exostosis Market Share
The Middle East and Africa multiple hereditary exostosis industry is primarily led by well-established companies, including:
- Illumina, Inc. (U.S.)
- Medtronic (Ireland)
- Zimmer Biomet Holdings, Inc. (U.S.)
- Stryker (U.S.)
- Siemens Healthineers AG (Germany)
- GE HealthCare Technologies Inc. (U.S.)
- Canon Medical Systems Corporation (Japan)
- Esaote S.p.A. (Italy)
- Thermo Fisher Scientific Inc. (U.S.)
- Roche Holding AG (Switzerland)
- Koninklijke Philips N.V. (Netherlands)
- B. Braun Melsungen AG (Germany)
- Agilent Technologies, Inc. (U.S.)
- PerkinElmer Inc. (U.S.)
- FUJIFILM Corporation (Japan)
- Beijing Genomics Institute (BGI Genomics) (China)
- Shenzhen Mindray Bio-Medical Electronics Co., Ltd. (China)
- Jiangsu Trautec Medical Technology Co., Ltd. (China)
- Toshiba Corporation (Japan)
- Takara Bio Inc. (Japan)
What are the Recent Developments in Middle East and Africa Multiple Hereditary Exostosis Market?
- In May 2024, King Faisal Specialist Hospital and Research Centre (Saudi Arabia) launched a dedicated Rare Bone Disease Clinic, focusing on conditions such as multiple hereditary exostosis. The initiative aims to offer integrated care through genetic counseling, orthopedic intervention, and long-term follow-up, reflecting Saudi Arabia’s growing emphasis on rare disease specialization and early diagnosis in pediatric populations
- In April 2024, Mediclinic Middle East (UAE) entered into a collaboration with an international genomics laboratory to improve access to EXT1 and EXT2 gene mutation testing, streamlining early and accurate diagnosis of MHE. This partnership enhances the capacity of local clinics to deliver precision medicine and underscores the region's push toward personalized healthcare
- In March 2024, Groote Schuur Hospital (South Africa) launched a pilot program integrating MRI-based cartilage cap monitoring for pediatric MHE patients. This initiative is expected to improve surgical planning and long-term orthopedic outcomes, marking a shift toward more proactive and data-driven MHE care in the public health sector
- In February 2024, the Egyptian Ministry of Health rolled out a nationwide awareness campaign on genetic skeletal disorders, including MHE, across public hospitals and pediatric clinics. The campaign focuses on early symptom recognition and referral protocols, aiming to reduce diagnostic delays and improve patient outcomes in underserved regions
- In January 2024, CureRare Africa, a non-profit alliance supporting rare disease management, launched its MHE Registry Pilot in Kenya and Nigeria to track prevalence, treatment pathways, and patient outcomes. This data-driven approach supports clinical research and advocacy efforts, helping bridge care gaps across the continent and fostering collaboration between healthcare providers, researchers, and policymakers
SKU-

- Interactive Data Analysis Dashboard
- Company Analysis Dashboard for high growth potential opportunities
- Research Analyst Access for customization & queries
- Competitor Analysis with Interactive dashboard
- Latest News, Updates & Trend analysis
- Harness the Power of Benchmark Analysis for Comprehensive Competitor Tracking
Table of Content
1 INTRODUCTION
1.1 OBJECTIVES OF THE STUDY
1.2 MARKET DEFINITION
1.3 OVERVIEW OF THE MIDDLE EAST AND AFRICA MULTIPLE HEREDITARY EXOSTOSIS MARKET
1.4 CURRENCY AND PRICING
1.5 LIMITATIONS
1.6 MARKETS COVERED
2 MARKET SEGMENTATION
2.1 MARKETS COVERED
2.2 GEOGRAPHICAL SCOPE
2.3 YEARS CONSIDERED FOR THE STUDY
2.4 DBMR TRIPOD DATA VALIDATION MODEL
2.5 PRIMARY INTERVIEWS WITH KEY OPINION LEADERS
2.6 MULTIVARIATE MODELLING
2.7 MARKET END USER COVERAGE GRID
2.8 PRODUCT LIFELINE CURVE
2.9 DBMR MARKET POSITION GRID
2.1 VENDOR SHARE ANALYSIS
2.11 SECONDARY SOURCES
2.12 ASSUMPTIONS
3 EXECUTIVE SUMMARY
4 PREMIUM INSIGHTS
4.1 PORTER’S FIVE FORCES
4.2 PESTEL ANALYSIS
4.3 PIPELINE ANALYSIS - OBSERVATORY DATA
4.4 EPIDEMIOLOGY
5 MIDDLE EAST AND AFRICA MULTIPLE HEREDITARY EXOSTOSIS MARKET: REGULATIONS
5.1 REGULATION IN UNITED STATES: U.S. FOOD AND DRUG ADMINISTRATION (FDA)
5.1.1 REGULATION IN EUROPE: EUROPEAN MEDICINES AGENCY (EMA)
5.2 REGULATION IN ASIA-PACIFIC (JAPAN): PHARMACEUTICAL AND MEDICAL DEVICES AGENCY (PMDA)
5.3 MEDICAL DEVICE STANDARDS
6 MARKET OVERVIEW
6.1 DRIVERS
6.1.1 RISING PREVALENCE OF GENETIC DISORDERS
6.1.2 GROWING PEDIATRIC POPULATION
6.1.3 DEVELOPMENT OF NOVEL THERAPIES
6.2 RESTRAINTS
6.2.1 HIGH COST OF ADVANCED THERAPIES
6.2.2 LIMITED AVAILABILITY OF THERAPIES
6.3 OPPORTUNITIES
6.3.1 INCREASE IN PATIENT CARE AND SUPPORT SYSTEMS
6.3.2 INCREASE IN THE NUMBER OF COLLABORATIONS AND PARTNERSHIPS
6.4 CHALLENGES
6.4.1 LIMITED AWARENESS ABOUT THE DISORDER
6.4.2 LACK OF DRUG APPROVALS ASSOCIATED WITH THE DISORDER
7 MIDDLE EAST AND AFRICA MULTIPLE HEREDITARY EXOSTOSIS MARKET, BY TYPE
7.1 OVERVIEW
7.2 SESSILE
7.3 PEDUNCULATED
8 MIDDLE EAST AND AFRICA MULTIPLE HEREDITARY EXOSTOSIS MARKET, BY TREATMENT
8.1 OVERVIEW
8.2 SURGERY
8.2.1 REMOVE THE TUMOR
8.2.2 LENGTHEN LIMBS
8.3 MEDICATION
8.3.1 HOSPITAL PHARMACIES
8.3.2 DRUGS STORES AND RETAIL PHARMACIES
8.3.3 ONLINE PHARMACIES
8.4 OTHERS
9 MIDDLE EAST AND AFRICA MULTIPLE HEREDITARY EXOSTOSIS MARKET, BY DIAGNOSIS
9.1 OVERVIEW
9.2 X-RAY
9.2.1 SESSILE
9.2.2 PEDUNCULATED
9.3 COMPUTED TOMOGRAPHY (CT) SCAN
9.3.1 SESSILE
9.3.2 PEDUNCULATED
9.4 MAGNETIC RESONANCE IMAGING (MRI)
9.4.1 SESSILE
9.4.2 PEDUNCULATED
9.5 GENETIC TESTS
9.5.1 SESSILE
9.5.2 PEDUNCULATED
9.6 OTHERS
9.6.1 SESSILE
9.6.2 PEDUNCULATED
10 MIDDLE EAST AND AFRICA MULTIPLE HEREDITARY EXOSTOSIS MARKET, BY SITE
10.1 OVERVIEW
10.2 LEGS
10.3 ARMS
10.4 SHOULDERS
10.5 PELVIS
10.6 FINGERS
10.7 TOES
11 MIDDLE EAST AND AFRICA MULTIPLE HEREDITARY EXOSTOSIS MARKET, BY AGE GROUP
11.1 OVERVIEW
11.2 PEDIATRIC
11.3 ADULT
12 MIDDLE EAST AND AFRICA MULTIPLE HEREDITARY EXOSTOSIS MARKET, BY END USER
12.1 OVERVIEW
12.2 HOSPITAL
12.2.1 PRIVATE
12.2.2 GOVERNMENT
12.3 SPECIALTY CLINICS
12.4 AMBULATORY SURGICAL CENTERS
12.5 OTHERS
13 MIDDLE EAST AND AFRICA MULTIPLE HEREDITY EXOSTOSIS MARKET, BY REGION
13.1 MIDDLE EAST AND AFRICA
13.1.1 SAUDI ARABIA
13.1.2 U.A.E.
13.1.3 EGYPT
13.1.4 KUWAIT
13.1.5 QATAR
13.1.6 OMAN
13.1.7 BAHRAIN
13.1.8 REST OF MIDDLE EAST AND AFRICA
14 MIDDLE EAST AND AFRICA MULTIPLE HEREDITARY EXOSTOSIS MARKET: COMPANY LANDSCAPE
14.1 COMPANY SHARE ANALYSIS: MIDDLE EAST AND AFRICA
15 SWOT ANALYSIS
16 COMPANY PROFILES
16.1 BAYERS AG
16.1.1 COMPANY SNAPSHOT
16.1.2 REVENUE ANALYSIS
16.1.3 COMPANY SHARE ANALYSIS
16.1.4 PRODUCT PORTFOLIO
16.1.5 RECENT UPDATES
16.2 HALEON GROUP OF COMPANIES
16.2.1 COMPANY SNAPSHOT
16.2.2 REVENUE ANALYSIS
16.2.3 COMPANY SHARE ANALYSIS
16.2.4 PRODUCT PORTFOLIO
16.2.5 RECENT DEVELOPMENTS
16.3 BASF
16.3.1 COMPANY SNAPSHOT
16.3.2 REVENUE ANALYSIS
16.3.3 COMPANY SHARE ANALYSIS
16.3.4 PRODUCT PORTFOLIO
16.3.5 RECENT UPDATES
16.4 VIATRIS INC.
16.4.1 COMPANY SNAPSHOT
16.4.2 REVENUE ANALYSIS
16.4.3 COMPANY SHARE ANALYSIS
16.4.4 PRODUCT PORTFOLIO
16.4.5 RECENT UPDATES
16.5 ACTIZAPHARMA
16.5.1 COMPANY SNAPSHOT
16.5.2 PRODUCT PORTFOLIO
16.5.3 RECENT UPDATES
16.6 ADVACARE PHARMA
16.6.1 COMPANY SNAPSHOT
16.6.2 PRODUCT PORTFOLIO
16.6.3 RECENT UPDATES
16.7 AUROBINDO PHARMA
16.7.1 COMPANY SNAPSHOT
16.7.2 REVENUE ANALYSIS
16.7.3 PRODUCT PORTFOLIO
16.7.4 RECENT TABLETS
16.8 HALEON GROUP OF COMPANIES
16.8.1 COMPANY SNAPSHOT
16.8.2 REVENUE ANALYSIS
16.8.3 PRODUCT PORTFOLIO
16.8.4 RECENT UPDATES
16.9 IPSEN BIOPHARMACEUTICALS, INC.
16.9.1 COMPANY SNAPSHOT
16.9.2 REVENUE ANALYSIS
16.9.3 PRODUCT PORTFOLIO
16.9.4 RECENT UPDATES
16.1 MALLINCKRODT
16.10.1 COMPANY SNAPSHOT
16.10.2 REVENUE ANALYSIS
16.10.3 PRODUCT PORTFOLIO
16.10.4 RECENT UPDATES
16.11 TEVA PHARMACEUTICAL INDUSTRIES LTD.
16.11.1 COMPANY SNAPSHOT
16.11.2 REVENUE ANALYSIS
16.11.3 PRODUCT PORTFOLIO
16.11.4 RECENT UPDATES
16.12 TAJ PHARMACEUTICALS LIMITED
16.12.1 COMPANY SNAPSHOT
16.12.2 PRODUCT PORTFOLIO
16.12.3 RECENT UPDATES
17 QUESTIONNAIRE
18 RELATED REPORTS
List of Table
TABLE 1 PIPELINE ANALYSIS - OBSERVATORY DATA
TABLE 2 PIPELINE ANALYSIS - INTERVENTIONAL DATA
TABLE 3 SALES DATA - 2024
TABLE 4 SALES DATA - 2023
TABLE 5 SALES DATA - 2022
TABLE 6 SALES DATA - 2021
TABLE 7 SALES DATA - 2020
TABLE 8 SALES DATA - 2019
TABLE 9 SALES DATA - 2018
TABLE 10 COST OF PALOVAROTENE
TABLE 11 MIDDLE EAST AND AFRICA MULTIPLE HEREDITARY EXOSTOSIS MARKET, BY TYPE, 2022-2031 (USD THOUSAND)
TABLE 12 MIDDLE EAST AND AFRICA SESSILE IN MULTIPLE HEREDITARY EXOSTOSIS MARKET, BY REGION, 2022-2031 (USD THOUSAND)
TABLE 13 MIDDLE EAST AND AFRICA PEDUNCULATED IN MULTIPLE HEREDITARY EXOSTOSIS MARKET, BY REGION, 2022-2031 (USD THOUSAND)
TABLE 14 MIDDLE EAST AND AFRICA MULTIPLE HEREDITARY EXOSTOSIS MARKET, BY TREATMENT, 2022-2031 (USD THOUSAND)
TABLE 15 MIDDLE EAST AND AFRICA SURGERY IN MULTIPLE HEREDITARY EXOSTOSIS MARKET, BY REGION, 2022-2031 (USD THOUSAND)
TABLE 16 MIDDLE EAST AND AFRICA SURGERY IN MULTIPLE HEREDITARY EXOSTOSIS MARKET, BY TYPE, 2022-2031 (USD THOUSAND)
TABLE 17 MIDDLE EAST AND AFRICA MEDICATION IN MULTIPLE HEREDITARY EXOSTOSIS MARKET, BY REGION, 2022-2031 (USD THOUSAND)
TABLE 18 MIDDLE EAST AND AFRICA MEDICATION IN MULTIPLE HEREDITARY EXOSTOSIS MARKET, BY DISTRIBUTION CHANNEL, 2022-2031 (USD THOUSAND)
TABLE 19 MIDDLE EAST AND AFRICA MEDICATION IN MULTIPLE HEREDITARY EXOSTOSIS MARKET, BY REGION, 2022-2031 (USD THOUSAND)
TABLE 20 MIDDLE EAST AND AFRICA MULTIPLE HEREDITARY EXOSTOSIS MARKET, BY DIAGNOSIS, 2022-2031 (USD THOUSAND)
TABLE 21 MIDDLE EAST AND AFRICA X-RAY IN MULTIPLE HEREDITARY EXOSTOSIS MARKET, BY REGION, 2022-2031 (USD THOUSAND)
TABLE 22 MIDDLE EAST AND AFRICA X-RAY IN MULTIPLE HEREDITARY EXOSTOSIS MARKET, BY TYPE, 2022-2031 (USD THOUSAND)
TABLE 23 MIDDLE EAST AND AFRICA COMPUTED TOMOGRAPHY (CT) SCAN IN MULTIPLE HEREDITARY EXOSTOSIS MARKET, BY REGION, 2022-2031 (USD THOUSAND)
TABLE 24 MIDDLE EAST AND AFRICA COMPUTED TOMOGRAPHY (CT) SCAN IN MULTIPLE HEREDITARY EXOSTOSIS MARKET, BY TYPE, 2022-2031 (USD THOUSAND)
TABLE 25 MIDDLE EAST AND AFRICA MAGNETIC RESONANCE IMAGING (MRI) IN MULTIPLE HEREDITARY EXOSTOSIS MARKET, BY REGION, 2022-2031 (USD THOUSAND)
TABLE 26 MIDDLE EAST AND AFRICA MAGNETIC RESONANCE IMAGING (MRI) IN MULTIPLE HEREDITARY EXOSTOSIS MARKET, BY TYPE, 2022-2031 (USD THOUSAND)
TABLE 27 MIDDLE EAST AND AFRICA GENETIC TESTS IN MULTIPLE HEREDITARY EXOSTOSIS MARKET, BY REGION, 2022-2031 (USD THOUSAND)
TABLE 28 MIDDLE EAST AND AFRICA GENETIC TESTS IN MULTIPLE HEREDITARY EXOSTOSIS MARKET, BY TYPE, 2022-2031 (USD THOUSAND)
TABLE 29 MIDDLE EAST AND AFRICA OTHERS IN MULTIPLE HEREDITARY EXOSTOSIS MARKET, BY REGION, 2022-2031 (USD THOUSAND)
TABLE 30 MIDDLE EAST AND AFRICA OTHERS IN MULTIPLE HEREDITARY EXOSTOSIS MARKET, BY TYPE, 2022-2031 (USD THOUSAND)
TABLE 31 MIDDLE EAST AND AFRICA MULTIPLE HEREDITARY EXOSTOSIS MARKET, BY SITE, 2022-2031 (USD THOUSAND)
TABLE 32 MIDDLE EAST AND AFRICA LEGS IN MULTIPLE HEREDITARY EXOSTOSIS MARKET, BY REGION, 2022-2031 (USD THOUSAND)
TABLE 33 MIDDLE EAST AND AFRICA ARMS IN MULTIPLE HEREDITARY EXOSTOSIS MARKET, BY REGION, 2022-2031 (USD THOUSAND)
TABLE 34 MIDDLE EAST AND AFRICA SHOULDERS IN MULTIPLE HEREDITARY EXOSTOSIS MARKET, BY REGION, 2022-2031 (USD THOUSAND)
TABLE 35 MIDDLE EAST AND AFRICA PELVIS IN MULTIPLE HEREDITARY EXOSTOSIS MARKET, BY REGION, 2022-2031 (USD THOUSAND)
TABLE 36 MIDDLE EAST AND AFRICA FINGERS IN MULTIPLE HEREDITARY EXOSTOSIS MARKET, BY REGION, 2022-2031 (USD THOUSAND)
TABLE 37 MIDDLE EAST AND AFRICA TOES IN MULTIPLE HEREDITARY EXOSTOSIS MARKET, BY REGION, 2022-2031 (USD THOUSAND)
TABLE 38 MIDDLE EAST AND AFRICA MULTIPLE HEREDITARY EXOSTOSIS MARKET, BY AGE GROUP, 2022-2031 (USD THOUSAND)
TABLE 39 MIDDLE EAST AND AFRICA PEDIATRIC IN MULTIPLE HEREDITARY EXOSTOSIS MARKET, BY REGION, 2022-2031 (USD THOUSAND)
TABLE 40 MIDDLE EAST AND AFRICA ADULT IN MULTIPLE HEREDITARY EXOSTOSIS MARKET, BY REGION, 2022-2031 (USD THOUSAND)
TABLE 41 MIDDLE EAST AND AFRICA MULTIPLE HEREDITARY EXOSTOSIS MARKET, BY END USER, 2022-2031 (USD THOUSAND)
TABLE 42 MIDDLE EAST AND AFRICA HOSPITAL IN MULTIPLE HEREDITARY EXOSTOSIS MARKET, BY REGION, 2022-2031 (USD THOUSAND)
TABLE 43 MIDDLE EAST AND AFRICA HOSPITAL IN MULTIPLE HEREDITARY EXOSTOSIS MARKET, BY TYPE, 2022-2031 (USD THOUSAND)
TABLE 44 MIDDLE EAST AND AFRICA SPECIALTY CLINICS IN MULTIPLE HEREDITARY EXOSTOSIS MARKET, BY REGION, 2022-2031 (USD THOUSAND)
TABLE 45 MIDDLE EAST AND AFRICA AMBULATORY SURGICAL CENTERS IN MULTIPLE HEREDITARY EXOSTOSIS MARKET, BY REGION, 2022-2031 (USD THOUSAND)
TABLE 46 MIDDLE EAST AND AFRICA OTHERS IN MULTIPLE HEREDITARY EXOSTOSIS MARKET, BY REGION, 2022-2031 (USD THOUSAND)
TABLE 47 MIDDLE EAST AND AFRICA MULTIPLE HEREDITARY EXOSTOSIS MARKET, BY COUNTRY, 2022-2031 (USD THOUSAND)
TABLE 48 MIDDLE EAST AND AFRICA MULTIPLE HEREDITARY EXOSTOSIS MARKET, BY TYPE, 2022-2031 (USD THOUSAND)
TABLE 49 MIDDLE EAST AND AFRICA MULTIPLE HEREDITARY EXOSTOSIS MARKET, BY TREATMENT, 2022-2031 (USD THOUSAND)
TABLE 50 MIDDLE EAST AND AFRICA SURGERY IN MULTIPLE HEREDITARY EXOSTOSIS MARKET, BY TYPE, 2022-2031 (USD THOUSAND)
TABLE 51 MIDDLE EAST AND AFRICA MEDICATION IN MULTIPLE HEREDITARY EXOSTOSIS MARKET, BY DISTRIBUTION CHANNEL, 2022-2031 (USD THOUSAND)
TABLE 52 MIDDLE EAST AND AFRICA MULTIPLE HEREDITARY EXOSTOSIS MARKET, BY DIAGNOSIS, 2022-2031 (USD THOUSAND)
TABLE 53 MIDDLE EAST AND AFRICA X-RAY IN MULTIPLE HEREDITARY EXOSTOSIS MARKET, BY TYPE, 2022-2031 (USD THOUSAND)
TABLE 54 MIDDLE EAST AND AFRICA COMPUTED TOMOGRAPHY (CT) SCAN IN MULTIPLE HEREDITARY EXOSTOSIS MARKET, BY TYPE, 2022-2031 (USD THOUSAND)
TABLE 55 MIDDLE EAST AND AFRICA MAGNETIC RESONANCE IMAGING (MRI) IN MULTIPLE HEREDITARY EXOSTOSIS MARKET, BY TYPE, 2022-2031 (USD THOUSAND)
TABLE 56 MIDDLE EAST AND AFRICA GENETIC TESTS IN MULTIPLE HEREDITARY EXOSTOSIS MARKET, BY TYPE, 2022-2031 (USD THOUSAND)
TABLE 57 MIDDLE EAST AND AFRICA OTHERS IN MULTIPLE HEREDITARY EXOSTOSIS MARKET, BY TYPE, 2022-2031 (USD THOUSAND)
TABLE 58 MIDDLE EAST AND AFRICA MULTIPLE HEREDITARY EXOSTOSIS MARKET, BY SITE, 2022-2031 (USD THOUSAND)
TABLE 59 MIDDLE EAST AND AFRICA MULTIPLE HEREDITARY EXOSTOSIS MARKET, BY AGE GROUP, 2022-2031 (USD THOUSAND)
TABLE 60 MIDDLE EAST AND AFRICA MULTIPLE HEREDITARY EXOSTOSIS MARKET, BY END USER, 2022-2031 (USD THOUSAND)
TABLE 61 MIDDLE EAST AND AFRICA HOSPITAL IN MULTIPLE HEREDITARY EXOSTOSIS MARKET, BY TYPE, 2022-2031 (USD THOUSAND)
TABLE 62 SAUDI ARABIA MULTIPLE HEREDITARY EXOSTOSIS MARKET, BY TYPE, 2022-2031 (USD THOUSAND)
TABLE 63 SAUDI ARABIA MULTIPLE HEREDITARY EXOSTOSIS MARKET, BY TREATMENT, 2022-2031 (USD THOUSAND)
TABLE 64 SAUDI ARABIA SURGERY IN MULTIPLE HEREDITARY EXOSTOSIS MARKET, BY TYPE, 2022-2031 (USD THOUSAND)
TABLE 65 SAUDI ARABIA MEDICATION IN MULTIPLE HEREDITARY EXOSTOSIS MARKET, BY DISTRIBUTION CHANNEL, 2022-2031 (USD THOUSAND)
TABLE 66 SAUDI ARABIA MULTIPLE HEREDITARY EXOSTOSIS MARKET, BY DIAGNOSIS, 2022-2031 (USD THOUSAND)
TABLE 67 SAUDI ARABIA X-RAY IN MULTIPLE HEREDITARY EXOSTOSIS MARKET, BY TYPE, 2022-2031 (USD THOUSAND)
TABLE 68 SAUDI ARABIA COMPUTED TOMOGRAPHY (CT) SCAN IN MULTIPLE HEREDITARY EXOSTOSIS MARKET, BY TYPE, 2022-2031 (USD THOUSAND)
TABLE 69 SAUDI ARABIA MAGNETIC RESONANCE IMAGING (MRI) IN MULTIPLE HEREDITARY EXOSTOSIS MARKET, BY TYPE, 2022-2031 (USD THOUSAND)
TABLE 70 SAUDI ARABIA GENETIC TESTS IN MULTIPLE HEREDITARY EXOSTOSIS MARKET, BY TYPE, 2022-2031 (USD THOUSAND)
TABLE 71 SAUDI ARABIA OTHERS IN MULTIPLE HEREDITARY EXOSTOSIS MARKET, BY TYPE, 2022-2031 (USD THOUSAND)
TABLE 72 SAUDI ARABIA MULTIPLE HEREDITARY EXOSTOSIS MARKET, BY SITE, 2022-2031 (USD THOUSAND)
TABLE 73 SAUDI ARABIA MULTIPLE HEREDITARY EXOSTOSIS MARKET, BY AGE GROUP, 2022-2031 (USD THOUSAND)
TABLE 74 SAUDI ARABIA MULTIPLE HEREDITARY EXOSTOSIS MARKET, BY END USER, 2022-2031 (USD THOUSAND)
TABLE 75 SAUDI ARABIA HOSPITAL IN MULTIPLE HEREDITARY EXOSTOSIS MARKET, BY TYPE, 2022-2031 (USD THOUSAND)
TABLE 76 SOUTH AFRICA MULTIPLE HEREDITARY EXOSTOSIS MARKET, BY TYPE, 2022-2031 (USD THOUSAND)
TABLE 77 SOUTH AFRICA MULTIPLE HEREDITARY EXOSTOSIS MARKET, BY TREATMENT, 2022-2031 (USD THOUSAND)
TABLE 78 SOUTH AFRICA SURGERY IN MULTIPLE HEREDITARY EXOSTOSIS MARKET, BY TYPE, 2022-2031 (USD THOUSAND)
TABLE 79 SOUTH AFRICA MEDICATION IN MULTIPLE HEREDITARY EXOSTOSIS MARKET, BY DISTRIBUTION CHANNEL, 2022-2031 (USD THOUSAND)
TABLE 80 SOUTH AFRICA MULTIPLE HEREDITARY EXOSTOSIS MARKET, BY DIAGNOSIS, 2022-2031 (USD THOUSAND)
TABLE 81 SOUTH AFRICA X-RAY IN MULTIPLE HEREDITARY EXOSTOSIS MARKET, BY TYPE, 2022-2031 (USD THOUSAND)
TABLE 82 SOUTH AFRICA COMPUTED TOMOGRAPHY (CT) SCAN IN MULTIPLE HEREDITARY EXOSTOSIS MARKET, BY TYPE, 2022-2031 (USD THOUSAND)
TABLE 83 SOUTH AFRICA MAGNETIC RESONANCE IMAGING (MRI) IN MULTIPLE HEREDITARY EXOSTOSIS MARKET, BY TYPE, 2022-2031 (USD THOUSAND)
TABLE 84 SOUTH AFRICA GENETIC TESTS IN MULTIPLE HEREDITARY EXOSTOSIS MARKET, BY TYPE, 2022-2031 (USD THOUSAND)
TABLE 85 SOUTH AFRICA OTHERS IN MULTIPLE HEREDITARY EXOSTOSIS MARKET, BY TYPE, 2022-2031 (USD THOUSAND)
TABLE 86 SOUTH AFRICA MULTIPLE HEREDITARY EXOSTOSIS MARKET, BY SITE, 2022-2031 (USD THOUSAND)
TABLE 87 SOUTH AFRICA MULTIPLE HEREDITARY EXOSTOSIS MARKET, BY AGE GROUP, 2022-2031 (USD THOUSAND)
TABLE 88 SOUTH AFRICA MULTIPLE HEREDITARY EXOSTOSIS MARKET, BY END USER, 2022-2031 (USD THOUSAND)
TABLE 89 SOUTH AFRICA HOSPITAL IN MULTIPLE HEREDITARY EXOSTOSIS MARKET, BY TYPE, 2022-2031 (USD THOUSAND)
TABLE 90 U.A.E. MULTIPLE HEREDITARY EXOSTOSIS MARKET, BY TYPE, 2022-2031 (USD THOUSAND)
TABLE 91 U.A.E. MULTIPLE HEREDITARY EXOSTOSIS MARKET, BY TREATMENT, 2022-2031 (USD THOUSAND)
TABLE 92 U.A.E. SURGERY IN MULTIPLE HEREDITARY EXOSTOSIS MARKET, BY TYPE, 2022-2031 (USD THOUSAND)
TABLE 93 U.A.E. MEDICATION IN MULTIPLE HEREDITARY EXOSTOSIS MARKET, BY DISTRIBUTION CHANNEL, 2022-2031 (USD THOUSAND)
TABLE 94 U.A.E. MULTIPLE HEREDITARY EXOSTOSIS MARKET, BY DIAGNOSIS, 2022-2031 (USD THOUSAND)
TABLE 95 U.A.E. X-RAY IN MULTIPLE HEREDITARY EXOSTOSIS MARKET, BY TYPE, 2022-2031 (USD THOUSAND)
TABLE 96 U.A.E. COMPUTED TOMOGRAPHY (CT) SCAN IN MULTIPLE HEREDITARY EXOSTOSIS MARKET, BY TYPE, 2022-2031 (USD THOUSAND)
TABLE 97 U.A.E. MAGNETIC RESONANCE IMAGING (MRI) IN MULTIPLE HEREDITARY EXOSTOSIS MARKET, BY TYPE, 2022-2031 (USD THOUSAND)
TABLE 98 U.A.E. GENETIC TESTS IN MULTIPLE HEREDITARY EXOSTOSIS MARKET, BY TYPE, 2022-2031 (USD THOUSAND)
TABLE 99 U.A.E. OTHERS IN MULTIPLE HEREDITARY EXOSTOSIS MARKET, BY TYPE, 2022-2031 (USD THOUSAND)
TABLE 100 U.A.E. MULTIPLE HEREDITARY EXOSTOSIS MARKET, BY SITE, 2022-2031 (USD THOUSAND)
TABLE 101 U.A.E. MULTIPLE HEREDITARY EXOSTOSIS MARKET, BY AGE GROUP, 2022-2031 (USD THOUSAND)
TABLE 102 U.A.E. MULTIPLE HEREDITARY EXOSTOSIS MARKET, BY END USER, 2022-2031 (USD THOUSAND)
TABLE 103 U.A.E. HOSPITAL IN MULTIPLE HEREDITARY EXOSTOSIS MARKET, BY TYPE, 2022-2031 (USD THOUSAND)
TABLE 104 EGYPT MULTIPLE HEREDITARY EXOSTOSIS MARKET, BY TYPE, 2022-2031 (USD THOUSAND)
TABLE 105 EGYPT MULTIPLE HEREDITARY EXOSTOSIS MARKET, BY TREATMENT, 2022-2031 (USD THOUSAND)
TABLE 106 EGYPT SURGERY IN MULTIPLE HEREDITARY EXOSTOSIS MARKET, BY TYPE, 2022-2031 (USD THOUSAND)
TABLE 107 EGYPT MEDICATION IN MULTIPLE HEREDITARY EXOSTOSIS MARKET, BY DISTRIBUTION CHANNEL, 2022-2031 (USD THOUSAND)
TABLE 108 EGYPT MULTIPLE HEREDITARY EXOSTOSIS MARKET, BY DIAGNOSIS, 2022-2031 (USD THOUSAND)
TABLE 109 EGYPT X-RAY IN MULTIPLE HEREDITARY EXOSTOSIS MARKET, BY TYPE, 2022-2031 (USD THOUSAND)
TABLE 110 EGYPT COMPUTED TOMOGRAPHY (CT) SCAN IN MULTIPLE HEREDITARY EXOSTOSIS MARKET, BY TYPE, 2022-2031 (USD THOUSAND)
TABLE 111 EGYPT MAGNETIC RESONANCE IMAGING (MRI) IN MULTIPLE HEREDITARY EXOSTOSIS MARKET, BY TYPE, 2022-2031 (USD THOUSAND)
TABLE 112 EGYPT GENETIC TESTS IN MULTIPLE HEREDITARY EXOSTOSIS MARKET, BY TYPE, 2022-2031 (USD THOUSAND)
TABLE 113 EGYPT OTHERS IN MULTIPLE HEREDITARY EXOSTOSIS MARKET, BY TYPE, 2022-2031 (USD THOUSAND)
TABLE 114 EGYPT MULTIPLE HEREDITARY EXOSTOSIS MARKET, BY SITE, 2022-2031 (USD THOUSAND)
TABLE 115 EGYPT MULTIPLE HEREDITARY EXOSTOSIS MARKET, BY AGE GROUP, 2022-2031 (USD THOUSAND)
TABLE 116 EGYPT MULTIPLE HEREDITARY EXOSTOSIS MARKET, BY END USER, 2022-2031 (USD THOUSAND)
TABLE 117 EGYPT HOSPITAL IN MULTIPLE HEREDITARY EXOSTOSIS MARKET, BY TYPE, 2022-2031 (USD THOUSAND)
TABLE 118 KUWAIT MULTIPLE HEREDITARY EXOSTOSIS MARKET, BY TYPE, 2022-2031 (USD THOUSAND)
TABLE 119 KUWAIT MULTIPLE HEREDITARY EXOSTOSIS MARKET, BY TREATMENT, 2022-2031 (USD THOUSAND)
TABLE 120 KUWAIT SURGERY IN MULTIPLE HEREDITARY EXOSTOSIS MARKET, BY TYPE, 2022-2031 (USD THOUSAND)
TABLE 121 KUWAIT MEDICATION IN MULTIPLE HEREDITARY EXOSTOSIS MARKET, BY DISTRIBUTION CHANNEL, 2022-2031 (USD THOUSAND)
TABLE 122 KUWAIT MULTIPLE HEREDITARY EXOSTOSIS MARKET, BY DIAGNOSIS, 2022-2031 (USD THOUSAND)
TABLE 123 KUWAIT X-RAY IN MULTIPLE HEREDITARY EXOSTOSIS MARKET, BY TYPE, 2022-2031 (USD THOUSAND)
TABLE 124 KUWAIT COMPUTED TOMOGRAPHY (CT) SCAN IN MULTIPLE HEREDITARY EXOSTOSIS MARKET, BY TYPE, 2022-2031 (USD THOUSAND)
TABLE 125 KUWAIT MAGNETIC RESONANCE IMAGING (MRI) IN MULTIPLE HEREDITARY EXOSTOSIS MARKET, BY TYPE, 2022-2031 (USD THOUSAND)
TABLE 126 KUWAIT GENETIC TESTS IN MULTIPLE HEREDITARY EXOSTOSIS MARKET, BY TYPE, 2022-2031 (USD THOUSAND)
TABLE 127 KUWAIT OTHERS IN MULTIPLE HEREDITARY EXOSTOSIS MARKET, BY TYPE, 2022-2031 (USD THOUSAND)
TABLE 128 KUWAIT MULTIPLE HEREDITARY EXOSTOSIS MARKET, BY SITE, 2022-2031 (USD THOUSAND)
TABLE 129 KUWAIT MULTIPLE HEREDITARY EXOSTOSIS MARKET, BY AGE GROUP, 2022-2031 (USD THOUSAND)
TABLE 130 KUWAIT MULTIPLE HEREDITARY EXOSTOSIS MARKET, BY END USER, 2022-2031 (USD THOUSAND)
TABLE 131 KUWAIT HOSPITAL IN MULTIPLE HEREDITARY EXOSTOSIS MARKET, BY TYPE, 2022-2031 (USD THOUSAND)
TABLE 132 QATAR MULTIPLE HEREDITARY EXOSTOSIS MARKET, BY TYPE, 2022-2031 (USD THOUSAND)
TABLE 133 QATAR MULTIPLE HEREDITARY EXOSTOSIS MARKET, BY TREATMENT, 2022-2031 (USD THOUSAND)
TABLE 134 QATAR SURGERY IN MULTIPLE HEREDITARY EXOSTOSIS MARKET, BY TYPE, 2022-2031 (USD THOUSAND)
TABLE 135 QATAR MEDICATION IN MULTIPLE HEREDITARY EXOSTOSIS MARKET, BY DISTRIBUTION CHANNEL, 2022-2031 (USD THOUSAND)
TABLE 136 QATAR MULTIPLE HEREDITARY EXOSTOSIS MARKET, BY DIAGNOSIS, 2022-2031 (USD THOUSAND)
TABLE 137 QATAR X-RAY IN MULTIPLE HEREDITARY EXOSTOSIS MARKET, BY TYPE, 2022-2031 (USD THOUSAND)
TABLE 138 QATAR COMPUTED TOMOGRAPHY (CT) SCAN IN MULTIPLE HEREDITARY EXOSTOSIS MARKET, BY TYPE, 2022-2031 (USD THOUSAND)
TABLE 139 QATAR MAGNETIC RESONANCE IMAGING (MRI) IN MULTIPLE HEREDITARY EXOSTOSIS MARKET, BY TYPE, 2022-2031 (USD THOUSAND)
TABLE 140 QATAR GENETIC TESTS IN MULTIPLE HEREDITARY EXOSTOSIS MARKET, BY TYPE, 2022-2031 (USD THOUSAND)
TABLE 141 QATAR OTHERS IN MULTIPLE HEREDITARY EXOSTOSIS MARKET, BY TYPE, 2022-2031 (USD THOUSAND)
TABLE 142 QATAR MULTIPLE HEREDITARY EXOSTOSIS MARKET, BY SITE, 2022-2031 (USD THOUSAND)
TABLE 143 QATAR MULTIPLE HEREDITARY EXOSTOSIS MARKET, BY AGE GROUP, 2022-2031 (USD THOUSAND)
TABLE 144 QATAR MULTIPLE HEREDITARY EXOSTOSIS MARKET, BY END USER, 2022-2031 (USD THOUSAND)
TABLE 145 QATAR HOSPITAL IN MULTIPLE HEREDITARY EXOSTOSIS MARKET, BY TYPE, 2022-2031 (USD THOUSAND)
TABLE 146 OMAN MULTIPLE HEREDITARY EXOSTOSIS MARKET, BY TYPE, 2022-2031 (USD THOUSAND)
TABLE 147 OMAN MULTIPLE HEREDITARY EXOSTOSIS MARKET, BY TREATMENT, 2022-2031 (USD THOUSAND)
TABLE 148 OMAN SURGERY IN MULTIPLE HEREDITARY EXOSTOSIS MARKET, BY TYPE, 2022-2031 (USD THOUSAND)
TABLE 149 OMAN MEDICATION IN MULTIPLE HEREDITARY EXOSTOSIS MARKET, BY DISTRIBUTION CHANNEL, 2022-2031 (USD THOUSAND)
TABLE 150 OMAN MULTIPLE HEREDITARY EXOSTOSIS MARKET, BY DIAGNOSIS, 2022-2031 (USD THOUSAND)
TABLE 151 OMAN X-RAY IN MULTIPLE HEREDITARY EXOSTOSIS MARKET, BY TYPE, 2022-2031 (USD THOUSAND)
TABLE 152 OMAN COMPUTED TOMOGRAPHY (CT) SCAN IN MULTIPLE HEREDITARY EXOSTOSIS MARKET, BY TYPE, 2022-2031 (USD THOUSAND)
TABLE 153 OMAN MAGNETIC RESONANCE IMAGING (MRI) IN MULTIPLE HEREDITARY EXOSTOSIS MARKET, BY TYPE, 2022-2031 (USD THOUSAND)
TABLE 154 OMAN GENETIC TESTS IN MULTIPLE HEREDITARY EXOSTOSIS MARKET, BY TYPE, 2022-2031 (USD THOUSAND)
TABLE 155 OMAN OTHERS IN MULTIPLE HEREDITARY EXOSTOSIS MARKET, BY TYPE, 2022-2031 (USD THOUSAND)
TABLE 156 OMAN MULTIPLE HEREDITARY EXOSTOSIS MARKET, BY SITE, 2022-2031 (USD THOUSAND)
TABLE 157 OMAN MULTIPLE HEREDITARY EXOSTOSIS MARKET, BY AGE GROUP, 2022-2031 (USD THOUSAND)
TABLE 158 OMAN MULTIPLE HEREDITARY EXOSTOSIS MARKET, BY END USER, 2022-2031 (USD THOUSAND)
TABLE 159 OMAN HOSPITAL IN MULTIPLE HEREDITARY EXOSTOSIS MARKET, BY TYPE, 2022-2031 (USD THOUSAND)
TABLE 160 BAHRAIN MULTIPLE HEREDITARY EXOSTOSIS MARKET, BY TYPE, 2022-2031 (USD THOUSAND)
TABLE 161 BAHRAIN MULTIPLE HEREDITARY EXOSTOSIS MARKET, BY TREATMENT, 2022-2031 (USD THOUSAND)
TABLE 162 BAHRAIN SURGERY IN MULTIPLE HEREDITARY EXOSTOSIS MARKET, BY TYPE, 2022-2031 (USD THOUSAND)
TABLE 163 BAHRAIN MEDICATION IN MULTIPLE HEREDITARY EXOSTOSIS MARKET, BY DISTRIBUTION CHANNEL, 2022-2031 (USD THOUSAND)
TABLE 164 BAHRAIN MULTIPLE HEREDITARY EXOSTOSIS MARKET, BY DIAGNOSIS, 2022-2031 (USD THOUSAND)
TABLE 165 BAHRAIN X-RAY IN MULTIPLE HEREDITARY EXOSTOSIS MARKET, BY TYPE, 2022-2031 (USD THOUSAND)
TABLE 166 BAHRAIN COMPUTED TOMOGRAPHY (CT) SCAN IN MULTIPLE HEREDITARY EXOSTOSIS MARKET, BY TYPE, 2022-2031 (USD THOUSAND)
TABLE 167 BAHRAIN MAGNETIC RESONANCE IMAGING (MRI) IN MULTIPLE HEREDITARY EXOSTOSIS MARKET, BY TYPE, 2022-2031 (USD THOUSAND)
TABLE 168 BAHRAIN GENETIC TESTS IN MULTIPLE HEREDITARY EXOSTOSIS MARKET, BY TYPE, 2022-2031 (USD THOUSAND)
TABLE 169 BAHRAIN OTHERS IN MULTIPLE HEREDITARY EXOSTOSIS MARKET, BY TYPE, 2022-2031 (USD THOUSAND)
TABLE 170 BAHRAIN MULTIPLE HEREDITARY EXOSTOSIS MARKET, BY SITE, 2022-2031 (USD THOUSAND)
TABLE 171 BAHRAIN MULTIPLE HEREDITARY EXOSTOSIS MARKET, BY AGE GROUP, 2022-2031 (USD THOUSAND)
TABLE 172 BAHRAIN MULTIPLE HEREDITARY EXOSTOSIS MARKET, BY END USER, 2022-2031 (USD THOUSAND)
TABLE 173 BAHRAIN HOSPITAL IN MULTIPLE HEREDITARY EXOSTOSIS MARKET, BY TYPE, 2022-2031 (USD THOUSAND)
TABLE 174 REST OF MIDDLE EAST AND AFRICA MULTIPLE HEREDITARY EXOSTOSIS MARKET, BY TYPE, 2022-2031 (USD THOUSAND)
List of Figure
FIGURE 1 MIDDLE EAST AND AFRICA MULTIPLE HEREDITARY EXOSTOSIS MARKET: SEGMENTATION
FIGURE 2 MIDDLE EAST AND AFRICA MULTIPLE HEREDITARY EXOSTOSIS MARKET: DATA TRIANGULATION
FIGURE 3 MIDDLE EAST AND AFRICA MULTIPLE HEREDITARY EXOSTOSIS MARKET: DROC ANALYSIS
FIGURE 4 MIDDLE EAST AND AFRICA MULTIPLE HEREDITARY EXOSTOSIS MARKET: MIDDLE EAST AND AFRICA VS REGIONAL MARKET ANALYSIS
FIGURE 5 MIDDLE EAST AND AFRICA MULTIPLE HEREDITARY EXOSTOSIS MARKET: COMPANY RESEARCH ANALYSIS
FIGURE 6 MIDDLE EAST AND AFRICA MULTIPLE HEREDITARY EXOSTOSIS MARKET: INTERVIEW DEMOGRAPHICS
FIGURE 7 MIDDLE EAST AND AFRICA MULTIPLE HEREDITARY EXOSTOSIS MARKET: MARKET END USER COVERAGE GRID
FIGURE 8 PRODUCT LIFELINE CURVE
FIGURE 9 MIDDLE EAST AND AFRICA MULTIPLE HEREDITARY EXOSTOSIS MARKET: DBMR MARKET POSITION GRID
FIGURE 10 MIDDLE EAST AND AFRICA MULTIPLE HEREDITARY EXOSTOSIS MARKET: VENDOR SHARE ANALYSIS
FIGURE 11 MIDDLE EAST AND AFRICA MULTIPLE HEREDITARY EXOSTOSIS MARKET: SEGMENTATION
FIGURE 12 EXECUTIVE SUMMARY
FIGURE 13 STRATEGIC DECISIONS
FIGURE 14 TWO SEGMENTS COMPRISE THE MIDDLE EAST AND AFRICA MULTIPLE HEREDITY EXOSTOSIS MARKET, BY TYPE
FIGURE 15 RISING PREVALENCE OF GENETIC DISORDERS IS DRIVING THE GROWTH OF THE MIDDLE EAST AND AFRICA MULTIPLE HEREDITARY EXOSTOSIS MARKET FROM 2024 TO 2031
FIGURE 16 THE TYPE SEGMENT IS EXPECTED TO ACCOUNT FOR THE LARGEST SHARE OF THE MIDDLE EAST AND AFRICA MULTIPLE HEREDITARY EXOSTOSIS MARKET IN 2024 AND 2031
FIGURE 17 MARKET OVERVIEW
FIGURE 18 MIDDLE EAST AND AFRICA MULTIPLE HEREDITARY EXOSTOSIS MARKET: BY TYPE, 2023
FIGURE 19 MIDDLE EAST AND AFRICA MULTIPLE HEREDITARY EXOSTOSIS MARKET: BY TYPE, 2024-2031 (USD THOUSAND)
FIGURE 20 MIDDLE EAST AND AFRICA MULTIPLE HEREDITARY EXOSTOSIS MARKET: BY TYPE, CAGR (2024-2031)
FIGURE 21 MIDDLE EAST AND AFRICA MULTIPLE HEREDITARY EXOSTOSIS MARKET: BY TYPE, LIFELINE CURVE
FIGURE 22 MIDDLE EAST AND AFRICA MULTIPLE HEREDITARY EXOSTOSIS MARKET: BY TREATMENT, 2023
FIGURE 23 MIDDLE EAST AND AFRICA MULTIPLE HEREDITARY EXOSTOSIS MARKET: BY TREATMENT, 2024-2031 (USD THOUSAND)
FIGURE 24 MIDDLE EAST AND AFRICA MULTIPLE HEREDITARY EXOSTOSIS MARKET: BY TREATMENT, CAGR (2024-2031)
FIGURE 25 MIDDLE EAST AND AFRICA MULTIPLE HEREDITARY EXOSTOSIS MARKET: BY TREATMENT, LIFELINE CURVE
FIGURE 26 MIDDLE EAST AND AFRICA MULTIPLE HEREDITARY EXOSTOSIS MARKET: BY DIAGNOSIS, 2023
FIGURE 27 MIDDLE EAST AND AFRICA MULTIPLE HEREDITARY EXOSTOSIS MARKET: BY DIAGNOSIS, 2024-2031 (USD THOUSAND)
FIGURE 28 MIDDLE EAST AND AFRICA MULTIPLE HEREDITARY EXOSTOSIS MARKET: BY DIAGNOSIS, CAGR (2024-2031)
FIGURE 29 MIDDLE EAST AND AFRICA MULTIPLE HEREDITARY EXOSTOSIS MARKET: BY DIAGNOSIS, LIFELINE CURVE
FIGURE 30 MIDDLE EAST AND AFRICA MULTIPLE HEREDITARY EXOSTOSIS MARKET: BY SITE, 2023
FIGURE 31 MIDDLE EAST AND AFRICA MULTIPLE HEREDITARY EXOSTOSIS MARKET: BY SITE, 2024-2031 (USD THOUSAND)
FIGURE 32 MIDDLE EAST AND AFRICA MULTIPLE HEREDITARY EXOSTOSIS MARKET: BY SITE, CAGR (2024-2031)
FIGURE 33 MIDDLE EAST AND AFRICA MULTIPLE HEREDITARY EXOSTOSIS MARKET: BY SITE, LIFELINE CURVE
FIGURE 34 MIDDLE EAST AND AFRICA MULTIPLE HEREDITARY EXOSTOSIS MARKET: BY AGE GROUP, 2023
FIGURE 35 MIDDLE EAST AND AFRICA MULTIPLE HEREDITARY EXOSTOSIS MARKET: BY AGE GROUP, 2024-2031 (USD THOUSAND)
FIGURE 36 MIDDLE EAST AND AFRICA MULTIPLE HEREDITARY EXOSTOSIS MARKET: BY AGE GROUP, CAGR (2024-2031)
FIGURE 37 MIDDLE EAST AND AFRICA MULTIPLE HEREDITARY EXOSTOSIS MARKET: BY AGE GROUP, LIFELINE CURVE
FIGURE 38 MIDDLE EAST AND AFRICA MULTIPLE HEREDITARY EXOSTOSIS MARKET: BY END USER, 2023
FIGURE 39 MIDDLE EAST AND AFRICA MULTIPLE HEREDITARY EXOSTOSIS MARKET: BY END USER, 2024-2031 (USD THOUSAND)
FIGURE 40 MIDDLE EAST AND AFRICA MULTIPLE HEREDITARY EXOSTOSIS MARKET: BY END USER, CAGR (2024-2031)
FIGURE 41 MIDDLE EAST AND AFRICA MULTIPLE HEREDITARY EXOSTOSIS MARKET: BY END USER, LIFELINE CURVE
FIGURE 42 MIDDLE EAST AND AFRICA MULTIPLE HEREDITY EXOSTOSIS MARKET: SNAPSHOT (2023)
FIGURE 43 MIDDLE EAST AND AFRICA MULTIPLE HEREDITARY EXOSTOSIS MARKET: COMPANY SHARE 2023 (%)
Data collection and base year analysis are done using data collection modules with large sample sizes. The stage includes obtaining market information or related data through various sources and strategies. It includes examining and planning all the data acquired from the past in advance. It likewise envelops the examination of information inconsistencies seen across different information sources. The market data is analysed and estimated using market statistical and coherent models. Also, market share analysis and key trend analysis are the major success factors in the market report. To know more, please request an analyst call or drop down your inquiry.
The key research methodology used by DBMR research team is data triangulation which involves data mining, analysis of the impact of data variables on the market and primary (industry expert) validation. Data models include Vendor Positioning Grid, Market Time Line Analysis, Market Overview and Guide, Company Positioning Grid, Patent Analysis, Pricing Analysis, Company Market Share Analysis, Standards of Measurement, Global versus Regional and Vendor Share Analysis. To know more about the research methodology, drop in an inquiry to speak to our industry experts.
Data Bridge Market Research is a leader in advanced formative research. We take pride in servicing our existing and new customers with data and analysis that match and suits their goal. The report can be customized to include price trend analysis of target brands understanding the market for additional countries (ask for the list of countries), clinical trial results data, literature review, refurbished market and product base analysis. Market analysis of target competitors can be analyzed from technology-based analysis to market portfolio strategies. We can add as many competitors that you require data about in the format and data style you are looking for. Our team of analysts can also provide you data in crude raw excel files pivot tables (Fact book) or can assist you in creating presentations from the data sets available in the report.


