
Middle East And Africa Next Generation Packaging Market
Market Size in USD Million
 USD
271.70 Million
USD
413.76 Million
2021
2029
USD
271.70 Million
USD
413.76 Million
2021
2029
| 2022 - 2029 | |
| USD 271.70 Million | |
| USD 413.76 Million | |
| % | |
Market Analysis and Insights: Middle East and Africa Next Generation Packaging Market
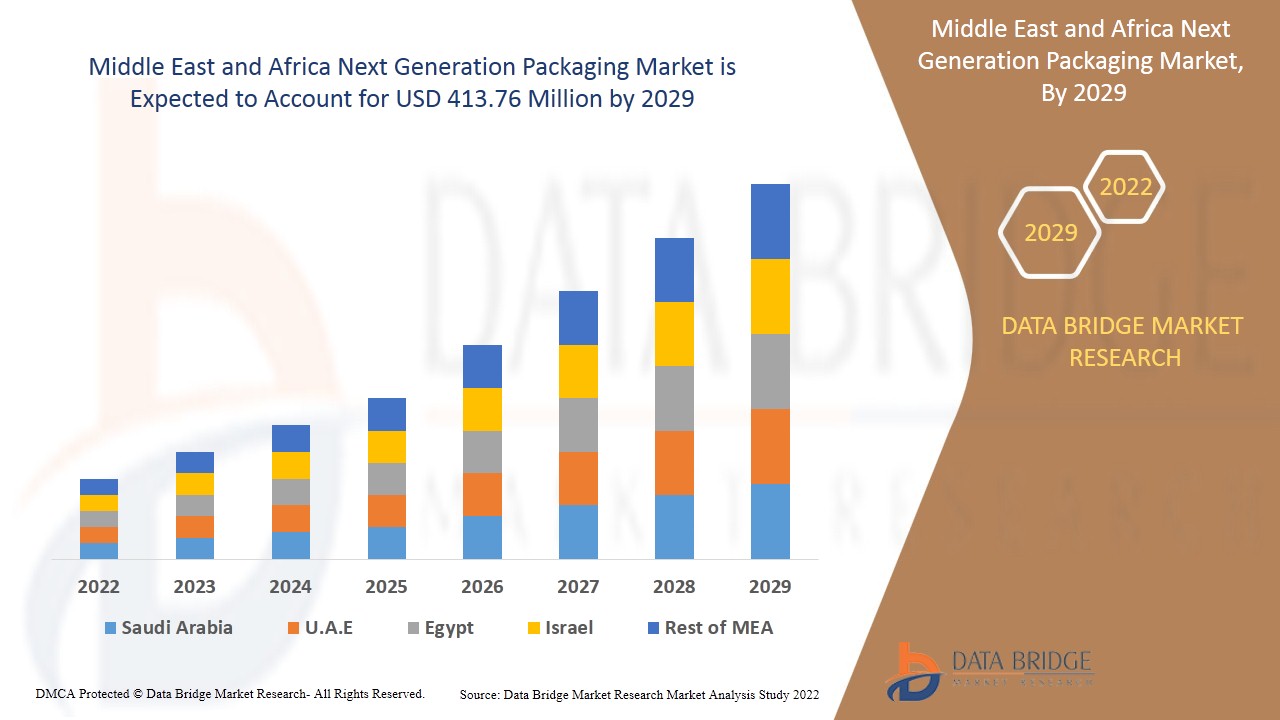
The Middle East & Africa next generation packaging market is expected to gain significant growth in the forecast period of 2022 to 2029. Data Bridge Market Research analyzes that the market is growing with a CAGR of 5.4% in the forecast period of 2022 to 2029 and is expected to reach USD 413.76 million by 2029 from USD 271.70 million in 2021.
Next generation packaging includes active, intelligent and modified atmosphere packaging. It is basically a packaging technology, which possesses different advanced features, such as traceability, offers various benefits such as product shelf life extension and provides product quality information. The term active packaging, intelligent packaging, smart packaging refer to packaging systems used for foods, pharmaceuticals, and several other types of products. They help extend shelf life, monitor freshness, display information on quality, improve safety, and improve convenience. These terms are closely related. For instance- active packaging usually means having active functions beyond the inert passive containment and protection of the product, Intelligent and active packaging usually involves the ability to sense or measure an attribute of the product, the inner atmosphere of the package, or the shipping environment. This information can be communicated to users or can trigger active packaging functions, programmable matter, and smart materials among others.
The recent trend indicates increasing demand for next generation packaging as investments in public and private healthcare industries increase. The factors driving the growth of the market are raising health awareness among the general population, and continuous technological advancements in packaging. With the rapid growth of globalization and increase in mandates for food and beverages by various countries and regions, the global next generation packaging market will witness an increased trajectory in the coming years. However, the high cost of packaging will restrict the market growth.
Various companies are making strategic decisions, such as forming agreements with research facilities to launch new products, to improve their market share. As a result, the next generation packaging market is growing at a rapid rate.
To understand the analysis and the next generation packaging market scenario, contact Data Bridge Market Research for an Analyst Brief. Our team will help you create a revenue impact solution to achieve your desired goal.
Middle East & Africa Next Generation Packaging Market Scope and Market Size
Middle East & Africa next generation packaging market is segmented into five segments based on packaging type, function, technology, material, and application. The growth among segments helps you analyze niche pockets of growth and strategies to approach the market and determine your core application areas and the difference in your target markets.
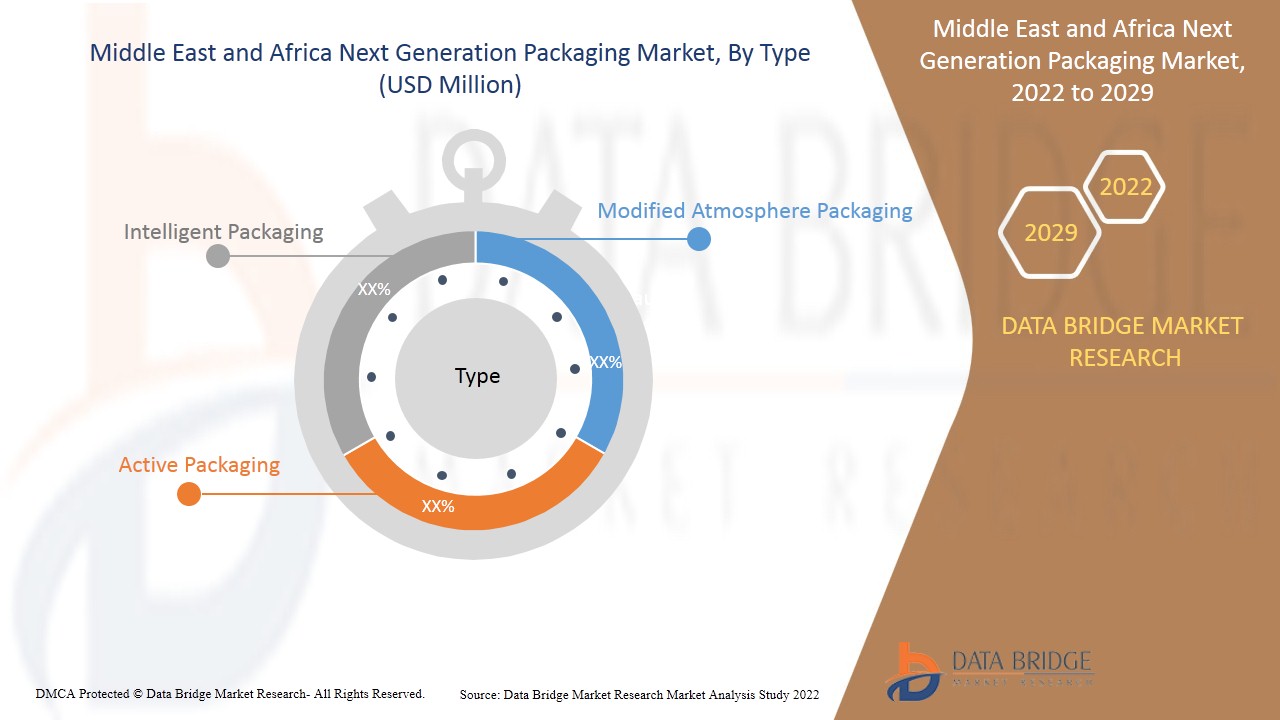
- On the basis of type, the Middle East & Africa next generation packaging market is segmented into active packaging, intelligent packaging and modified atmosphere packaging. In 2022, active packaging segment is expected to dominate the market due to the high production quantity and ease in use of active packaging.
- On the basis of function, the Middle East & Africa next generation packaging market is segmented into moisture control, temperature indicators, shelf life sensing, product tracking, and others. In 2022, the moisture control segment is expected to dominate the market as it is the most demanded packaging function to extend the shelf life of the product.
- On the basis of technology, the Middle East & Africa next generation packaging market is segmented into scavengers and susceptors, RFID tags, QR codes, NFC tags, coding & markings, sensors & output devices, and others. In 2022, the Scavengers and Susceptors segment is expected to dominate the market as it gives easy access of the product to consumers.
- On the basis of material, the Middle East & Africa next generation packaging market is segmented into plastic, paper, glass, corrugated board, metal, and others. In 2022, plastic segment is expected to dominate the market as consumers are interesting in such type of packaging due to affordability.
- On the basis of application, the Middle East & Africa next generation packaging market is segmented into food, beverages, personal care, healthcare, logistics and supply chain, consumer electronics, and others. In 2022, the food segment is expected to dominate the market as the demand for packaged food is increasing all over the world owing to the busy lifestyle.
Middle East & Africa next generation packaging market is fragmented and the major players have used various strategies, such as new product launches, expansions, agreements, joint ventures, partnerships, acquisitions, and others, to increase their footprints in the Middle East & Africa next generation packaging market.
Middle East and Africa by country is segmented into South Africa, Saudi Arabia, UAE, Egypt, Israel, and Rest of Middle East and Africa. In 2022, South Africa is expected to dominate the Middle East and Africa next generation packaging market, due to growing application of this market in the food and beverage industry.
Growing Strategic Activities by Major Market Players to Enhance the Awareness for Next Generation Packaging is Boosting the Market Growth
The next generation packaging market also provides you with a detailed market analysis for every country's growth in a particular market. Additionally, it provides detailed information regarding the market players’ strategies and their geographical presence. The data is available for the historical period 2010 to 2019.
Competitive Landscape and Middle East & Africa Next Generation Packaging Market Share Analysis
Middle East & Africa next generation packaging market competitive landscape provides details by the competitor. Details included are company overview, company financials, revenue generated, market potential, investment in research and development, new market initiatives, production sites and facilities, company strengths and weaknesses, product launch, product approvals, patents, product width, and breadth, application dominance, and technology lifeline curve. The above data points provided are only related to the companies’ focus related to the Middle East & Africa next generation packaging market.
Some of the major players operating in the Middle East & Africa next generation packaging market are Amcor plc, Sealed Air, BALL CORPORATION, DuPont de Nemours, Inc., R.R. Donnelley & Sons Company, and MITSUBISHI GAS CHEMICAL among others. DBMR analysts understand competitive strengths and provide competitive analysis for each competitor separately.
Many developments are also initiated by the companies worldwide, which are accelerating the Middle East & Africa next generation packaging market growth.
For instance,
- In April 2021, DuPont announced that it successfully completed the acquisition of Laird Performance Materials, a world leader in high-performance electromagnetic shielding and thermal management solutions.
SKU-

- Interactive Data Analysis Dashboard
- Company Analysis Dashboard for high growth potential opportunities
- Research Analyst Access for customization & queries
- Competitor Analysis with Interactive dashboard
- Latest News, Updates & Trend analysis
- Harness the Power of Benchmark Analysis for Comprehensive Competitor Tracking
Table of Content
1 INTRODUCTION
1.1 OBJECTIVES OF THE STUDY
1.2 MARKET DEFINITION
1.3 OVERVIEW OF MIDDLE EAST & AFRICA NEXT GENERATION PACKAGING MARKET
1.4 LIMITATIONS
1.5 MARKETS COVERED
2 MARKET SEGMENTATION
2.1 MARKETS COVERED
2.2 GEOGRAPHICAL SCOPE
2.3 YEARS CONSIDERED FOR THE STUDY
2.4 CURRENCY AND PRICING
2.5 DBMR TRIPOD DATA VALIDATION MODEL
2.6 MULTIVARIATE MODELLING
2.7 SOURCE LIFELINE CURVE
2.8 PRIMARY INTERVIEWS WITH KEY OPINION LEADERS
2.9 DBMR MARKET POSITION GRID
2.1 MIDDLE EAST & AFRICA NEXT GENERATION PACKAGING MARKET: APPLICATION COVERAGE GRID
2.11 VENDOR SHARE ANALYSIS
2.12 SECONDARY SOURCES
2.13 ASSUMPTIONS
3 EXECUTIVE SUMMARY
4 PREMIUM INSIGHTS
5 INDUSTRIAL INSIGHTS: MIDDLE EAST & AFRICA NEXT GENERATION PACKAGING MARKET
5.1 DEVELOPMENT OF ADVANCED SMART PACKAGING PRODUCT
5.2 TEMPERATURE BALANCING SMART PACKAGING:
5.3 SMART PACKAGING TO IMPROVE CONSUMER SAFETY:
5.4 CONCLUSION:
6 MARKET OVERVIEW
6.1 DRIVERS
6.1.1 GROWING DEMAND FOR INTELLIGENT PACKAGING TO AVOID FOOD WASTAGE
6.1.2 INCREASING DISPOSABLE INCOME OF CONSUMERS
6.1.3 INCREASING CASES OF FOOD CONTAMINATION
6.1.4 INCREASE IN THE CONSUMPTION OF PACKAGED PRODUCTS
6.1.5 INCREASING HEALTH AWARENESS AMONG CONSUMERS
6.2 RESTRAINTS
6.2.1 COSTS ASSOCIATED WITH RESEARCH AND DEVELOPMENT ACTIVITIES
6.2.2 HIGH COMPETITION AMONG MARKET PLAYERS
6.3 OPPORTUNITIES
6.3.1 RECENT INNOVATIONS AND NEW PRODUCT LAUNCHES
6.3.2 GROWING ALCOHOLIC AND NON-ALCOHOLIC INDUSTRY WITH ACTIVE AND INTELLIGENT PACKAGING
6.4 CHALLENGES
6.4.1 AVAILABILITY OF ALTERNATIVES IN THE MARKET
6.4.2 SUPPLY CHAIN DISRUPTION DUE TO COVID-19
7 IMPACT OF COVID-19 ON THE MIDDLE EAST & AFRICA NEXT GENERATION PACKAGING MARKET
7.1 AWARENESS ABOUT FOOD SAFETY AND QUALITY INCREASED DUE TO THE COVID-19 PANDEMIC
7.2 COVID-19 IMPACT ON DEMAND & SUPPLY CHAIN OF NEXT GENERATION PACKAGING
7.3 IMPACT ON PRICE
7.4 INITIATIVES TAKEN BY MANUFACTURERS
7.5 CONCLUSION
8 MIDDLE EAST & AFRICA NEXT GENERATION PACKAGING MARKET, BY TYPE
8.1 OVERVIEW
8.2 ACTIVE PACKAGING
8.2.1 GAS SCAVENGERS/EMITTERS
8.2.2 MICROWAVE SUSCEPTORS
8.2.3 OTHERS
8.3 INTELLIGENT PACKAGING
8.4 MODIFIED ATMOSPHERE PACKAGING
9 MIDDLE EAST & AFRICA NEXT GENERATION PACKAGING MARKET, BY FUNCTION
9.1 OVERVIEW
9.2 MOISTURE CONTROL
9.3 TEMPERATURE INDICATORS
9.4 PRODUCT TRACKING
9.5 SHELF LIFE SENSING
9.6 OTHERS
10 MIDDLE EAST & AFRICA NEXT GENERATION PACKAGING MARKET, BY TECHNOLOGY
10.1 OVERVIEW
10.2 SCAVENGERS AND SUSCEPTORS
10.3 RFID TAGS
10.4 NFC TAGS
10.5 QR CODES
10.6 SENSORS & OUTPUT DEVICES
10.7 CODING & MARKINGS
10.8 OTHERS
11 MIDDLE EAST & AFRICA NEXT GENERATION PACKAGING MARKET, BY MATERIAL
11.1 OVERVIEW
11.2 PLASTIC
11.3 PAPER
11.4 CORRUGATED BOARD
11.5 OTHERS
12 MIDDLE EAST & AFRICA NEXT GENERATION PACKAGING MARKET, BY APPLICATION
12.1 OVERVIEW
12.2 FOOD
12.2.1 PACKAGED FOOD
12.2.2 PROCESSED FOOD
12.2.2.1 CHILLED
12.2.2.2 DRIED
12.2.3 MEAT & POULTRY
12.2.4 DAIRY
12.2.5 BAKERY & CONFECTIONERY
12.2.6 FRUITS & VEGETABLES
12.2.7 FROZEN FOOD
12.2.8 OTHERS
12.3 BEVERAGES
12.3.1 NON- ALCOHOLIC
12.3.2 ALCOHOLIC
12.4 PERSONAL CARE
12.5 HEALTH CARE
12.6 LOGISTICS & SUPPLY CHAIN
12.7 CONSUMER ELECTRONICS
12.8 OTHERS
13 MIDDLE EAST & AFRICA NEXT GENERATION PACKAGING MARKET, BY REGION
13.1 MIDDLE EAST AND AFRICA
13.1.1 SOUTH AFRICA
13.1.2 SAUDI ARABIA
13.1.3 U.A.E.
13.1.4 EGYPT
13.1.5 ISRAEL
13.1.6 REST OF MIDDLE EAST & AFRICA
14 COMPANY LANDSCAPE
14.1 COMPANY SHARE ANALYSIS: MIDDLE EAST & AFRICA
15 SWOT ANALYSIS
16 COMPANY PROFILE
16.1 AVERY DENNISON CORPORATION
16.1.1 COMPANY SNAPSHOT
16.1.2 REVENUE ANALYSIS
16.1.3 COMPANY SHARE ANALYSIS
16.1.4 PRODUCT PORTFOLIO
16.1.5 RECENT DEVELOPMENT
16.2 DUPONT
16.2.1 COMPANY SNAPSHOT
16.2.2 REVENUE ANALYSIS
16.2.3 COMPANY SHARE ANALYSIS
16.2.4 PRODUCT PORTFOLIO
16.2.5 RECENT DEVELOPMENTS
16.3 BALL CORPORATION
16.3.1 COMPANY SNAPSHOT
16.3.2 REVENUE ANALYSIS
16.3.3 COMPANY SHARE ANALYSIS
16.3.4 PRODUCT PORTFOLIO
16.3.5 RECENT DEVELOPMENT
16.4 GRAHAM PACKAGING COMPANY
16.4.1 COMPANY SNAPSHOT
16.4.2 COMPANY SHARE ANALYSIS
16.4.3 PRODUCT PORTFOLIO
16.4.4 RECENT DEVELOPMENT
16.5 R.R. DONNELLEY & SONS COMPANY
16.5.1 COMPANY SNAPSHOT
16.5.2 REVENUE ANALYSIS
16.5.3 COMPANY SHARE ANALYSIS
16.5.4 PRODUCT PORTFOLIO
16.5.5 RECENT DEVELOPMENTS
16.6 ACTIVE PACKAGING
16.6.1 COMPANY SANPSHOT
16.6.2 PRODUCT PORTFOLIO
16.6.3 RECENT DEVELOPMENT
16.7 AMCOR PLC
16.7.1 COMPANY SNAPSHOT
16.7.2 REVENUE ANALYSIS
16.7.3 PRODUCT PORTFOLIO
16.7.4 RECENT DEVELOPMENTS
16.8 AMERPLAST
16.8.1 COMPANY SNAPSHOT
16.8.2 PRODUCT PORTFOLIO
16.8.3 RECENT DEVELOPMENT
16.9 AMERICAN THERMAL INSTRUMENTS
16.9.1 COMPANY SANPSHOT
16.9.2 PRODUCT PORTFOLIO
16.9.3 RECENT DEVELOPMENTS
16.1 CORTEC PACKAGING
16.10.1 COMPANY SNAPSHOT
16.10.2 PRODUCT PORTFOLIO
16.10.3 RECENT DEVELOPMENT
16.11 KLÖCKNER PENTAPLAST
16.11.1 COMPANY SNAPSHOT
16.11.2 PRODUCT PORTFOLIO
16.11.3 RECENT DEVELOPMENTS
16.12 MICROBEGUARD CORPORATION
16.12.1 COMPANY SNAPSHOT
16.12.2 PRODUCT PORTFOLIO
16.12.3 RECENT DEVELOPMENT
16.13 MITSUBISHI GAS CHEMICAL COMPANY, INC.
16.13.1 COMPANY SNAPSHOT
16.13.2 REVENUE ANALYSIS
16.13.3 PRODUCT PORTFOLIO
16.13.4 RECENT DEVELOPMENTS
16.14 SAES GETTERS S.P.A.
16.14.1 COMPANY SANPSHOT
16.14.2 PRODUCT PORTFOLIO
16.14.3 RECENT DEVELOPMENT
16.15 SEALED AIR
16.15.1 COMPANY SNAPSHOT
16.15.2 REVENUE ANALYSIS
16.15.3 PRODUCT PORTFOLIO
16.15.4 RECENT DEVELOPMENT
16.16 TEMPTIME CORPORATION.
16.16.1 COMPANY SANPSHOT
16.16.2 PRODUCT PORTFOLIO
16.16.3 RECENT DEVELOPMENTS
16.17 TOPPAN INC.
16.17.1 COMPANY SNAPSHOT
16.17.2 PRODUCT PORTFOLIO
16.17.3 RECENT DEVELOPMENT
16.18 VESTA
16.18.1 COMPANY SNAPSHOT
16.18.2 PRODUCT PORTFOLIO
16.18.3 RECENT DEVELOPMENT
17 QUESTIONNAIRE
18 RELATED REPORTS
List of Table
TABLE 1 MIDDLE EAST & AFRICA NEXT GENERATION PACKAGING MARKET, BY TYPE, 2020-2029 (USD MILLION)
TABLE 2 MIDDLE EAST & AFRICA ACTIVE PACKAGING IN NEXT GENERATION PACKAGING MARKET, BY REGION, 2020-2029 (USD MILLION)
TABLE 3 MIDDLE EAST & AFRICA ACTIVE PACKAGING IN NEXT GENERATION PACKAGING MARKET, BY TYPE, 2020-2029 (USD MILLION)
TABLE 4 MIDDLE EAST & AFRICA INTELLIGENT PACKAGING IN NEXT GENERATION PACKAGING MARKET, BY REGION, 2020-2029 (USD MILLION)
TABLE 5 MIDDLE EAST & AFRICA MODIFIED ATMOSPHERE PACKAGING IN NEXT GENERATION PACKAGING MARKET, BY REGION, 2020-2029 (USD MILLION)
TABLE 6 MIDDLE EAST & AFRICA NEXT GENERATION PACKAGING MARKET, BY FUNCTION, 2020-2029 (USD MILLION)
TABLE 7 MIDDLE EAST & AFRICA MOISTURE CONTROL IN NEXT GENERATION PACKAGING MARKET, BY REGION, 2020-2029 (USD MILLION)
TABLE 8 MIDDLE EAST & AFRICA TEMPERATURE INDICATORS IN NEXT GENERATION PACKAGING MARKET, BY REGION, 2020-2029 (USD MILLION)
TABLE 9 MIDDLE EAST & AFRICA PRODUCT TRACKING IN NEXT GENERATION PACKAGING MARKET, BY REGION, 2020-2029 (USD MILLION)
TABLE 10 MIDDLE EAST & AFRICA SHELF LIFE SENSING IN NEXT GENERATION PACKAGING MARKET, BY REGION, 2020-2029 (USD MILLION)
TABLE 11 MIDDLE EAST & AFRICA OTHERS IN NEXT GENERATION PACKAGING MARKET, BY REGION, 2020-2029 (USD MILLION)
TABLE 12 MIDDLE EAST & AFRICA NEXT GENERATION PACKAGING MARKET, BY TECHNOLOGY, 2020-2029 (USD MILLION)
TABLE 13 MIDDLE EAST & AFRICA SCAVENGERS AND SUSCEPTORS IN NEXT GENERATION PACKAGING MARKET, BY REGION, 2020-2029 (USD MILLION)
TABLE 14 MIDDLE EAST & AFRICA RFID TAGS IN NEXT GENERATION PACKAGING MARKET, BY REGION, 2020-2029 (USD MILLION)
TABLE 15 MIDDLE EAST & AFRICA NFC TAGS IN NEXT GENERATION PACKAGING MARKET, BY REGION, 2020-2029 (USD MILLION)
TABLE 16 MIDDLE EAST & AFRICA QR CODES IN NEXT GENERATION PACKAGING MARKET, BY REGION, 2020-2029 (USD MILLION)
TABLE 17 MIDDLE EAST & AFRICA SENSORS & OUTPUT DEVICES IN NEXT GENERATION PACKAGING MARKET, BY REGION, 2020-2029 (USD MILLION)
TABLE 18 MIDDLE EAST & AFRICA CODING & MARKINGS IN NEXT GENERATION PACKAGING MARKET, BY REGION, 2020-2029 (USD MILLION)
TABLE 19 MIDDLE EAST & AFRICA OTHERS IN NEXT GENERATION PACKAGING MARKET, BY REGION, 2020-2029 (USD MILLION)
TABLE 20 MIDDLE EAST & AFRICA NEXT GENERATION PACKAGING MARKET, BY MATERIAL, 2020-2029 (USD MILLION)
TABLE 21 MIDDLE EAST & AFRICA PLASTIC IN NEXT GENERATION PACKAGING MARKET, BY REGION, 2020-2029 (USD MILLION)
TABLE 22 MIDDLE EAST & AFRICA PAPER IN NEXT GENERATION PACKAGING MARKET, BY REGION, 2020-2029 (USD MILLION)
TABLE 23 MIDDLE EAST & AFRICA CORRUGATED BOARD IN NEXT GENERATION PACKAGING MARKET, BY REGION, 2020-2029 (USD MILLION)
TABLE 24 MIDDLE EAST & AFRICA OTHERS IN NEXT GENERATION PACKAGING MARKET, BY REGION, 2020-2029 (USD MILLION)
TABLE 25 MIDDLE EAST & AFRICA NEXT GENERATION PACKAGING MARKET, BY APPLICATION, 2020-2029 (USD MILLION)
TABLE 26 MIDDLE EAST & AFRICA FOOD IN NEXT GENERATION PACKAGING MARKET, BY REGION, 2020-2029 (USD MILLION)
TABLE 27 MIDDLE EAST & AFRICA FOOD IN NEXT GENERATION PACKAGING MARKET, BY APPLICATION, 2020-2029 (USD MILLION)
TABLE 28 MIDDLE EAST & AFRICA PROCESSED FOOD IN NEXT GENERATION PACKAGING MARKET, BY APPLICTION, 2020-2029 (USD MILLION)
TABLE 29 MIDDLE EAST & AFRICA BEVERAGES IN NEXT GENERATION PACKAGING MARKET, BY REGION, 2020-2029 (USD MILLION)
TABLE 30 MIDDLE EAST & AFRICA BEVERAGES IN NEXT GENERATION PACKAGING MARKET, BY APPLICATION, 2020-2029 (USD MILLION)
TABLE 31 MIDDLE EAST & AFRICA PERSONAL CARE IN NEXT GENERATION PACKAGING MARKET, BY REGION, 2020-2029 (USD MILLION)
TABLE 32 MIDDLE EAST & AFRICA HEALTHCARE IN NEXT GENERATION PACKAGING MARKET, BY REGION, 2020-2029 (USD MILLION)
TABLE 33 MIDDLE EAST & AFRICA LOGISTICS & SUPPLY CHAIN IN NEXT GENERATION PACKAGING MARKET, BY REGION, 2020-2029 (USD MILLION)
TABLE 34 MIDDLE EAST & AFRICA CONSUMER ELECTRONICS IN NEXT GENERATION PACKAGING MARKET, BY REGION, 2020-2029 (USD MILLION)
TABLE 35 MIDDLE EAST & AFRICA OTHERS IN NEXT GENERATION PACKAGING MARKET, BY REGION, 2020-2029 (USD MILLION)
TABLE 36 MIDDLE EAST AND AFRICA NEXT GENERATION PACKAGING MARKET, BY COUNTRY, 2020-2029 (USD MILLION)
TABLE 37 MIDDLE EAST AND AFRICA NEXT GENERATION PACKAGING MARKET, BY TYPE, 2020-2029 (USD MILLION)
TABLE 38 MIDDLE EAST AND AFRICA ACTIVE PACKAGING IN NEXT GENERATION PACKAGING MARKET, BY TYPE, 2020-2029 (USD MILLION)
TABLE 39 MIDDLE EAST AND AFRICA NEXT GENERATION PACKAGING MARKET, BY FUNCTION, 2020-2029 (USD MILLION)
TABLE 40 MIDDLE EAST AND AFRICA NEXT GENERATION PACKAGING MARKET, BY TECHNOLOGY, 2020-2029 (USD MILLION)
TABLE 41 MIDDLE EAST AND AFRICA NEXT GENERATION PACKAGING MARKET, BY MATERIAL, 2020-2029 (USD MILLION)
TABLE 42 MIDDLE EAST AND AFRICA NEXT GENERATION PACKAGING MARKET, BY APPLICATION, 2020-2029 (USD MILLION)
TABLE 43 MIDDLE EAST AND AFRICA FOOD IN NEXT GENERATION PACKAGING MARKET, BY APPLICATION, 2020-2029 (USD MILLION)
TABLE 44 MIDDLE EAST AND AFRICA PROCESSED FOOD IN NEXT GENERATION PACKAGING MARKET, BY APPLICATION, 2020-2029 (USD MILLION)
TABLE 45 MIDDLE EAST AND AFRICA BEVERAGES IN NEXT GENERATION PACKAGING MARKET, BY APPLICATION, 2020-2029 (USD MILLION)
TABLE 46 SOUTH AFRICA NEXT GENERATION PACKAGING MARKET, BY TYPE, 2020-2029 (USD MILLION)
TABLE 47 SOUTH AFRICA ACTIVE PACKAGING IN NEXT GENERATION PACKAGING MARKET, BY TYPE, 2020-2029 (USD MILLION)
TABLE 48 SOUTH AFRICA NEXT GENERATION PACKAGING MARKET, BY FUNCTION, 2020-2029 (USD MILLION)
TABLE 49 SOUTH AFRICA NEXT GENERATION PACKAGING MARKET, BY TECHNOLOGY, 2020-2029 (USD MILLION)
TABLE 50 SOUTH AFRICA NEXT GENERATION PACKAGING MARKET, BY MATERIAL, 2020-2029 (USD MILLION)
TABLE 51 SOUTH AFRICA NEXT GENERATION PACKAGING MARKET, BY APPLICATION, 2020-2029 (USD MILLION)
TABLE 52 SOUTH AFRICA FOOD IN NEXT GENERATION PACKAGING MARKET, BY APPLICATION, 2020-2029 (USD MILLION)
TABLE 53 SOUTH AFRICA PROCESSED FOOD IN NEXT GENERATION PACKAGING MARKET, BY APPLICATION, 2020-2029 (USD MILLION)
TABLE 54 SOUTH AFRICA BEVERAGES IN NEXT GENERATION PACKAGING MARKET, BY APPLICATION, 2020-2029 (USD MILLION)
TABLE 55 SAUDI ARABIA NEXT GENERATION PACKAGING MARKET, BY TYPE, 2020-2029 (USD MILLION)
TABLE 56 SAUDI ARABIA ACTIVE PACKAGING IN NEXT GENERATION PACKAGING MARKET, BY TYPE, 2020-2029 (USD MILLION)
TABLE 57 SAUDI ARABIA NEXT GENERATION PACKAGING MARKET, BY FUNCTION, 2020-2029 (USD MILLION)
TABLE 58 SAUDI ARABIA NEXT GENERATION PACKAGING MARKET, BY TECHNOLOGY, 2020-2029 (USD MILLION)
TABLE 59 SAUDI ARABIA NEXT GENERATION PACKAGING MARKET, BY MATERIAL, 2020-2029 (USD MILLION)
TABLE 60 SAUDI ARABIA NEXT GENERATION PACKAGING MARKET, BY APPLICATION, 2020-2029 (USD MILLION)
TABLE 61 SAUDI ARABIA FOOD IN NEXT GENERATION PACKAGING MARKET, BY APPLICATION, 2020-2029 (USD MILLION)
TABLE 62 SAUDI ARABIA PROCESSED FOOD IN NEXT GENERATION PACKAGING MARKET, BY APPLICATION, 2020-2029 (USD MILLION)
TABLE 63 SAUDI ARABIA BEVERAGES IN NEXT GENERATION PACKAGING MARKET, BY APPLICATION, 2020-2029 (USD MILLION)
TABLE 64 U.A.E. NEXT GENERATION PACKAGING MARKET, BY TYPE, 2020-2029 (USD MILLION)
TABLE 65 U.A.E. ACTIVE PACKAGING IN NEXT GENERATION PACKAGING MARKET, BY TYPE, 2020-2029 (USD MILLION)
TABLE 66 U.A.E. NEXT GENERATION PACKAGING MARKET, BY FUNCTION, 2020-2029 (USD MILLION)
TABLE 67 U.A.E. NEXT GENERATION PACKAGING MARKET, BY TECHNOLOGY, 2020-2029 (USD MILLION)
TABLE 68 U.A.E. NEXT GENERATION PACKAGING MARKET, BY MATERIAL, 2020-2029 (USD MILLION)
TABLE 69 U.A.E. NEXT GENERATION PACKAGING MARKET, BY APPLICATION, 2020-2029 (USD MILLION)
TABLE 70 U.A.E. FOOD IN NEXT GENERATION PACKAGING MARKET, BY APPLICATION, 2020-2029 (USD MILLION)
TABLE 71 U.A.E. PROCESSED FOOD IN NEXT GENERATION PACKAGING MARKET, BY APPLICATION, 2020-2029 (USD MILLION)
TABLE 72 U.A.E. BEVERAGES IN NEXT GENERATION PACKAGING MARKET, BY APPLICATION, 2020-2029 (USD MILLION)
TABLE 73 EGYPT NEXT GENERATION PACKAGING MARKET, BY TYPE, 2020-2029 (USD MILLION)
TABLE 74 EGYPT ACTIVE PACKAGING IN NEXT GENERATION PACKAGING MARKET, BY TYPE, 2020-2029 (USD MILLION)
TABLE 75 EGYPT NEXT GENERATION PACKAGING MARKET, BY FUNCTION, 2020-2029 (USD MILLION)
TABLE 76 EGYPT NEXT GENERATION PACKAGING MARKET, BY TECHNOLOGY, 2020-2029 (USD MILLION)
TABLE 77 EGYPT NEXT GENERATION PACKAGING MARKET, BY MATERIAL, 2020-2029 (USD MILLION)
TABLE 78 EGYPT NEXT GENERATION PACKAGING MARKET, BY APPLICATION, 2020-2029 (USD MILLION)
TABLE 79 EGYPT FOOD IN NEXT GENERATION PACKAGING MARKET, BY APPLICATION, 2020-2029 (USD MILLION)
TABLE 80 EGYPT PROCESSED FOOD IN NEXT GENERATION PACKAGING MARKET, BY APPLICATION, 2020-2029 (USD MILLION)
TABLE 81 EGYPT BEVERAGES IN NEXT GENERATION PACKAGING MARKET, BY APPLICATION, 2020-2029 (USD MILLION)
TABLE 82 ISRAEL NEXT GENERATION PACKAGING MARKET, BY TYPE, 2020-2029 (USD MILLION)
TABLE 83 ISRAEL ACTIVE PACKAGING IN NEXT GENERATION PACKAGING MARKET, BY TYPE, 2020-2029 (USD MILLION)
TABLE 84 ISRAEL NEXT GENERATION PACKAGING MARKET, BY FUNCTION, 2020-2029 (USD MILLION)
TABLE 85 ISRAEL NEXT GENERATION PACKAGING MARKET, BY TECHNOLOGY, 2020-2029 (USD MILLION)
TABLE 86 ISRAEL NEXT GENERATION PACKAGING MARKET, BY MATERIAL, 2020-2029 (USD MILLION)
TABLE 87 ISRAEL NEXT GENERATION PACKAGING MARKET, BY APPLICATION, 2020-2029 (USD MILLION)
TABLE 88 ISRAEL FOOD IN NEXT GENERATION PACKAGING MARKET, BY APPLICATION, 2020-2029 (USD MILLION)
TABLE 89 ISRAEL PROCESSED FOOD IN NEXT GENERATION PACKAGING MARKET, BY APPLICATION, 2020-2029 (USD MILLION)
TABLE 90 ISRAEL BEVERAGES IN NEXT GENERATION PACKAGING MARKET, BY APPLICATION, 2020-2029 (USD MILLION)
TABLE 91 REST OF MIDDLE EAST & AFRICA NEXT GENERATION PACKAGING MARKET, BY TYPE, 2020-2029 (USD MILLION)
List of Figure
FIGURE 1 MIDDLE EAST & AFRICA NEXT GENERATION PACKAGING MARKET: SEGMENTATION
FIGURE 2 MIDDLE EAST & AFRICA NEXT GENERATION PACKAGING MARKET: DATA TRIANGULATION
FIGURE 3 MIDDLE EAST & AFRICA NEXT GENERATION PACKAGING MARKET: DROC ANALYSIS
FIGURE 4 MIDDLE EAST & AFRICA NEXT GENERATION PACKAGING MARKET: MIDDLE EAST & AFRICA VS REGIONAL MARKET ANALYSIS
FIGURE 5 MIDDLE EAST & AFRICA NEXT GENERATION PACKAGING MARKET: COMPANY RESEARCH ANALYSIS
FIGURE 6 MIDDLE EAST & AFRICA NEXT GENERATION PACKAGING MARKET: INTERVIEW DEMOGRAPHICS
FIGURE 7 MIDDLE EAST & AFRICA NEXT GENERATION PACKAGING MARKET: DBMR MARKET POSITION GRID
FIGURE 8 MIDDLE EAST & AFRICA NEXT GENERATION PACKAGING MARKET: VENDOR SHARE ANALYSIS
FIGURE 9 MIDDLE EAST & AFRICA NEXT GENERATION PACKAGING MARKET: SEGMENTATION
FIGURE 10 ASIA-PACIFIC IS EXPECTED TO DOMINATE MIDDLE EAST & AFRICA NEXT GENERATION PACKAGING MARKET AND IS EXPECTED TO GROW WITH HIGHEST CAGR IN FORECAST PERIOD OF 2022 TO 2029
FIGURE 11 AN INCREASE IN CONSUMPTION OF BEVERAGES AND HEALTH AWARENESS AMONG CONSUMERS IS EXPECTED TO DRIVE MIDDLE EAST & AFRICA NEXT GENERATION PACKAGING MARKET IN THE FORECAST PERIOD OF 2022 TO 2029
FIGURE 12 PACKAGING TYPE SEGMENT IS EXPECTED TO ACCOUNT FOR LARGEST SHARE OF MIDDLE EAST & AFRICA NEXT GENERATION PACKAGING MARKET IN 2022 & 2029
FIGURE 13 DRIVERS, RESTRINTS, OPPORTUNITIES AND CHALLENGES OF MIDDLE EAST & AFRICA NEXT GENERATION PACKAGING MARKET
FIGURE 14 MIDDLE EAST & AFRICA NEXT GENERATION PACKAGING MARKET, BY TYPE, 2021
FIGURE 15 MIDDLE EAST & AFRICA NEXT GENERATION PACKAGING MARKET, BY FUNCTION, 2021
FIGURE 16 MIDDLE EAST & AFRICA NEXT GENERATION PACKAGING MARKET, BY TECHNOLOGY, 2021
FIGURE 17 MIDDLE EAST & AFRICA NEXT GENERATION PACKAGING MARKET, BY MATERIAL, 2021
FIGURE 18 MIDDLE EAST & AFRICA NEXT GENERATION MARKET, BY APPLICATION, 2021
FIGURE 19 MIDDLE EAST AND AFRICA NEXT GENERATION PACKAGING MARKET: SNAPSHOT (2021)
FIGURE 20 MIDDLE EAST AND AFRICA NEXT GENERATION PACKAGING MARKET: BY COUNTRY (2021)
FIGURE 21 MIDDLE EAST AND AFRICA NEXT GENERATION PACKAGING MARKET: BY COUNTRY (2022 & 2029)
FIGURE 22 MIDDLE EAST AND AFRICA NEXT GENERATION PACKAGING MARKET: BY COUNTRY (2021 & 2029)
FIGURE 23 MIDDLE EAST AND AFRICA NEXT GENERATION PACKAGING MARKET: BY TYPE (2022 & 2029)
FIGURE 24 MIDDLE EAST & AFRICA NEXT GENERATION PACKAGING MARKET: COMPANY SHARE 2021 (%)
Middle East And Africa Next Generation Packaging Market, Supply Chain Analysis and Ecosystem Framework
To support market growth and help clients navigate the impact of geopolitical shifts, DBMR has integrated in-depth supply chain analysis into its Middle East And Africa Next Generation Packaging Market research reports. This addition empowers clients to respond effectively to global changes affecting their industries. The supply chain analysis section includes detailed insights such as Middle East And Africa Next Generation Packaging Market consumption and production by country, price trend analysis, the impact of tariffs and geopolitical developments, and import and export trends by country and HSN code. It also highlights major suppliers with data on production capacity and company profiles, as well as key importers and exporters. In addition to research, DBMR offers specialized supply chain consulting services backed by over a decade of experience, providing solutions like supplier discovery, supplier risk assessment, price trend analysis, impact evaluation of inflation and trade route changes, and comprehensive market trend analysis.
Data collection and base year analysis are done using data collection modules with large sample sizes. The stage includes obtaining market information or related data through various sources and strategies. It includes examining and planning all the data acquired from the past in advance. It likewise envelops the examination of information inconsistencies seen across different information sources. The market data is analysed and estimated using market statistical and coherent models. Also, market share analysis and key trend analysis are the major success factors in the market report. To know more, please request an analyst call or drop down your inquiry.
The key research methodology used by DBMR research team is data triangulation which involves data mining, analysis of the impact of data variables on the market and primary (industry expert) validation. Data models include Vendor Positioning Grid, Market Time Line Analysis, Market Overview and Guide, Company Positioning Grid, Patent Analysis, Pricing Analysis, Company Market Share Analysis, Standards of Measurement, Global versus Regional and Vendor Share Analysis. To know more about the research methodology, drop in an inquiry to speak to our industry experts.
Data Bridge Market Research is a leader in advanced formative research. We take pride in servicing our existing and new customers with data and analysis that match and suits their goal. The report can be customized to include price trend analysis of target brands understanding the market for additional countries (ask for the list of countries), clinical trial results data, literature review, refurbished market and product base analysis. Market analysis of target competitors can be analyzed from technology-based analysis to market portfolio strategies. We can add as many competitors that you require data about in the format and data style you are looking for. Our team of analysts can also provide you data in crude raw excel files pivot tables (Fact book) or can assist you in creating presentations from the data sets available in the report.


