
Middle East And Africa Operational Technology Market
Market Size in USD Billion
 USD
3.49 Billion
USD
5.65 Billion
2024
2032
USD
3.49 Billion
USD
5.65 Billion
2024
2032
| 2025 - 2032 | |
| USD 3.49 Billion | |
| USD 5.65 Billion | |
| % | |
|
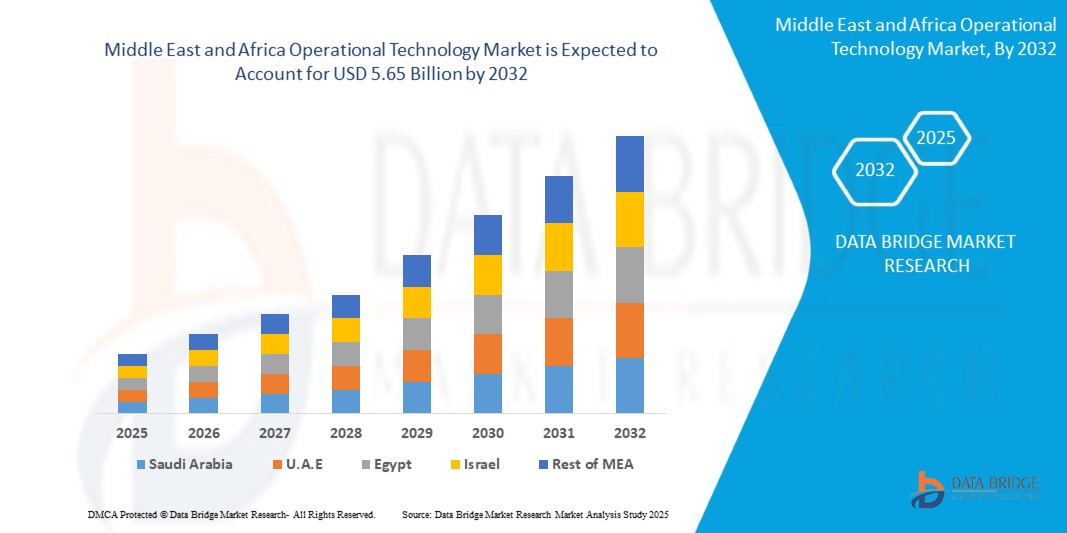
Middle East and Africa Operational Technology Market Size
- The Middle East and Africa operational technology market size was valued at USD 3.49 billion in 2024 and is expected to reach USD 5.65 billion by 2032, at a CAGR of 6.20% during the forecast period
- The market growth is largely fuelled by increasing digital transformation initiatives across industries, growing investments in smart infrastructure, and rising demand for automation and real-time monitoring solutions in sectors such as oil & gas, manufacturing, and utilities
- In addition, expanding adoption of Internet of Things (IoT) technologies and cloud computing in industrial environments is enhancing operational visibility and predictive maintenance capabilities, further propelling market growth
Middle East and Africa Operational Technology Market Analysis
- The Middle East and Africa region is witnessing accelerated adoption of operational technology due to the need for enhanced operational efficiency and safety in critical infrastructure
- Growing government focus on Industry 4.0 and smart city projects is driving the integration of OT systems with IT to enable better control and decision-making processes
- Saudi Arabia dominates the Middle East and Africa operational technology market in 2024, driven by significant investments in oil and gas infrastructure modernization, renewable energy projects, and industrial automation
- South Africa is expected to witness the highest compound annual growth rate (CAGR) in the Middle East and Africa operational technology market due to increasing industrialization and adoption of advanced automation technologies. Government support for smart infrastructure and digitalization projects is also fueling rapid market expansion
- The hardware segment dominated the market with the largest revenue share in 2024, driven by the critical role physical devices play in operational infrastructure and the growing investments in upgrading industrial equipment. The demand for advanced sensors, controllers, and networking devices remains high due to the increasing need for robust and reliable operational environments
Report Scope and Middle East and Africa Operational Technology Market Segmentation
|
Attributes |
Middle East and Africa Operational Technology Key Market Insights |
|
Segments Covered |
|
|
Countries Covered |
Middle East and Africa
|
|
Key Market Players |
|
|
Market Opportunities |
|
|
Value Added Data Infosets |
In addition to the insights on market scenarios such as market value, growth rate, segmentation, geographical coverage, and major players, the market reports curated by the Data Bridge Market Research also include in-depth expert analysis, geographically represented company-wise production and capacity, network layouts of distributors and partners, detailed and updated price trend analysis and deficit analysis of supply chain and demand. |
Middle East and Africa Operational Technology Market Trends
“Increasing Adoption of Industrial Internet of Things (IIoT) in OT Systems”
- Increasing adoption of Industrial Internet of Things (IIoT) is driving real-time monitoring and predictive maintenance across industrial sectors in the Middle East and Africa. This enhances operational efficiency by minimizing unplanned downtime and optimizing equipment usage, allowing companies to reduce costs and improve productivity. The growing reliance on IIoT technologies is transforming traditional operational technology landscapes into more intelligent, connected systems
- Governments in the region are actively supporting digital transformation initiatives such as smart cities and Industry 4.0 strategies. These programs encourage the modernization of OT infrastructure across key industries, fostering innovation and improving competitiveness. Public-private partnerships and policy support are crucial in accelerating the deployment of advanced OT solutions throughout the Middle East and Africa
- Integration of IIoT with existing OT systems enables enhanced data analytics for smarter decision-making and resource optimization. This integration helps businesses leverage historical and real-time data to improve process control, asset management, and supply chain resilience. The ability to connect legacy systems with new technologies is vital for maximizing operational value and future-proofing investments
- For instance, Saudi Arabia’s Vision 2030 incorporates OT upgrades as a key component of its digital infrastructure goals. The initiative focuses on deploying advanced technologies to modernize industries and promote sustainable growth. This strategic plan exemplifies the region’s commitment to transforming OT environments and boosting economic diversification
- The Middle East and Africa operational technology market is poised for robust growth fueled by IIoT adoption and strong government initiatives. However, successful integration and continued investment in smart OT systems are essential to unlock the full potential of digital transformation across industries and ensure long-term competitiveness
Middle East and Africa Operational Technology Market Dynamics
Driver
“Rising Digital Transformation Initiatives in Key Industries”
- Rising digital transformation initiatives in key industries are accelerating operational technology adoption across the Middle East and Africa. This surge is driven by sectors such as oil and gas, utilities, manufacturing, and transportation investing heavily in OT to enhance efficiency, safety, and regulatory compliance. These efforts help companies optimize asset performance while minimizing costly unplanned downtime
- Digital tools including automation systems, real-time analytics, and Internet of Things (IoT) devices are empowering companies to improve operational processes and reduce costs. By providing enhanced visibility and control, these technologies enable predictive maintenance and streamlined operations, which boost productivity and asset utilization across diverse industries
- Regional governments are promoting smart infrastructure projects and Industry 4.0 adoption through supportive policies and funding. Such initiatives act as powerful catalysts for accelerating OT market growth by encouraging widespread modernization and technology integration, fostering innovation, and enhancing the competitive landscape
- For instance, several Middle Eastern countries have launched national programs focused on digital industry transformation and smart city developments. These government-backed efforts demonstrate a strong commitment to driving OT adoption, supporting sustainable growth, and improving operational capabilities across multiple sectors
- The convergence of industrial modernization, government backing, and technological progress is fueling robust growth in operational technology adoption across the Middle East and Africa. Sustained investments and strategic collaborations will be crucial to harness the full potential of this expanding market
Restraint/Challenge
“Cybersecurity Concerns and Vulnerabilities in Operational Technology Systems”
- Cybersecurity concerns and vulnerabilities in operational technology systems present significant challenges to market growth in the Middle East and Africa. As OT environments integrate more with IT networks and Internet of Things (IoT) devices, the risk of cyberattacks targeting critical infrastructure intensifies, threatening operational continuity and security
- Many organizations struggle with implementing effective cybersecurity due to limited skilled personnel, legacy systems, and insufficient investment in security technologies. These gaps increase vulnerability to attacks, which can cause operational disruptions, financial losses, and damage to corporate reputations across industries
- Evolving regulatory compliance around cybersecurity adds complexity and uncertainty for companies navigating the OT landscape. Compliance burdens and the need for constant updates can slow adoption rates as firms balance innovation with security requirements and legal obligations
- For instance, several recent cyberattacks on critical infrastructure in the region have highlighted the need for enhanced OT security measures, prompting governments and businesses to reassess their cyber defense strategies. This growing awareness is driving demand for advanced security solutions but also exposing current gaps
- Without strengthened cybersecurity frameworks, increased awareness, and investment in skilled resources, the Middle East and Africa operational technology market may face slower growth despite rising demand for digital transformation and OT adoption
Middle East and Africa Operational Technology Market Scope
The market is segmented on the basis of component, deployment, organization size, connectivity, technology, and end-user.
• By Component
On the basis of component, the Middle East and Africa operational technology market is segmented into human-machine interface, control systems, hardware, software/platform, and services. The hardware segment dominated the market with the largest revenue share in 2024, driven by the critical role physical devices play in operational infrastructure and the growing investments in upgrading industrial equipment. The demand for advanced sensors, controllers, and networking devices remains high due to the increasing need for robust and reliable operational environments.
The software/platform segment is expected to witness the fastest growth rate from 2025 to 2032, fueled by rising adoption of cloud-based analytics and digital twins that enhance operational visibility and predictive maintenance capabilities across industries.
• By Deployment
On the basis of deployment, the market is segmented into on-premise, hybrid, and cloud. The on-premise segment held the largest market share in 2024, owing to the preference for localized control and security among industries such as oil and gas and manufacturing, where sensitive data and critical operations require stringent protections.
The cloud deployment segment is expected to witness the fastest growth rate from 2025 to 2032, driven by increased adoption of remote monitoring, scalability benefits, and integration with Internet of Things platforms across emerging sectors in the region.
• By Organization Size
On the basis of organization size, the market is divided into small and medium-sized businesses and large enterprises. Large enterprises dominated the market in 2024 due to their higher investments in automation and operational efficiency technologies, along with greater capacity to adopt comprehensive operational technology solutions.
Small and medium-sized businesses is expected to witness the fastest growth rate from 2025 to 2032 owing to increasing awareness and the availability of cost-effective operational technology solutions tailored to their scale.
• By Connectivity
On the basis of connectivity, the market is segmented into wired and wireless. The wired segment accounted for the larger revenue share in 2024, supported by its reliability and security in critical infrastructure settings such as energy and utilities and manufacturing plants.
The wireless segment is expected to witness the fastest growth rate from 2025 to 2032, driven by advancements in wireless protocols and the need for flexible, scalable operational technology deployments, especially in sectors such as building automation and transportation.
• By Technology
On the basis of technology, the market is categorized into supervisory control and data acquisition, distributed control systems, process control domains, programmable logic controllers, safety instrumented systems, and building management/automation systems. Supervisory control and data acquisition held the largest market share in 2024 due to its extensive use in managing and monitoring large-scale industrial processes.
Programmable logic controllers is expected to witness the fastest growth rate from 2025 to 2032, fueled by their critical role in automation and ease of integration with modern control systems across various industries.
• By End-User
On the basis of end-user, the market is segmented into automotive and transportation, building and infrastructure, energy and utilities, food and beverage, life sciences, marine and ports, metals and mining, oil and gas, chemicals, pulp and paper, pharmaceuticals, aerospace and defense, machine manufacturing, and others. The energy and utilities segment dominated the market in 2024 due to ongoing infrastructure development and modernization efforts in the region
The building and infrastructure sector is expected to witness the fastest growth rate from 2025 to 2032, supported by rapid urbanization and increasing investments in smart city initiatives across the Middle East and Africa.
Middle East and Africa Operational Technology Market Regional Analysis
- Saudi Arabia dominates the Middle East and Africa operational technology market in 2024, driven by significant investments in oil and gas infrastructure modernization, renewable energy projects, and industrial automation
- The government’s Vision 2030 initiative is playing a pivotal role in accelerating digital transformation and operational technology adoption, especially in sectors such as energy, manufacturing, and transportation
- The country’s focus on enhancing industrial safety, process efficiency, and smart city development is expected to sustain strong market growth during the forecast period
South Africa Operational Technology Market Insight
South Africa is expected to witness the fastest growth rate from 2025 to 2032, supported by increasing industrialization and infrastructure development. The demand for operational technology solutions is rising due to the need for improved process control, automation, and enhanced safety measures in sectors such as mining, manufacturing, and energy. The growth is further fueled by government initiatives promoting digital transformation and smart infrastructure projects, enabling the rapid adoption of advanced operational technologies across the country.
Middle East and Africa Operational Technology Market Share
The Middle East and Africa Operational Technology industry is primarily led by well-established companies, including:
- Advanced Electronics Company (Saudi Arabia)
- Arabian Automation & Control (Saudi Arabia)
- El Sewedy Electric (Egypt)
- Alfanar Company (Saudi Arabia)
- Mott MacDonald Middle East (U.A.E)
- Powertech Systems (South Africa)
- Metito (U.A.E)
- AECOM Middle East (U.A.E)
- NetSys Technologies (South Africa)
- Tatweer Research (U.A.E)
Latest Developments in Middle East and Africa Operational Technology Market
- In April 2021, SAP SE formed a strategic partnership with Onapsis to tackle the increasing cybersecurity challenges faced by multiple industries. This collaboration focuses on delivering specialized solutions designed to reduce the risks and impact of cyber threats on critical infrastructure and buildings. By combining their expertise, both companies aim to enhance security measures, expand their market presence, and provide stronger protection for enterprise systems. This partnership is expected to drive growth in the cybersecurity market by addressing evolving threats more effectively.
SKU-

- Interactive Data Analysis Dashboard
- Company Analysis Dashboard for high growth potential opportunities
- Research Analyst Access for customization & queries
- Competitor Analysis with Interactive dashboard
- Latest News, Updates & Trend analysis
- Harness the Power of Benchmark Analysis for Comprehensive Competitor Tracking
Middle East And Africa Operational Technology Market, Supply Chain Analysis and Ecosystem Framework
To support market growth and help clients navigate the impact of geopolitical shifts, DBMR has integrated in-depth supply chain analysis into its Middle East And Africa Operational Technology Market research reports. This addition empowers clients to respond effectively to global changes affecting their industries. The supply chain analysis section includes detailed insights such as Middle East And Africa Operational Technology Market consumption and production by country, price trend analysis, the impact of tariffs and geopolitical developments, and import and export trends by country and HSN code. It also highlights major suppliers with data on production capacity and company profiles, as well as key importers and exporters. In addition to research, DBMR offers specialized supply chain consulting services backed by over a decade of experience, providing solutions like supplier discovery, supplier risk assessment, price trend analysis, impact evaluation of inflation and trade route changes, and comprehensive market trend analysis.
Data collection and base year analysis are done using data collection modules with large sample sizes. The stage includes obtaining market information or related data through various sources and strategies. It includes examining and planning all the data acquired from the past in advance. It likewise envelops the examination of information inconsistencies seen across different information sources. The market data is analysed and estimated using market statistical and coherent models. Also, market share analysis and key trend analysis are the major success factors in the market report. To know more, please request an analyst call or drop down your inquiry.
The key research methodology used by DBMR research team is data triangulation which involves data mining, analysis of the impact of data variables on the market and primary (industry expert) validation. Data models include Vendor Positioning Grid, Market Time Line Analysis, Market Overview and Guide, Company Positioning Grid, Patent Analysis, Pricing Analysis, Company Market Share Analysis, Standards of Measurement, Global versus Regional and Vendor Share Analysis. To know more about the research methodology, drop in an inquiry to speak to our industry experts.
Data Bridge Market Research is a leader in advanced formative research. We take pride in servicing our existing and new customers with data and analysis that match and suits their goal. The report can be customized to include price trend analysis of target brands understanding the market for additional countries (ask for the list of countries), clinical trial results data, literature review, refurbished market and product base analysis. Market analysis of target competitors can be analyzed from technology-based analysis to market portfolio strategies. We can add as many competitors that you require data about in the format and data style you are looking for. Our team of analysts can also provide you data in crude raw excel files pivot tables (Fact book) or can assist you in creating presentations from the data sets available in the report.


