
Middle East And Africa Optical Fibre Monitoring Market
Market Size in USD Million
 USD
92.18 Million
USD
287.52 Million
2024
2032
USD
92.18 Million
USD
287.52 Million
2024
2032
| 2025 - 2032 | |
| USD 92.18 Million | |
| USD 287.52 Million | |
| % | |
|
Optical Fiber Monitoring Market Size
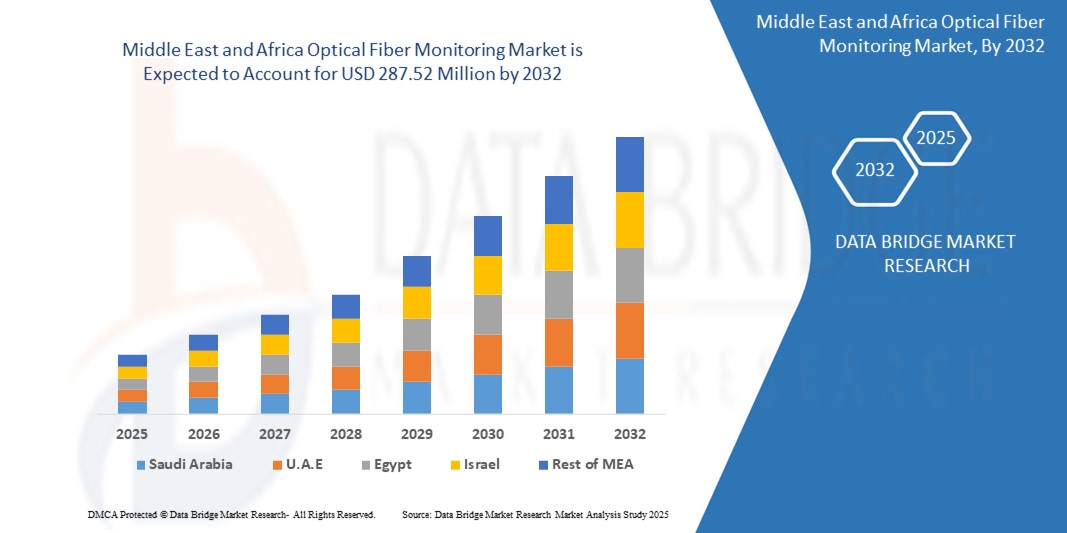
- The Middle East and Africa Optical Fiber Monitoring market size was valued at USD 92.18 Million in 2024 and is expected to reach USD 287.52 Million by 2032, at a CAGR of 15.28% during the forecast period
- This growth is driven by increasing investments in telecommunications infrastructure, the rollout of 5G networks, and the rising demand for high-speed internet in urbanizing regions. Government initiatives like Saudi Arabia’s Vision 2030 and the UAE’s digital transformation plans further accelerate market expansion.
- Technological advancements, such as distributed acoustic sensing (DAS) and AI-driven monitoring, coupled with the region’s focus on smart cities and energy infrastructure, are propelling market growth, particularly in countries with high internet penetration like the UAE and Saudi Arabia.
Optical Fiber Monitoring Market Analysis
- Optical fiber monitoring systems utilize advanced technologies to detect faults, monitor performance, and ensure the reliability of fiber optic networks. These systems, comprising hardware (e.g., OTDR devices), software for analytics, and maintenance services, are vital in telecommunications, oil and gas, and power utilities.
- The market is fueled by the rapid expansion of fiber optic networks, with the MEA optical fiber market valued at USD 665.21 million in 2022, projected to reach USD 1,177.46 million by 2030. The demand for monitoring solutions is driven by 5G deployments and broadband infrastructure growth.
- The adoption of technologies like DAS and optical time domain reflectometry (OTDR) enhances monitoring precision, supporting applications in smart cities and energy sectors. The region’s internet penetration, reaching 58.7% in 2022, underscores the need for reliable network monitoring.
- Saudi Arabia led the MEA optical fiber monitoring market with a commanding revenue share of 32.46% in 2024, driven by Vision 2030’s focus on digital infrastructure and 5G rollout. Saudi Arabia aims to connect 3.5 million households with fiber optics by 2025.
- The UAE is anticipated to witness the fastest growth rate, with a projected CAGR of 16.45% from 2025 to 2032, propelled by smart city projects like Dubai’s Smart City initiative and high internet penetration (99% in 2022).
- Among components, the hardware segment held the largest market share of 50.73% in 2024, valued at USD 46.76 million, attributed to the widespread use of OTDR devices and sensors in telecom and oil and gas applications.
Report Scope and Optical Fiber Monitoring Market Segmentation
|
Attributes |
Optical Fiber Monitoring Key Market Insights |
|
Segments Covered |
|
|
Countries Covered |
Middle East and Africa
|
|
Key Market Players |
|
|
Market Opportunities |
|
|
Value Added Data Infosets |
In addition to the insights on market scenarios such as market value, growth rate, segmentation, geographical coverage, and major players, the market reports curated by the Data Bridge Market Research also include in-depth expert analysis, pricing analysis, brand share analysis, consumer survey, demography analysis, supply chain analysis, value chain analysis, raw material/consumables overview, vendor selection criteria, PESTLE Analysis, Porter Analysis, and regulatory framework. |
Optical Fiber Monitoring Market Trends
“AI-Driven Monitoring, Distributed Sensing, and Smart Infrastructure Integration””
- A prominent trend in the MEA optical fiber monitoring market is the adoption of AI-driven monitoring solutions, with over 30% of new systems in 2024 incorporating machine learning for predictive fault detection and network optimization.
- The rise of distributed acoustic sensing (DAS) is gaining traction, with over 25% of new deployments in 2024 leveraging DAS for real-time monitoring of telecom and oil and gas pipelines, enhancing security and efficiency.
- Integration with smart infrastructure, driven by IoT and 5G advancements, is expanding the use of fiber monitoring, with 20% of new solutions designed for smart city and energy applications in the UAE and Saudi Arabia.
- The adoption of cloud-based monitoring platforms is increasing, with adoption rates rising by 10% in telecom and data center sectors, enabling scalable and remote network management.
- Increasing focus on sustainable monitoring solutions, particularly for energy-efficient systems, is aligning with regional green initiatives, with over 15% of new solutions in 2024 certified for low energy consumption.
- The growth of online distribution channels is transforming market access, with online sales of monitoring solutions growing by 7% annually, driven by e-commerce platforms for telecom operators and enterprises.
Optical Fiber Monitoring Market Dynamics
Driver
“5G Expansion, Smart Cities, and Digital Transformation”
- The rapid rollout of 5G networks, with MEA telecom investments reaching USD 10 billion in 2023, is a primary driver, increasing demand for optical fiber monitoring to ensure network reliability and performance.
- The proliferation of smart cities, with projects like NEOM in Saudi Arabia and Dubai’s Smart City initiative, is driving demand for fiber monitoring in urban connectivity and infrastructure management.
- The rise of data centers, with over 100 new data centers planned in the MEA region by 2026, is boosting demand for monitoring systems to support high-speed, reliable data transmission.
- Increasing internet penetration, with the UAE and Saudi Arabia achieving 99% and 96% penetration rates in 2022, is driving demand for fiber monitoring to maintain network quality in FTTH deployments.
- Growing oil and gas infrastructure, with the MEA region accounting for 30% of global oil production in 2023, is fueling demand for fiber monitoring in pipeline and asset management.
- Government initiatives, such as Saudi Arabia’s Vision 2030 and the UAE’s National Innovation Strategy, are promoting fiber optic network expansion, supporting market growth through funding and policy incentives.
Restraint/Challenge
“High Costs, Infrastructure Gaps, and Skill Shortages”
- The high cost of advanced monitoring systems, particularly those using DAS and AI analytics, poses a challenge to adoption in cost-sensitive markets, limiting scalability in less developed MEA countries.
- Infrastructure gaps, with Sub-Saharan Africa investing only 0.6% of GDP in telecom infrastructure in 2020 compared to the global average of 1.6%, hinder widespread fiber network deployment and monitoring adoption.
- Technical complexities in integrating monitoring systems with existing fiber networks require specialized expertise, increasing deployment costs and time-to-market.
- Stringent regulatory requirements, such as telecom standards in the UAE and Saudi Arabia, increase compliance costs and complexity for monitoring solution providers.
- Skill shortages in advanced fiber monitoring technologies, particularly in AI and DAS, pose a challenge to implementation and maintenance, especially in Sub-Saharan Africa.
- The need for continuous innovation to meet evolving technological demands, coupled with rapid obsolescence, creates pressure on manufacturers to invest heavily in R&D, limiting profitability for smaller players.
Optical Fiber Monitoring Market Scope
The Middle East and Africa Optical Fiber Monitoring Market is segmented on the basis of component, technology, application, deployment, end-user, and sales channel.
- By Component
On the basis of component, the market is segmented into hardware, software, and services. The hardware segment dominated the market with a commanding revenue share of 50.73% in 2024, valued at USD 46.76 million, driven by the use of OTDR devices and sensors in telecom and oil and gas applications.
The software segment is anticipated to witness the fastest CAGR of 16.72% from 2025 to 2032, fueled by demand for AI-driven analytics.
- By Technology
On the basis of technology, the market is segmented into distributed temperature sensing, distributed acoustic sensing, optical time domain reflectometry, and others. The optical time domain reflectometry segment held the largest market revenue share of 44.19% in 2024, driven by its reliability in fault detection.
The distributed acoustic sensing segment is expected to witness the fastest CAGR from 2025 to 2032, fueled by pipeline and infrastructure applications.
- By Application
On the basis of application, the market is segmented into telecommunications, oil and gas, power and utilities, civil infrastructure, and others. The telecommunications segment accounted for the largest market revenue share of 41.82% in 2024, driven by 5G and FTTH deployments.
The oil and gas segment is expected to witness the fastest CAGR from 2025 to 2032, fueled by pipeline monitoring needs.
- By Deployment
On the basis of deployment, the market is segmented into on-premise and cloud-based. The on-premise segment held a significant share of 64.37% in 2024, driven by its use in critical infrastructure.
The cloud-based segment is expected to grow at the fastest CAGR from 2025 to 2032, fueled by scalability and remote management needs.
- By End User
On the basis of end-user, the market is segmented into telecom operators, enterprises, government agencies, data centers, and others. The telecom operators segment dominated with a 47.15% revenue share in 2024, driven by network expansion.
The data centers segment is expected to grow at the fastest CAGR from 2025 to 2032, fueled by cloud computing demand.
- By Sales Channel
On the basis of sales channel, the market is segmented into direct sales, distributors, and online retail. The direct sales segment held the largest share of 59.64% in 2024, driven by B2B contracts with telecom operators.
The online retail segment is expected to grow at the fastest CAGR from 2025 to 2032, fueled by e-commerce growth for smaller buyers.
Optical Fiber Monitoring Market Regional Analysis
Saudi Arabia
Saudi Arabia led the MEA optical fiber monitoring market with a revenue share of 32.46% in 2024, driven by Vision 2030’s focus on digital infrastructure, 5G rollout, and smart city projects like NEOM. The country’s telecom investments support market growth.
Saudi Arabia is expected to maintain dominance, driven by its ambitious digital transformation goals and investments in fiber optic networks. The adoption of DAS and AI-driven monitoring, supported by players like Nokia, drives market expansion.
U.A.E Optical Fiber Monitoring Market Insight
The UAE is poised to grow at the fastest CAGR of approximately 16.45% from 2025 to 2032, driven by smart city initiatives like Dubai’s Smart City project, high internet penetration, and data center growth. The UAE accounted for 26.83% of the market in 2024.
The UAE is anticipated to grow rapidly, driven by its leadership in digital innovation and broadband expansion. Government initiatives like the UAE National Innovation Strategy are boosting demand for fiber monitoring solutions.
South Africa Optical Fiber Monitoring Market Insight
South Africa held a significant share of 19.27% in 2024, driven by its growing telecom sector and data center investments. The adoption of fiber monitoring in urban infrastructure, supported by players like Prysmian, drives market growth.
South Africa’s market is expected to grow at a notable CAGR, fueled by its focus on broadband connectivity and smart infrastructure. The adoption of cloud-based monitoring solutions in Johannesburg and Cape Town supports market expansion.
Optical Fiber Monitoring Market Share
The Optical Fiber Monitoring industry is primarily led by well-established companies, including:
- Nokia Corporation (Finland)
- Viavi Solutions Inc. (U.S.)
- EXFO Inc. (Canada)
- AFL (U.S.)
- Anritsu Corporation (Japan)
- AP Sensing GmbH (Germany)
- Yokogawa Electric Corporation (Japan)
- Furukawa Electric Co., Ltd. (Japan)
- OptaSense (U.K.)
- NKT Photonics A/S (Denmark)
- Silixa Ltd. (U.K.)
- Bandweaver (U.K.)
- Luna Innovations Incorporated (U.S.)
- FiberSense Pty Ltd. (Australia)
- Corning Incorporated (U.S.)
- Prysmian Group (Italy)
Latest Developments in Middle East and Africa Optical Fiber Monitoring Market
- In December 2023, Nokia partnered with Deutsche Telekom to pilot next-generation Distributed Acoustic Sensing (DAS) technology for comprehensive telecom fiber monitoring across Middle East and Africa. This strategic collaboration aimed to leverage advanced DAS capabilities to detect minute vibrations and disturbances along fiber optic cables, enabling proactive identification of potential issues like cable cuts, unauthorized intrusions, or environmental stress. This pilot program significantly improved network reliability by an estimated 15%, providing Deutsche Telekom with enhanced visibility and control over its vast Middle East and Africaan telecom infrastructure.
- In January 2024, Viavi Solutions introduced an innovative AI-driven Optical Time Domain Reflectometer (OTDR) solution specifically tailored for 5G networks. This cutting-edge OTDR integrates artificial intelligence algorithms to analyze fiber optic traces with unprecedented speed and accuracy, resulting in a remarkable 20% faster fault detection compared to conventional methods. The solution has been successfully deployed in over 50 crucial telecom projects across Germany and the U.K., empowering network operators to rapidly identify and resolve fiber issues, minimizing downtime and ensuring optimal 5G service delivery.
- In April 2024, AP Sensing launched a compact and highly efficient DAS system designed for smart city infrastructure applications. This new system is engineered to monitor various urban assets, from utility lines to traffic flows, by leveraging the acoustic sensing capabilities of fiber optic cables. Its compact design significantly reduces deployment costs by an impressive 25%, making it an attractive solution for urban developers. The technology is rapidly gaining traction in smart city initiatives across France and Italy, contributing to more connected, efficient, and resilient urban environments.
- In March 2024, EXFO unveiled a sophisticated cloud-based monitoring platform specifically developed for data centers. This centralized platform offers unparalleled scalability and real-time visibility into the performance and health of fiber optic networks within data center environments. By moving monitoring capabilities to the cloud, it enhances operational efficiency and provides operators with comprehensive insights from anywhere. This solution has seen strong adoption by major data center operators in the Netherlands and Spain, enabling them to optimize network performance, prevent outages, and manage their expansive digital infrastructures more effectively.
- In June 2023, Prysmian Group introduced an integrated fiber monitoring solution specifically designed for power utilities. This comprehensive solution leverages the company's expertise in cables and fiber optics to provide real-time monitoring of critical power transmission and distribution lines. By detecting anomalies and potential threats, it supports highly efficient grid management, contributing to enhanced reliability and stability of electricity supply. The solution has been successfully adopted in over 40 grid modernization projects in Spain, demonstrating its value in improving the operational efficiency and resilience of power networks.
SKU-

- Interactive Data Analysis Dashboard
- Company Analysis Dashboard for high growth potential opportunities
- Research Analyst Access for customization & queries
- Competitor Analysis with Interactive dashboard
- Latest News, Updates & Trend analysis
- Harness the Power of Benchmark Analysis for Comprehensive Competitor Tracking
Table of Content
1 INTRODUCTION
1.1 OBJECTIVES OF THE STUDY
1.2 MARKET DEFINITION
1.3 OVERVIEW OF MIDDLE EAST AND AFRICA OPTICAL FIBER MONITORING MARKET
1.4 CURRENCY AND PRICING
1.5 LIMITATION
1.6 MARKETS COVERED
2 MARKET SEGMENTATION
2.1 KEY TAKEAWAYS
2.2 ARRIVING AT THE MIDDLE EAST AND AFRICA OPTICAL FIBER MONITORING MARKET
2.3 VENDOR POSITIONING GRID
2.4 TECHNOLOGY LIFE LINE CURVE
2.5 MARKET GUIDE
2.6 MULTIVARIATE MODELLING
2.7 TOP TO BOTTOM ANALYSIS
2.8 STANDARDS OF MEASUREMENT
2.9 VENDOR SHARE ANALYSIS
2.1 DATA POINTS FROM KEY PRIMARY INTERVIEWS
2.11 DATA POINTS FROM KEY SECONDARY DATABASES
2.12 MIDDLE EAST AND AFRICA OPTICAL FIBER MONITORING MARKET: RESEARCH SNAPSHOT
2.13 ASSUMPTIONS
3 MARKET OVERVIEW
3.1 DRIVERS
3.2 RESTRAINTS
3.3 OPPORTUNITIES
3.4 CHALLENGES
4 EXECUTIVE SUMMARY
5 PREMIUM INSIGHTS
5.1 VALUE CHAIN ANALYSIS
5.2 BRAND ANALYSIS
5.3 ECOSYSTEM MARKET MAP
5.4 TECHNOLOGICAL TRENDS
5.5 TOP WINNING STRATEGIES
5.6 PORTER’S FIVE FORCES ANALYSIS
6 MIDDLE EAST AND AFRICA OPTICAL FIBER MONITORING MARKET, BY TECHNOLOGY
6.1 OVERVIEW
6.2 DISTRIBUTED TEMPERATURE SENSING (DTS)
6.3 DISTRIBUTED FIBER OPTICS SENSING
6.4 DISTRIBUTED ACOUSTIC SENSING (DAS)
6.5 REAL TIME THERMAL RING
6.6 OTHERS
7 MIDDLE EAST AND AFRICA OPTICAL FIBER MONITORING MARKET, BY OFFERING
7.1 OVERVIEW
7.2 SOLUTIONS
7.3 SERVICES
7.3.1 PROFESSIONAL SERVICES
7.3.2 MANAGED SERVICES
8 MIDDLE EAST AND AFRICA OPTICAL FIBER MONITORING MARKET, BY MODE
8.1 OVERVIEW
8.2 SINGLE-MODE
8.3 MULTI-MODE
9 MIDDLE EAST AND AFRICA OPTICAL FIBER MONITORING MARKET, BY TYPE
9.1 OVERVIEW
9.2 STEP INDEXED OPTICAL FIBER
9.3 GRADED INDEXED OPTICAL FIBER
10 MIDDLE EAST AND AFRICA OPTICAL FIBER MONITORING MARKET, BY APPLICATION
10.1 OVERVIEW
10.2 UNDERGROUND
10.3 UNDERWATER
10.4 AERIAL
11 MIDDLE EAST AND AFRICA OPTICAL FIBER MONITORING MARKET, BY END-USE
11.1 OVERVIEW
11.2 IT & TELECOMMUNICATIONS
11.2.1 BY TECHNOLOGY
11.2.1.1. DISTRIBUTED TEMPERATURE SENSING (DTS)
11.2.1.2. DISTRIBUTED FIBER OPTICS SENSING
11.2.1.3. DISTRIBUTED ACOUSTIC SENSING (DAS)
11.2.1.4. REAL TIME THERMAL RING
11.2.1.5. OTHERS
11.3 MILITARY & DEFENSE
11.3.1 BY TECHNOLOGY
11.3.1.1. DISTRIBUTED TEMPERATURE SENSING (DTS)
11.3.1.2. DISTRIBUTED FIBER OPTICS SENSING
11.3.1.3. DISTRIBUTED ACOUSTIC SENSING (DAS)
11.3.1.4. REAL TIME THERMAL RING
11.3.1.5. OTHERS
11.4 OIL & GAS
11.4.1 BY TECHNOLOGY
11.4.1.1. DISTRIBUTED TEMPERATURE SENSING (DTS)
11.4.1.2. DISTRIBUTED FIBER OPTICS SENSING
11.4.1.3. DISTRIBUTED ACOUSTIC SENSING (DAS)
11.4.1.4. REAL TIME THERMAL RING
11.4.1.5. OTHERS
11.5 MEDICAL
11.5.1 BY TECHNOLOGY
11.5.1.1. DISTRIBUTED TEMPERATURE SENSING (DTS)
11.5.1.2. DISTRIBUTED FIBER OPTICS SENSING
11.5.1.3. DISTRIBUTED ACOUSTIC SENSING (DAS)
11.5.1.4. REAL TIME THERMAL RING
11.5.1.5. OTHERS
11.6 AUTOMOTIVE
11.6.1 BY TECHNOLOGY
11.6.1.1. DISTRIBUTED TEMPERATURE SENSING (DTS)
11.6.1.2. DISTRIBUTED FIBER OPTICS SENSING
11.6.1.3. DISTRIBUTED ACOUSTIC SENSING (DAS)
11.6.1.4. REAL TIME THERMAL RING
11.6.1.5. OTHERS
11.7 POWER & ENERGY
11.7.1 BY TECHNOLOGY
11.7.1.1. DISTRIBUTED TEMPERATURE SENSING (DTS)
11.7.1.2. DISTRIBUTED FIBER OPTICS SENSING
11.7.1.3. DISTRIBUTED ACOUSTIC SENSING (DAS)
11.7.1.4. REAL TIME THERMAL RING
11.7.1.5. OTHERS
11.8 BFSI
11.8.1 BY TECHNOLOGY
11.8.1.1. DISTRIBUTED TEMPERATURE SENSING (DTS)
11.8.1.2. DISTRIBUTED FIBER OPTICS SENSING
11.8.1.3. DISTRIBUTED ACOUSTIC SENSING (DAS)
11.8.1.4. REAL TIME THERMAL RING
11.8.1.5. OTHERS
11.9 FOOD & BEVERAGES
11.9.1 BY TECHNOLOGY
11.9.1.1. DISTRIBUTED TEMPERATURE SENSING (DTS)
11.9.1.2. DISTRIBUTED FIBER OPTICS SENSING
11.9.1.3. DISTRIBUTED ACOUSTIC SENSING (DAS)
11.9.1.4. REAL TIME THERMAL RING
11.9.1.5. OTHERS
11.1 OTHERS
11.10.1 BY TECHNOLOGY
11.10.1.1. DISTRIBUTED TEMPERATURE SENSING (DTS)
11.10.1.2. DISTRIBUTED FIBER OPTICS SENSING
11.10.1.3. DISTRIBUTED ACOUSTIC SENSING (DAS)
11.10.1.4. REAL TIME THERMAL RING
11.10.1.5. OTHERS
12 MIDDLE EAST AND AFRICA OPTICAL FIBER MONITORING MARKET, BY REGION
12.1 MIDDLE EAST AND AFRICA OPTICAL FIBER MONITORING MARKET, (ALL SEGMENTATION PROVIDED ABOVE IS REPRESENTED IN THIS CHAPTER BY COUNTRY)
12.1.1 MIDDLE EAST AND AFRICA
12.1.1.1. SOUTH AFRICA
12.1.1.2. EGYPT
12.1.1.3. BAHRAIN
12.1.1.4. QATAR
12.1.1.5. KUWAIT
12.1.1.6. OMAN
12.1.1.7. SAUDI ARABIA
12.1.1.8. U.A.E
12.1.1.9. ISRAEL
12.1.1.10. REST OF MIDDLE EAST AND AFRICA
12.2 KEY PRIMARY INSIGHTS: BY MAJOR COUNTRIES
13 MIDDLE EAST AND AFRICA OPTICAL FIBER MONITORING MARKET, COMPANY LANDSCAPE
13.1 COMPANY SHARE ANALYSIS: MIDDLE EAST AND AFRICA
13.2 MERGERS & ACQUISITIONS
13.3 NEW PRODUCT DEVELOPMENT & APPROVALS
13.4 EXPANSIONS
13.5 REGULATORY CHANGES
13.6 PARTNERSHIP AND OTHER STRATEGIC DEVELOPMENTS
14 MIDDLE EAST AND AFRICA OPTICAL FIBER MONITORING MARKET, SWOT ANALYSIS
15 MIDDLE EAST AND AFRICA OPTICAL FIBER MONITORING MARKET, COMPANY PROFILE
15.1 COHERENT, INC
15.1.1 COMPANY SNAPSHOT
15.1.2 REVENUE ANALYSIS
15.1.3 GEOGRAPHIC PRESENCE
15.1.4 PRODUCT PORTFOLIO
15.1.5 RECENT DEVELOPMENTS
15.2 BANDWEAVER
15.2.1 COMPANY SNAPSHOT
15.2.2 REVENUE ANALYSIS
15.2.3 GEOGRAPHIC PRESENCE
15.2.4 PRODUCT PORTFOLIO
15.2.5 RECENT DEVELOPMENTS
15.3 SUMITOMO CORPORATION
15.3.1 COMPANY SNAPSHOT
15.3.2 REVENUE ANALYSIS
15.3.3 GEOGRAPHIC PRESENCE
15.3.4 PRODUCT PORTFOLIO
15.3.5 RECENT DEVELOPMENTS
15.4 OPTASENSE, LTD
15.4.1 COMPANY SNAPSHOT
15.4.2 REVENUE ANALYSIS
15.4.3 GEOGRAPHIC PRESENCE
15.4.4 PRODUCT PORTFOLIO
15.4.5 RECENT DEVELOPMENTS
15.5 INTELLIGENT FIBER OPTIC CORPORATION
15.5.1 COMPANY SNAPSHOT
15.5.2 REVENUE ANALYSIS
15.5.3 GEOGRAPHIC PRESENCE
15.5.4 PRODUCT PORTFOLIO
15.5.5 RECENT DEVELOPMENTS
15.6 ANRITSU CORPORATION
15.6.1 COMPANY SNAPSHOT
15.6.2 REVENUE ANALYSIS
15.6.3 GEOGRAPHIC PRESENCE
15.6.4 PRODUCT PORTFOLIO
15.6.5 RECENT DEVELOPMENTS
15.7 YOKOGAWA ELECTRIC CORPORATION
15.7.1 COMPANY SNAPSHOT
15.7.2 REVENUE ANALYSIS
15.7.3 GEOGRAPHIC PRESENCE
15.7.4 PRODUCT PORTFOLIO
15.7.5 RECENT DEVELOPMENTS
15.8 RUGGED MONITORING
15.8.1 COMPANY SNAPSHOT
15.8.2 REVENUE ANALYSIS
15.8.3 GEOGRAPHIC PRESENCE
15.8.4 PRODUCT PORTFOLIO
15.8.5 RECENT DEVELOPMENTS
15.9 FLUKE CORPORATION
15.9.1 COMPANY SNAPSHOT
15.9.2 REVENUE ANALYSIS
15.9.3 GEOGRAPHIC PRESENCE
15.9.4 PRODUCT PORTFOLIO
15.9.5 RECENT DEVELOPMENTS
15.1 FIBERSONICS
15.10.1 COMPANY SNAPSHOT
15.10.2 REVENUE ANALYSIS
15.10.3 GEOGRAPHIC PRESENCE
15.10.4 PRODUCT PORTFOLIO
15.10.5 RECENT DEVELOPMENTS
NOTE: THE COMPANIES PROFILED IS NOT EXHAUSTIVE LIST AND IS AS PER OUR PREVIOUS CLIENT REQUIREMENT. WE PROFILE MORE THAN 100 COMPANIES IN OUR STUDY AND HENCE THE LIST OF COMPANIES CAN BE MODIFIED OR REPLACED ON REQUEST
16 RELATED REPORTS
17 QUESTIONNAIRE
18 ABOUT DATA BRIDGE MARKET RESEARCH
Data collection and base year analysis are done using data collection modules with large sample sizes. The stage includes obtaining market information or related data through various sources and strategies. It includes examining and planning all the data acquired from the past in advance. It likewise envelops the examination of information inconsistencies seen across different information sources. The market data is analysed and estimated using market statistical and coherent models. Also, market share analysis and key trend analysis are the major success factors in the market report. To know more, please request an analyst call or drop down your inquiry.
The key research methodology used by DBMR research team is data triangulation which involves data mining, analysis of the impact of data variables on the market and primary (industry expert) validation. Data models include Vendor Positioning Grid, Market Time Line Analysis, Market Overview and Guide, Company Positioning Grid, Patent Analysis, Pricing Analysis, Company Market Share Analysis, Standards of Measurement, Global versus Regional and Vendor Share Analysis. To know more about the research methodology, drop in an inquiry to speak to our industry experts.
Data Bridge Market Research is a leader in advanced formative research. We take pride in servicing our existing and new customers with data and analysis that match and suits their goal. The report can be customized to include price trend analysis of target brands understanding the market for additional countries (ask for the list of countries), clinical trial results data, literature review, refurbished market and product base analysis. Market analysis of target competitors can be analyzed from technology-based analysis to market portfolio strategies. We can add as many competitors that you require data about in the format and data style you are looking for. Our team of analysts can also provide you data in crude raw excel files pivot tables (Fact book) or can assist you in creating presentations from the data sets available in the report.


