
Middle East And Africa Paper Cone Market
Market Size in USD Million
 USD
913.42 Million
USD
1,279.22 Million
2024
2032
USD
913.42 Million
USD
1,279.22 Million
2024
2032
| 2025 - 2032 | |
| USD 913.42 Million | |
| USD 1,279.22 Million | |
| % | |
|
Paper Cone Market Size
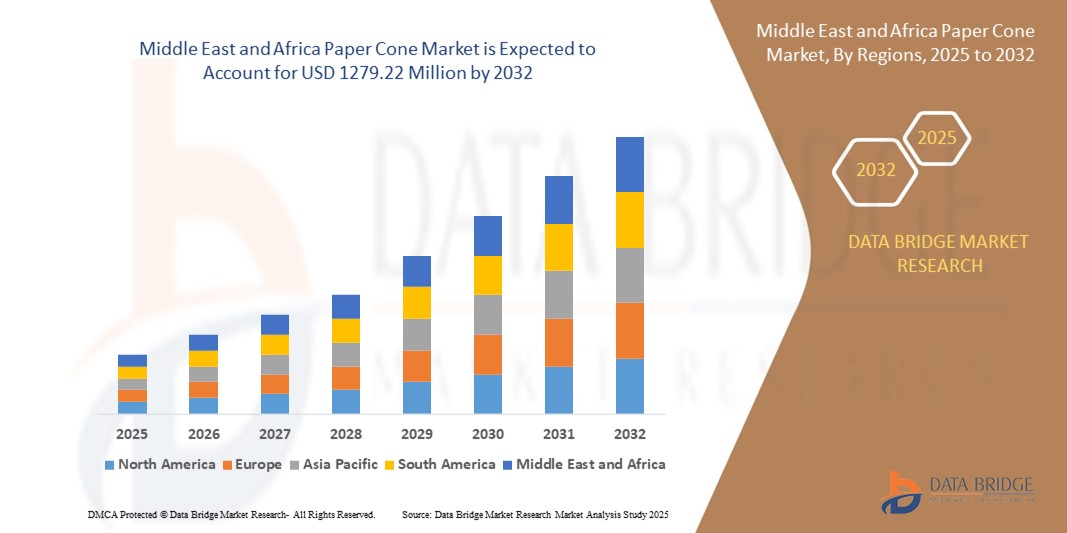
- The Middle East and Africa paper cone market size was valued at USD 913.42 million in 2024 and is expected to reach USD 1279.22 million by 2032, at a CAGR of 4.3% during the forecast period
- The market growth is primarily driven by the increasing demand for sustainable packaging solutions, rapid growth in the textile industry, and the rise of e-commerce, which necessitates efficient and eco-friendly packaging.
- In addition, growing consumer awareness of environmental concerns and the shift toward biodegradable and recyclable materials are further propelling the adoption of paper cones Nimble cones as a preferred packaging option in the region
Paper Cone Market Analysis
- Paper cones are versatile, cost-effective, and eco-friendly cylindrical containers widely used for packaging yarns, textiles, food items, and industrial products, offering stability and protection during transportation and storage
- The demand for paper cones is fueled by their lightweight, recyclable nature, and their ability to meet the needs of industries such as textiles and construction, coupled with the region’s push for sustainable packaging solutions due to environmental regulations and consumer preferences
- The U.A.E. dominated the Middle East and Africa paper cone market with the largest revenue share in 2024, driven by high demand for textile products, a strong e-commerce sector, and low manufacturing costs
- Saudi Arabia is expected to be the fastest-growing country in the market during the forecast period due to increasing industrialization, urbanization, and rising demand for packaged goods in the food and beverage sector
- The yarn paper cone segment dominated the largest market revenue share of 38% in 2024, driven by its extensive use in the textile industry for yarn winding and storage, supported by the region’s growing textile manufacturing sector
Report Scope and Paper Cone Market Segmentation
|
Attributes |
Paper Cone Key Market Insights |
|
Segments Covered |
|
|
Countries Covered |
Middle East and Africa
|
|
Key Market Players |
|
|
Market Opportunities |
|
|
Value Added Data Infosets |
In addition to the insights on market scenarios such as market value, growth rate, segmentation, geographical coverage, and major players, the market reports curated by the Data Bridge Market Research also include import export analysis, production capacity overview, production consumption analysis, price trend analysis, climate change scenario, supply chain analysis, value chain analysis, raw material/consumables overview, vendor selection criteria, PESTLE Analysis, Porter Analysis, and regulatory framework. |
Paper Cone Market Trends
“Increasing Adoption of Sustainable and Eco-Friendly Materials”
- The Middle East and Africa paper cone market is experiencing a notable trend toward the use of sustainable and eco-friendly materials in paper cone production
- Manufacturers are leveraging biodegradable and recyclable materials to meet growing environmental regulations and consumer demand for green packaging solutions
- Advanced manufacturing techniques are being employed to enhance the durability and functionality of paper cones, ensuring they meet industry standards for applications in textiles, construction, and other sectors
- For instance, companies are developing innovative paper cones, such as wax paper cones and printed paper cones that offer enhanced resistance to moisture and wear making them suitable for diverse industrial uses
- This trend is increasing the appeal of paper cones for businesses aiming to reduce their environmental footprint while maintaining high-quality standards
- Data analytics is being used to optimize production processes, enabling manufacturers to track material U.S.ge, reduce waste, and improve supply chain efficiency
Paper Cone Market Dynamics
Driver
“Growing Demand for Textile and Construction Applications”
- The rising demand for paper cones in the textile industry, particularly for yarn winding and fabric production, is a key driver for the Middle East and Africa paper cone market
- Paper cones, such as yarn paper cones and textile paper cones, are essential for efficient storage and transportation of yarn, supporting the region's booming textile sector, particularly in the U.A.E., the dominating country in this market
- The construction industry is also contributing to market growth, with construction cones and conical paper cones being widely used for structural and packaging purposes in infrastructure projects
- Government initiatives promoting sustainable packaging and the expansion of industrial activities in Saudi Arabia, the fastest-growing country, are further boosting the adoption of paper cones
- The proliferation of e-commerce and modern retail channels, such as supermarkets/hypermarkets and specialist retailers, is enhancing the accessibility of paper cones for various end-users
- Manufacturers are increasingly offering customized paper cones, such as those with specific tapers and sizes, to cater to diverse industry needs
Restraint/Challenge
“High Production Costs and Supply Chain Complexities”
- The high initial investment required for advanced machinery and raw materials for producing specialized paper cones, such as multiple-ply or wax paper cones, poses a significant barrier, particularly for small and medium-sized enterprises in emerging markets
- The complexity of manufacturing paper cones with precise specifications, such as tight bong paper cones or cones with specific tapers increases production costs and requires skilled labor
- Supply chain disruptions, including fluctuating raw material prices and logistical challenges, further complicate operations for manufacturers and distributors across the Middle East and Africa
- Environmental regulations, while promoting sustainable materials, can add compliance costs and require manufacturers to adapt to varying standards across countries
- These factors may limit market growth in price-sensitive regions and deter smaller players from entering the market, particularly in areas with underdeveloped industrial infrastructure
Paper Cone market Scope
The market is segmented on the basis of type, number of piles, taper of the cone, size, distribution channel, and end-user.
- By Type
On the basis of type, the Middle East and Africa paper cone market is segmented into tight bong paper cone, jumbo paper cone, yarn paper cone, printed paper cone, bobbins, textile paper cone, wax paper cone, conical paper cone, construction cone, plain paper cone, and others. The yarn paper cone segment dominated the largest market revenue share of 38% in 2024, driven by its extensive use in the textile industry for yarn winding and storage, supported by the region’s growing textile manufacturing sector.
The textile paper cone segment is expected to witness the fastest growth rate from 2025 to 2032, fueled by increasing demand for eco-friendly and customizable yarn carriers, advancements in high-quality cone production, and the expansion of textile industries in countries such as Saudi Arabia.
- By Number of Piles
On the basis of number of piles, the Middle East and Africa paper cone market is segmented into single ply and multiple Ply. The multiple ply segment is expected to hold the largest market revenue share of 62% in 2024, owing to its superior strength and durability, making it ideal for heavy-duty applications in textile and construction industries.
The single ply segment is anticipated to experience significant growth from 2025 to 2032, driven by its cost-effectiveness and suitability for lighter applications, particularly in small-scale textile operations and emerging markets.
- By Taper of the Cone
On the basis of taper of the cone, the Middle East and Africa paper cone market is segmented into up to 30 taper, 30 to 50 taper, and above 50 taper. The 30 to 50 taper segment is expected to hold the largest market revenue share of 45% in 2024, due to its widespread use in textile applications requiring balanced stability and yarn winding efficiency.
The above 50 taper segment is projected to witness the fastest growth from 2025 to 2032, as it caters to specialized applications in construction and heavy-duty textile processes, where larger taper angles enhance cone stability and material handling.
- By Size
On the basis of size, the Middle East and Africa paper cone market is segmented into 1-degree 51-minutes cone, 3-degree 51-minutes cone, 5-degree 57-minutes cone, 3-degree 30-minutes cone, 6-degree 20-minutes cone, 9-degree 51-minutes cone, 9-degree 36-minutes cone, 7-degree 22-minutes cone, and others. The 5-degree 57-minutes Cone segment is expected to hold the largest market revenue share of 30% in 2024, driven by its compatibility with high-speed textile machinery and widespread adoption in the U.A.E.’s textile sector.
The 3-degree 30-minutes cone segment is expected to witness the fastest growth from 2025 to 2032, as spinning mills increasingly shift to smaller taper angles for improved yarn performance and moisture resistance in yarn conditioning processes.
- By Distribution Channel
On the basis of distribution channel, the Middle East and Africa paper cone market is segmented into direct sales/b2b, specialist retailers, convenience stores, supermarkets/hypermarkets, e-commerce, and others. The direct sales/b2b segment is expected to hold the largest market revenue share of 60.2% in 2024, driven by bulk purchasing by textile and construction industries for customized, high-quality paper cones.
The e-commerce segment is anticipated to witness the fastest growth rate from 2025 to 2032, fueled by the increasing availability of paper cones through online platforms, offering convenience and access to diverse cone types for small and medium-sized enterprises.
- By End-User
On the basis of end-user, the Middle East and Africa paper cone market is segmented into textile, construction, and others. The textile segment dominated the market revenue share of 70% in 2024, driven by the high demand for yarn paper cones and textile paper cones in the U.A.E., where the textile industry is a key economic driver.
The construction segment is expected to witness rapid growth from 2025 to 2032, with a projected CAGR of 5.8%, fueled by the increasing use of conical paper cones for marking, safety, and packaging applications in the region’s booming construction sector, particularly in Saudi Arabia.
Paper Cone Market Regional Analysis
- The U.A.E. dominated the Middle East and Africa paper cone market with the largest revenue share in 2024, driven by high demand for textile products, a strong e-commerce sector, and low manufacturing costs
- Consumers prioritize paper cones for their sustainability, cost-effectiveness, and versatility in applications such as yarn winding and construction, particularly in regions with growing industrial and environmental consciousness
- Growth is supported by advancements in paper cone manufacturing, such as automated production and high-quality materials, alongside rising adoption in both textile and construction sectors
U.A.E. Paper Cone Market Insight
The U.A.E. dominates the Middle East and Africa paper cone market with the highest revenue share of 77.9% in 2024, fueled by strong demand for textile products and a robust industrial base. The trend towards sustainable packaging and increasing regulations promoting eco-friendly materials further boost market expansion. The integration of advanced paper cones in textile manufacturing and aftermarket applications creates a diverse product ecosystem.
Saudi Arabia Paper Cone Market Insight
Saudi Arabia is expected to witness the fastest growth rate in the MEA paper cone market, driven by rapid industrialization and a growing textile sector. Consumers seek paper cones that offer durability and recyclability for yarn winding and storage. The adoption of advanced manufacturing technologies and increasing environmental awareness contribute to market growth, with both new and retrofit applications gaining traction.
Paper Cone Market Share
The paper cone industry is primarily led by well-established companies, including:
- Sonoco Products Company (U.S.)
- Huhtamaki Oyj (Finland)
- Conitex Sonoco (U.S.)
- Paper Machinery Corporation (U.S.)
- PTM Packaging Pvt. Ltd. (India)
- Smurfit Kappa Group (Ireland)
- Ahlstrom-Munksjo (Finland)
- Mondi Group (UK)
- International Paper Company (U.S.)
- WestRock Company (U.S.)
- Clearwater Paper Corporation (U.S.)
- Georgia-Pacific LLC (U.S.)
- Rengo Co., Ltd. (Japan)
- DS Smith Plc (UK)
- Sappi Limited (South Africa)
- Papierfabrik Wattenscheid GmbH (Germany)
What are the Recent Developments in Middle East and Africa Paper Cone Market?
- In July 2024, Greenpath Recycling Proprietary Limited, a subsidiary of Sinica Manufacturing, acquired the Versapak division of Mpact Operations.This strategic asset transaction forms part of Mpact’s portfolio optimization plan and involves the transfer of Versapak’s operations, including its manufacturing plants in Paarl and Roodekop, South Africa. The acquisition directly influences the local paper and packaging supply chain, particularly in the production of PET trays, styrene packaging, and vinyl cling film—components relevant to paper-based packaging solutions such as paper cones
- In January 2024, Saint-Gobain acquired two resin flooring solution companies—R.SOL in France and Technical Finishes in South Africa—as part of its strategy to expand in the construction chemicals sector. The combined deal, valued at approximately €20 million (around $22 million), strengthens Saint-Gobain’s footprint in the Southern Europe, Middle East & Africa region. While not directly related to paper cones, this acquisition could indirectly influence demand for paper cones used in construction applications, such as formwork or protective packaging, due to increased construction activity and supply chain integration in South Africa
- In October 2023, Mondi introduced lightweight paper cones designed with enhanced strength to meet the demands of industrial and packaging applications. These cones align with Mondi’s broader sustainability goals, offering a recyclable and efficient alternative to traditional materials. While the announcement did not specifically mention the Middle East and Africa (MEA) region, Mondi’s extensive global footprint—including operations in MEA—suggests that such innovations are such asly to be accessible across multiple markets. This development supports Mondi’s MAP2030 initiative, which aims to ensure all packaging and paper products are reU.S.ble, recyclable, or compostable by 2025
- In August 2023, Emirates Reem Investments Company PJSC acquired Evergreen Plastic Products Manufacturing LLC for AED 44 million (approximately $12 million). Evergreen, a UAE-based manufacturer specializing in packaging solutions for the food and beverage industries, has been operational since 2000. While the acquisition centers on plastic products, it reflects the growing M&A activity in the UAE’s broader packaging sector. Such developments can influence material preferences and supply chain dynamics, potentially impacting the demand for alternative packaging solutions such as paper cones, especially as sustainability becomes a stronger market driver
- In June 2023, K. U. Sodalamuthu and Co. (P) Ltd., a leading Indian manufacturer of paper conversion machinery, launched its new high-performance Automatic Paper Cone Plant. This advanced production line is capable of producing up to 55 cones per minute, featuring a patented gripper winding system, imported servo drive, and programmable controllers for precision and efficiency. The plant supports various cone tapers and includes automated finishing operations such as lubrication, velvet finishing, and notching. While based in India, the technology is well-suited for export and can significantly benefit paper cone production in the Middle East and Africa
SKU-

- Interactive Data Analysis Dashboard
- Company Analysis Dashboard for high growth potential opportunities
- Research Analyst Access for customization & queries
- Competitor Analysis with Interactive dashboard
- Latest News, Updates & Trend analysis
- Harness the Power of Benchmark Analysis for Comprehensive Competitor Tracking
Middle East And Africa Paper Cone Market, Supply Chain Analysis and Ecosystem Framework
To support market growth and help clients navigate the impact of geopolitical shifts, DBMR has integrated in-depth supply chain analysis into its Middle East And Africa Paper Cone Market research reports. This addition empowers clients to respond effectively to global changes affecting their industries. The supply chain analysis section includes detailed insights such as Middle East And Africa Paper Cone Market consumption and production by country, price trend analysis, the impact of tariffs and geopolitical developments, and import and export trends by country and HSN code. It also highlights major suppliers with data on production capacity and company profiles, as well as key importers and exporters. In addition to research, DBMR offers specialized supply chain consulting services backed by over a decade of experience, providing solutions like supplier discovery, supplier risk assessment, price trend analysis, impact evaluation of inflation and trade route changes, and comprehensive market trend analysis.
Data collection and base year analysis are done using data collection modules with large sample sizes. The stage includes obtaining market information or related data through various sources and strategies. It includes examining and planning all the data acquired from the past in advance. It likewise envelops the examination of information inconsistencies seen across different information sources. The market data is analysed and estimated using market statistical and coherent models. Also, market share analysis and key trend analysis are the major success factors in the market report. To know more, please request an analyst call or drop down your inquiry.
The key research methodology used by DBMR research team is data triangulation which involves data mining, analysis of the impact of data variables on the market and primary (industry expert) validation. Data models include Vendor Positioning Grid, Market Time Line Analysis, Market Overview and Guide, Company Positioning Grid, Patent Analysis, Pricing Analysis, Company Market Share Analysis, Standards of Measurement, Global versus Regional and Vendor Share Analysis. To know more about the research methodology, drop in an inquiry to speak to our industry experts.
Data Bridge Market Research is a leader in advanced formative research. We take pride in servicing our existing and new customers with data and analysis that match and suits their goal. The report can be customized to include price trend analysis of target brands understanding the market for additional countries (ask for the list of countries), clinical trial results data, literature review, refurbished market and product base analysis. Market analysis of target competitors can be analyzed from technology-based analysis to market portfolio strategies. We can add as many competitors that you require data about in the format and data style you are looking for. Our team of analysts can also provide you data in crude raw excel files pivot tables (Fact book) or can assist you in creating presentations from the data sets available in the report.


