
Middle East And Africa Parasitology Identification Market
Market Size in USD Billion
 USD
342.50 Billion
USD
483.35 Billion
2025
2033
USD
342.50 Billion
USD
483.35 Billion
2025
2033
| 2026 - 2033 | |
| USD 342.50 Billion | |
| USD 483.35 Billion | |
| % | |
|
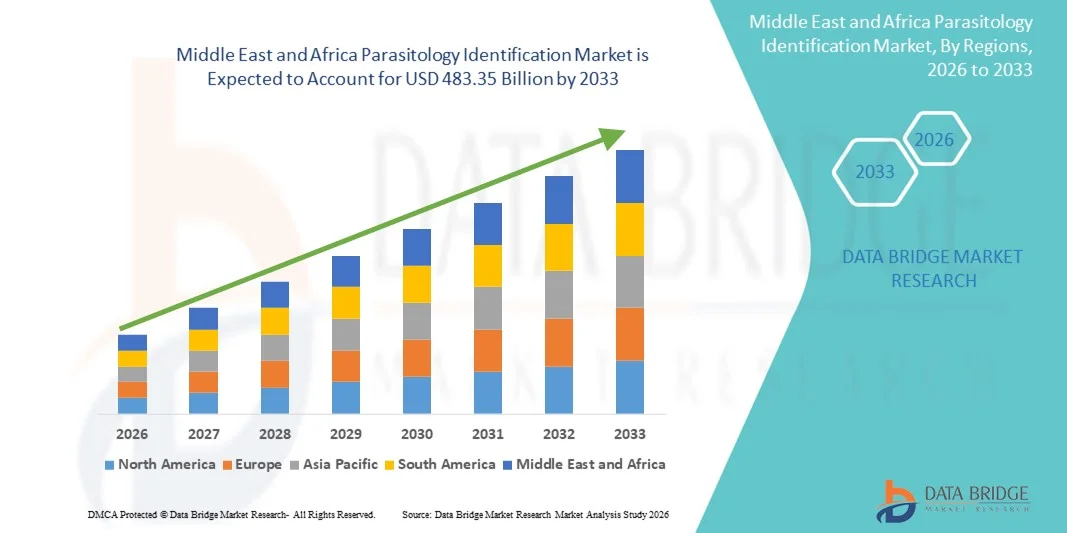
Middle East and Africa Parasitology Identification Market Size
- The Middle East and Africa Parasitology Identification market size was valued at USD 342.50 billion in 2025 and is expected to reach USD 483.35 billion by 2033, at a CAGR of 4.40% during the forecast period
- The market is increasingly driven by advancements in parasitology diagnostics, including molecular identification, microscopy automation, immunoassay development, and digital pathogen detection tools, which are enhancing accuracy, reducing turnaround times, and enabling early detection across clinical, veterinary, and research settings
- The demand for parasitology identification solutions is further strengthened by the rising prevalence of parasitic infections, growing public health awareness, expanding laboratory capabilities, and increased investments in infectious disease surveillance, contributing significantly to the industry’s accelerated growth
Middle East and Africa Parasitology Identification Market Analysis
- Parasitology identification tools, offering advanced diagnostic capabilities for detecting and analyzing parasitic infections across clinical, veterinary, and research environments, are becoming increasingly vital components of modern laboratory and disease-surveillance systems due to their improved accuracy, rapid processing capabilities, and seamless integration with digital and molecular diagnostic platforms
- The escalating demand for parasitology identification solutions is primarily fueled by the rising prevalence of parasitic diseases, growing public health awareness, and a heightened preference for reliable, technology-enhanced diagnostic methods that support early detection, treatment planning, and effective infection control
- Saudi Arabia dominated the Parasitology Identification market with the largest revenue share of 38.6% in 2025, supported by strong governmental healthcare investments, rapid expansion of diagnostic laboratories, increasing adoption of advanced molecular testing platforms, and a growing emphasis on early detection of parasitic diseases across hospitals and research institutions
- U.A.E. is expected to be the fastest-growing region in the Parasitology Identification market during the forecast period, projected to record a CAGR of 11.2% from 2026 to 2033, driven by rising medical tourism, expanding private healthcare infrastructure, higher spending on infectious disease diagnostics, and accelerated integration of AI-enabled laboratory technologies
- The Devices segment dominated the largest market revenue share of 58.4% in 2025, driven by the widespread adoption of automated analyzers, digital microscopes, and molecular detection systems across diagnostic labs and hospitals
Report Scope and Parasitology Identification Market Segmentation
|
Attributes |
Parasitology Identification Key Market Insights |
|
Segments Covered |
|
|
Countries Covered |
Middle East and Africa
|
|
Key Market Players |
• Thermo Fisher Scientific (U.S.) |
|
Market Opportunities |
|
|
Value Added Data Infosets |
In addition to the insights on market scenarios such as market value, growth rate, segmentation, geographical coverage, and major players, the market reports curated by the Data Bridge Market Research also include in-depth expert analysis, patient epidemiology, pipeline analysis, pricing analysis, and regulatory framework. |
Middle East and Africa Parasitology Identification Market Trends
Enhanced Convenience Through AI-Driven Diagnostic Integration
- A significant and accelerating trend in the Middle East and Africa parasitology identification market is the deepening integration of artificial intelligence (AI) into diagnostic workflows, enabling faster, more reliable, and more automated parasite detection. AI-assisted microscopy and AI-backed image-analysis platforms are increasingly being adopted across clinical laboratories, research institutes, and hospitals to improve accuracy and reduce the dependence on manual examination
- For instance, several diagnostic companies and regional laboratories in the MEA region are adopting AI-powered digital microscopy systems that automatically identify parasitic structures, classify infection intensity, and reduce human error—supporting faster clinical decision-making in high-burden regions
- AI integration in parasitology diagnostics enables capabilities such as automated slide scanning, pattern recognition of parasitic forms, and intelligent alerts for abnormal findings. These systems help laboratories handle large sample volumes efficiently and enhance diagnostic standardization
- The integration of AI-based diagnostic tools with laboratory information systems (LIS) also allows centralized management of patient data, image storage, and reporting workflows, contributing to improved operational efficiency across healthcare settings
- This trend toward more intelligent, automated, and interconnected diagnostic environments is reshaping expectations for parasitology testing accuracy and turnaround times. Consequently, companies offering digital pathology and AI-supported diagnostic solutions are expanding their presence in the region to meet rising demand
- The adoption of AI-enabled parasitology identification tools is growing rapidly in both public and private healthcare sectors, as providers increasingly prioritize automation, enhanced accuracy, and early detection of parasitic diseases to improve patient outcomes
Middle East and Africa Parasitology Identification Market Dynamics
Driver
Growing Need Due to Rising Infectious Disease Burden and Improved Diagnostic Infrastructure
- The increasing prevalence of parasitic infections—such as malaria, schistosomiasis, giardiasis, and leishmaniasis—across Middle Eastern and African countries is a major driver for the demand for advanced parasitology identification solutions
- For instance, in April 2025, leading diagnostic manufacturers announced plans to partner with regional health authorities to deploy automated parasitology screening platforms across high-incidence areas, supporting early detection and reducing diagnostic workload. Such initiatives are expected to significantly accelerate the Parasitology Identification industry’s growth
- As healthcare systems strengthen disease surveillance capabilities and seek more accurate diagnostic technologies, automated parasitology tools offer benefits such as faster sample processing, standardized image interpretation, and reduced manual dependency—making them a compelling advancement over traditional microscopy
- Furthermore, the rise of digital health initiatives and laboratory modernization programs across MEA is driving adoption of interconnected diagnostic devices that integrate seamlessly with hospital information systems and national disease-tracking platforms
- The need for rapid, accurate identification of parasites, especially in remote or resource-limited settings, is also contributing to market expansion. The availability of portable, easy-to-use parasitology identification devices is further supporting widespread deployment
- The trend toward self-sufficient laboratory setups and increased government focus on combating endemic parasitic diseases continues to contribute to the growth of the Parasitology Identification market
Restraint/Challenge
Concerns Regarding Limited Resources, Technical Barriers, and High Initial Costs
- Significant gaps in healthcare infrastructure, limited access to advanced diagnostic equipment, and workforce shortages remain critical challenges for the adoption of modern parasitology identification systems across many MEA countries
- For instance, several reports highlight that inadequate laboratory capacity and shortages of trained personnel have slowed the implementation of advanced parasitology diagnostic technologies in rural and underserved regions
- Addressing these gaps requires substantial investment in healthcare infrastructure, training programs, and maintenance support. Companies providing diagnostic solutions emphasize the need for scalable, durable, and user-friendly systems to build trust and improve usability
- In addition, the relatively high initial cost of automated parasitology identification platforms, including digital microscopes and AI-based diagnostic systems, continues to serve as a barrier—particularly for public hospitals and low-income regions
- While prices are gradually becoming more competitive, affordability remains a challenge for widespread adoption, especially in areas where manual microscopy is still perceived as adequate
- Overcoming these challenges through improved funding, capacity-building initiatives, subsidies for diagnostic technologies, and development of cost-efficient parasitology identification solutions will be essential for sustaining long-term market growth
Middle East and Africa Parasitology Identification Market Scope
The market is segmented on the basis of products, methods, pathogen type, sample, stool concentration & sample preparation, and end user.
- By Products
On the basis of products, the Parasitology Identification market is segmented into Devices and Consumables & Accessories. The Devices segment dominated the largest market revenue share of 58.4% in 2025, driven by the widespread adoption of automated analyzers, digital microscopes, and molecular detection systems across diagnostic labs and hospitals. Demand for advanced imaging systems and point-of-care diagnostic instruments continues rising due to improved sensitivity and faster turnaround times for parasite detection. Increased investment in laboratory modernization and national disease surveillance programs further supports device procurement in the Middle East & Africa. Manufacturers are expanding portfolios with AI-powered parasite recognition tools, enhancing workflow automation. The rise in government-funded infectious disease programs and international health collaborations boosts device uptake. Growing awareness about accurate parasite diagnosis drives laboratory upgrades, reinforcing segment dominance.
The Consumables & Accessories segment is expected to witness the fastest CAGR of 12.6% from 2026 to 2033, supported by high volumes of routine parasitic tests and continuous usage of reagents, stains, kits, and sample preparation materials. Increasing adoption of rapid diagnostic kits across low-resource settings fuels recurring demand. Hospitals and clinics prefer disposable consumables to improve safety and reduce cross-contamination risk. Expansion of national screening programs increases reagent consumption in endemic regions. Growth in stool sample preparation materials and molecular assay kits further accelerates segment expansion. International NGOs and health agencies fund large-scale consumable deployment. Rising burden of protozoan and helminth infections continues to boost usage volumes across MEA.
- By Methods
On the basis of methods, the market is segmented into Fecal Identification, Morphological Identification, Molecular Techniques, MALDI-TOF MS, Immunological Techniques, Rapid Diagnostic Tests (RDTs), and Others. The Morphological Identification segment dominated the largest market revenue share of 39.1% in 2025, attributed to its widespread use in routine diagnostics, affordability, and availability across primary health centers. Technicians rely on microscopy for stool, urine, and blood examinations due to cost-effectiveness and capability to identify multiple parasite species. Many MEA laboratories still depend heavily on traditional staining and concentration techniques. The segment benefits from low infrastructure requirements and established training programs. Government public-health campaigns continue to employ microscopy for mass screening. Despite the growth of molecular tools, morphological methods remain the backbone of parasitology diagnostics in rural and semi-urban regions. Microscopy’s reliability for common helminths and protozoa further supports its dominance.
The Molecular Techniques segment is expected to witness the fastest CAGR of 13.8% from 2026 to 2033, driven by increasing adoption of PCR, qPCR, and DNA-based assays offering enhanced sensitivity for low-intensity infections. Governments and private labs are investing in molecular diagnostics to strengthen disease surveillance systems. Rising incidence of mixed infections accelerates demand for multiplex PCR kits. Molecular tools are increasingly used in research institutions for epidemiological studies. Technological advancements, including portable PCR devices, support decentralization of testing. International health bodies provide funding for capacity building in molecular parasitology. With the rising acceptance of precision diagnostics, molecular methods are expected to penetrate clinical settings rapidly.
- By Pathogen Type
On the basis of pathogen type, the market is segmented into Protozoan, Helminths, and Ectoparasites. The Protozoan segment dominated the largest market revenue share of 45.6% in 2025, driven by the high prevalence of protozoan infections such as malaria, giardiasis, leishmaniasis, and amoebiasis across the Middle East & Africa. Increased diagnostic testing due to malaria surveillance programs substantially boosts protozoan detection volume. Healthcare facilities prioritize protozoan screening due to high morbidity rates and outbreaks. Availability of commercial diagnostic kits for protozoa and increased use of rapid tests enhances segment use. Public health agencies continuously fund protozoan monitoring programs. Advancements in molecular and immunological protozoan assays further improve diagnostic accuracy. Growing travel-related protozoan cases also contribute to segment dominance.
The Helminths segment is expected to witness the fastest CAGR of 12.9% from 2026 to 2033, supported by rising awareness of soil-transmitted helminths, expanding deworming campaigns, and increasing detection of schistosomiasis and filariasis. Governments are scaling up school-based screening programs, increasing diagnostic volumes. Advances in stool concentration techniques enhance helminth identification rates. Research grants for neglected tropical diseases fuel helminth diagnostic innovation. Migration patterns and urbanization increase helminth transmission in peri-urban areas. The growing need for sensitive tests for light-intensity infections supports adoption of molecular helminth assays. International agencies are partnering with MEA countries to strengthen helminth surveillance, accelerating growth.
- By Sample
On the basis of sample, the market is segmented into Feces, Blood, Urine, Serum & Plasma, and Others. The Feces segment dominated the largest market revenue share of 52.3% in 2025, driven by the fact that stool samples are the primary diagnostic material for intestinal parasites including protozoa and helminths. Routine stool examinations are widely performed at primary and secondary healthcare centers across MEA. Public health campaigns rely heavily on stool surveys to assess parasitic burden in communities. Stool concentration and staining techniques remain widely used and cost-effective. High frequency of gastrointestinal infection screening boosts fecal sample testing. Availability of stool-based rapid kits and molecular stool assays supports testing volumes. The segment benefits from high patient footfall in outpatient clinics presenting with digestive symptoms.
The Blood segment is expected to witness the fastest CAGR of 12.4% from 2026 to 2033, driven by increased use of blood samples for detecting malaria, filariasis, and other systemic parasitic infections. Expansion of malaria rapid diagnostic test adoption significantly boosts blood-based testing. Hospitals increasingly use blood samples for advanced serological and PCR-based parasitology diagnostics. The rise in leishmaniasis cases in certain MEA regions elevates blood testing demand. International funding for malaria control programs fuels blood-sample utilization. Improved access to trained phlebotomy services enhances diagnostic reach. Growing use of plasma and serum biomarkers accelerates blood-based parasitology testing.
- By Stool Concentration and Sample Preparation
On the basis of stool concentration and sample preparation, the market is segmented into Concentration Technique and Unconcentration Technique. The Concentration Technique segment dominated the largest market revenue share of 61.7% in 2025, owing to its high diagnostic yield for low-intensity infections and its routine use in laboratories across MEA. Techniques such as formalin-ether concentration significantly improve parasite detection rates. Public health laboratories rely on concentration methods for mass screening programs. These techniques remain affordable and widely adopted in resource-limited settings. Concentration improves sensitivity for helminths and protozoa, increasing clinical reliability. Training programs promote concentration methods as essential diagnostic tools. Adoption is further driven by increasing gastrointestinal infection cases requiring enhanced detection accuracy.
The Unconcentration Technique segment is expected to witness the fastest CAGR of 11.6% from 2026 to 2033, supported by its convenience, speed, and suitability for point-of-care diagnostics. Direct smear methods remain preferred in emergency testing and low-resource clinics. Rapid diagnostic kits often do not require concentration, increasing usage of unconcentrated samples. Technicians favor these techniques for high-throughput screening. Rising demand for immediate diagnosis in outpatient settings boosts adoption. Improvements in sample preparation reagents enhance clarity of direct smears. Expansion of portable diagnostic devices supports unconcentrated sample testing.
- By End User
On the basis of end user, the market is segmented into Diagnostic Centers, Hospitals, Clinics, and Others. The Diagnostic Centers segment dominated the largest market revenue share of 46.5% in 2025, driven by rising parasitic infection testing volumes and the expansion of private diagnostic chains in MEA. These centers have advanced equipment, skilled technicians, and high testing throughput. Government collaborations with diagnostic networks for national screening programs increase reliance on diagnostic centers. Growth in molecular and immunological test adoption strengthens segment leadership. Patients prefer diagnostic centers for quick reporting and affordability. Rising urbanization increases diagnostic center footfall. International health initiatives partner with diagnostic labs to support parasitic surveillance studies.
The Clinics segment is expected to witness the fastest CAGR of 12.1% from 2026 to 2033, supported by growing decentralization of healthcare services and rising adoption of point-of-care parasitology tests. Small and mid-sized clinics increasingly perform preliminary testing before referral. Portable diagnostic devices and rapid kits make parasitology identification feasible at clinic level. Clinics in rural and underserved areas adopt parasitology testing due to improved affordability of diagnostic tools. Growth in private clinic chains across MEA boosts adoption. Increasing patient preference for nearby, low-cost testing accelerates segment expansion. Rising government emphasis on primary care strengthens clinic-based diagnostics.
Middle East and Africa Parasitology Identification Market Regional Analysis
- The Middle East & Africa parasitology identification market is projected to expand at a substantial CAGR throughout the forecast period, driven by rising government focus on strengthening infectious disease surveillance, expanding diagnostic laboratory networks, and increasing awareness of early parasite detection
- The adoption of advanced diagnostic platforms—including molecular assays, rapid diagnostic tests (RDTs), and automated microscopy—is accelerating as healthcare systems modernize across the region
- Growing investments in public health programs, coupled with the rising burden of parasitic infections such as malaria, toxoplasmosis, and helminthiasis, are further stimulating market growth
Saudi Arabia Parasitology Identification Market Insight
The Saudi Arabia parasitology identification market is anticipated to grow significantly during the forecast period due to the nation’s strong investments in modernizing its healthcare ecosystem and strengthening infectious disease diagnostic capacity. Government-led initiatives to enhance laboratory capabilities, increase screening programs for migrant populations, and adopt cutting-edge techniques such as PCR, MALDI-TOF MS, and molecular panels are fueling market growth. The widespread presence of advanced hospitals and research centers, combined with rising cases of parasitic infections in rural and urban pockets, continues to drive demand for accurate and high-throughput identification systems. Saudi Arabia remained the largest market in the region with a 38.6% revenue share in 2025, reflecting the country’s rapid technological adoption and its prioritization of early parasitic disease detection.
U.A.E. Parasitology Identification Market Insight
The U.A.E. parasitology identification market is expected to expand at the fastest rate across the Middle East & Africa region, supported by rising medical tourism and increasing adoption of premium laboratory technologies. The country’s well-developed private healthcare sector, significant foreign patient inflow, and rapid integration of AI-powered diagnostic platforms are accelerating the transition from manual microscopy toward digital and molecular diagnostic solutions. Growing awareness of infectious diseases, along with heavy investments in advanced laboratory automation, is propelling market growth. The U.A.E. is projected to register the highest CAGR of 11.2% from 2026 to 2033, driven by modernization initiatives, expansion of high-end diagnostic centers, and government efforts to strengthen national disease surveillance.
Middle East and Africa Parasitology Identification Market Share
The Parasitology Identification industry is primarily led by well-established companies, including:
• Thermo Fisher Scientific (U.S.)
• Abbott (U.S.)
• bioMérieux (France)
• QIAGEN (Netherlands)
• Danaher Corporation (U.S.)
• BD (U.S.)
• Roche Diagnostics (Switzerland)
• Siemens Healthineers (Germany)
• Sysmex Corporation (Japan)
• Bio-Rad Laboratories (U.S.)
• Altona Diagnostics (Germany)
• CerTest Biotec (Spain)
• Eurofins Scientific (Luxembourg)
• Hologic Inc. (U.S.)
• Merck KGaA (Germany)
• GenMark Diagnostics (U.S.)
• Veredus Laboratories (Singapore)
• Randox Laboratories (U.K.)
• QuidelOrtho (U.S.)
• ELITech Group (France)
Latest Developments in Middle East and Africa Parasitology Identification Market
- In September 2024, researchers in Angola published a study demonstrating the effectiveness of real-time PCR for malaria diagnosis and species-identification in febrile patients — highlighting molecular diagnostics as a powerful tool to supplement microscopy and antigen-based tests, especially in areas with mixed Plasmodium species or low parasite loads
- In January 2025, a multiplex molecular detection system capable of simultaneously identifying malaria and other blood parasitic diseases in a single test was reported — offering high sensitivity (detection limits as low as 0.6–3.0 parasites/µL for Plasmodium) and enabling diagnosis of co-infections, which can improve detection efficiency in endemic areas
- In April 2025, a field study from North-western Tanzania compared Rapid Diagnostic Tests (RDTs), microscopy, and qPCR for detection of Plasmodium parasites among symptomatic and asymptomatic individuals — illustrating how molecular and antigen-based diagnostics are being combined to improve detection accuracy in surveillance and community-level screening programs
- In November 2025, a new portable molecular malaria test (named “Dragonfly”) was reported, capable of detecting asymptomatic and submicroscopic malaria infections in under 45 minutes with > 95% sensitivity — representing a major leap forward for point-of-care parasitology diagnostics, especially for remote or resource-limited settings
- In December 2025, a review article summarizing “Recent advancements in the diagnosis of parasitic diseases” was published — highlighting the increasing use of molecular techniques (PCR, isothermal amplification), next-generation sequencing, CRISPR-based diagnostics, and multi-omics approaches, emphasizing that the parasitology diagnostic field is undergoing rapid technological transformation
SKU-

- Interactive Data Analysis Dashboard
- Company Analysis Dashboard for high growth potential opportunities
- Research Analyst Access for customization & queries
- Competitor Analysis with Interactive dashboard
- Latest News, Updates & Trend analysis
- Harness the Power of Benchmark Analysis for Comprehensive Competitor Tracking
Data collection and base year analysis are done using data collection modules with large sample sizes. The stage includes obtaining market information or related data through various sources and strategies. It includes examining and planning all the data acquired from the past in advance. It likewise envelops the examination of information inconsistencies seen across different information sources. The market data is analysed and estimated using market statistical and coherent models. Also, market share analysis and key trend analysis are the major success factors in the market report. To know more, please request an analyst call or drop down your inquiry.
The key research methodology used by DBMR research team is data triangulation which involves data mining, analysis of the impact of data variables on the market and primary (industry expert) validation. Data models include Vendor Positioning Grid, Market Time Line Analysis, Market Overview and Guide, Company Positioning Grid, Patent Analysis, Pricing Analysis, Company Market Share Analysis, Standards of Measurement, Global versus Regional and Vendor Share Analysis. To know more about the research methodology, drop in an inquiry to speak to our industry experts.
Data Bridge Market Research is a leader in advanced formative research. We take pride in servicing our existing and new customers with data and analysis that match and suits their goal. The report can be customized to include price trend analysis of target brands understanding the market for additional countries (ask for the list of countries), clinical trial results data, literature review, refurbished market and product base analysis. Market analysis of target competitors can be analyzed from technology-based analysis to market portfolio strategies. We can add as many competitors that you require data about in the format and data style you are looking for. Our team of analysts can also provide you data in crude raw excel files pivot tables (Fact book) or can assist you in creating presentations from the data sets available in the report.


