
Middle East And Africa Photoacoustic Imaging Market
Market Size in USD Million
 USD
8.59 Million
USD
26.83 Million
2025
2033
USD
8.59 Million
USD
26.83 Million
2025
2033
| 2026 - 2033 | |
| USD 8.59 Million | |
| USD 26.83 Million | |
| % | |
|
Middle East and Africa Photoacoustic Imaging Market Size
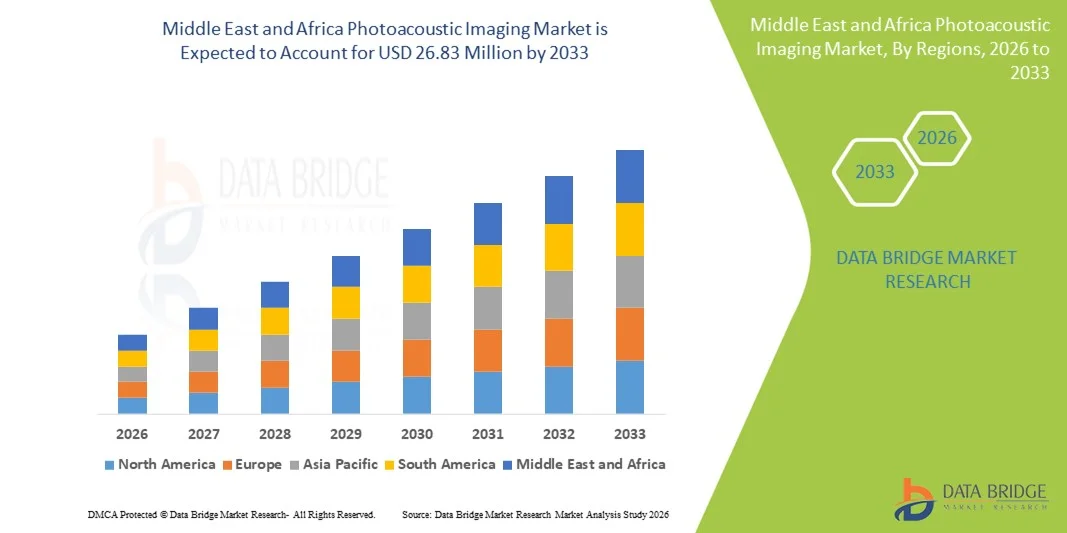
- The Middle East and Africa photoacoustic imaging market size was valued at USD 8.59 Million in 2024 and is expected to reach USD 26.83 Million by 2033, at a CAGR of 15.30% during the forecast period
- The market growth is largely fueled by the rising adoption and ongoing technological advancements in biomedical imaging and diagnostic systems, particularly within the realm of non-invasive and real-time imaging techniques. Photoacoustic imaging, which combines optical and ultrasound modalities, is gaining traction due to its superior resolution, depth of penetration, and ability to visualize both structural and functional information, thereby enhancing diagnostic precision across various medical applications
- Furthermore, the increasing demand for safer, more accurate, and non-ionizing diagnostic tools is positioning photoacoustic imaging as a cutting-edge alternative to conventional imaging techniques such as MRI, CT, and PET. These converging factors are accelerating the adoption of photoacoustic imaging solutions in oncology, cardiology, neurology, and dermatology, thereby significantly boosting the industry's growth trajectory
Middle East and Africa Photoacoustic Imaging Market Analysis
- Photoacoustic imaging, leveraging the photoacoustic effect to provide high-resolution, high-contrast images of biological tissues, is an increasingly vital component of modern medical diagnostics and research systems in both clinical and preclinical settings due to its non-invasiveness, deep tissue penetration, and functional imaging capabilities
- The escalating demand for photoacoustic imaging is primarily fueled by the growing prevalence of chronic diseases, the increasing need for early and accurate diagnosis, and a rising preference for non-ionizing and non-invasive imaging modalities
- Saudi Arabia dominated the photoacoustic imaging market with the largest revenue share of 36.8% in 2024. This leadership is supported by substantial government investments in advanced healthcare infrastructure, expanding biomedical research initiatives, a rapidly growing medical imaging industry, and strong adoption of innovative diagnostic technologies across major hospitals and research institutions
- U.A.E. is expected to be the fastest-growing region in the photoacoustic imaging market during the forecast period, with a projected CAGR of 21.5%. This growth is driven by increasing healthcare expenditure, rising prevalence of chronic diseases, expanding R&D activities, growing medical tourism, and improving access to advanced diagnostic tools in both urban and semi-urban regions
- The hardware segment dominated the market with the largest revenue share of 62.4% in 2024, supported by the strong demand for advanced imaging systems, transducers, and light sources used in preclinical and clinical research
Report Scope and Photoacoustic Imaging Market Segmentation
|
Attributes |
Photoacoustic Imaging Key Market Insights |
|
Segments Covered |
|
|
Countries Covered |
Middle East and Africa
|
|
Key Market Players |
|
|
Market Opportunities |
|
|
Value Added Data Infosets |
In addition to the insights on market scenarios such as market value, growth rate, segmentation, geographical coverage, and major players, the market reports curated by the Data Bridge Market Research also include in-depth expert analysis, pricing analysis, brand share analysis, consumer survey, demography analysis, supply chain analysis, value chain analysis, raw material/consumables overview, vendor selection criteria, PESTLE Analysis, Porter Analysis, and regulatory framework. |
Middle East and Africa Photoacoustic Imaging Market Trends
Technological Advancements Driving Clinical Adoption and Imaging Accuracy
- A significant and accelerating trend in the global photoacoustic imaging (PAI) market is the continuous advancement of hybrid imaging systems that integrate PAI with ultrasound, optical coherence tomography (OCT), and other modalities to improve clinical diagnostic accuracy and image depth
- For instance, FUJIFILM VisualSonics has introduced the Vevo LAZR-X system, which combines high-frequency ultrasound and photoacoustics, enabling researchers and clinicians to visualize molecular, functional, and anatomical data simultaneously. This multi-modal integration significantly enhances tissue characterization, particularly in oncology and vascular imaging
- The integration of tunable laser sources and real-time spectral unmixing algorithms has improved the specificity and resolution of photoacoustic images, allowing for better visualization of hemoglobin, melanin, lipids, and other chromophores. This advancement is crucial for applications such as tumor angiogenesis monitoring, hypoxia assessment, and metabolic imaging
- Advanced imaging probes and contrast agents are being developed to target specific molecular markers, enabling molecular photoacoustic imaging for personalized medicine. For example, nanoparticle-based contrast agents tailored for cancer biomarkers are being explored to increase the sensitivity of tumor detection using PAI
- The miniaturization of imaging components is enabling the development of portable and handheld photoacoustic devices, which are particularly promising for point-of-care diagnostics and intraoperative imaging. These compact systems offer real-time guidance during surgical procedures, potentially improving outcomes in tumor resection and vascular surgeries
- This growing emphasis on technological innovation and clinical integration is transforming the photoacoustic imaging landscape. As the industry moves toward broader hospital adoption, companies such as iThera Medical, Seno Medical, and TomoWave Laboratories are accelerating product development and clinical trials to position PAI as a standard imaging tool in oncology, cardiology, and dermatology
Middle East and Africa Photoacoustic Imaging Market Dynamics
Driver
Growing Need Due to Rising Demand for Non-Invasive Imaging and Early Disease Detection
- The increasing demand for non-invasive, high-resolution diagnostic tools in clinical and research settings is a significant driver for the growing adoption of photoacoustic imaging (PAI) technologies across various medical fields
- For instance, in March 2024, FUJIFILM VisualSonics, Inc. announced a new generation of its Vevo LAZR-X system, incorporating enhanced multispectral imaging capabilities for improved tumor characterization and vascular imaging. Innovations such as these are expected to fuel PAI market growth during the forecast period
- As healthcare systems globally shift towards early disease detection and precision diagnostics, PAI offers a compelling alternative to traditional imaging methods by combining optical contrast with ultrasound penetration—enabling detailed visualization of tissues, blood oxygenation, and molecular markers without ionizing radiation
- Furthermore, the rising prevalence of chronic diseases such as cancer and cardiovascular disorders has intensified the need for real-time functional imaging, driving the adoption of photoacoustic solutions in both hospitals and research institutes
- The ability of PAI to visualize biological processes such as angiogenesis, hypoxia, and inflammation in vivo—without the need for invasive procedures—is positioning it as a preferred tool in preclinical research and clinical diagnostics. Growing awareness and clinical validation are expected to accelerate its integration into routine healthcare imaging practices
Restraint/Challenge
High Cost and Limited Commercial Adoption Due to Technological Complexity
- Despite its significant clinical and research advantages, the high cost of advanced photoacoustic imaging systems remains a major barrier to broader adoption. These systems require precision lasers, transducers, and specialized software, making them expensive for many institutions, especially in low-resource settings
- For instance, many high-performance PAI platforms currently used in academic or pharmaceutical R&D labs require six-figure capital investments, limiting access primarily to large universities or well-funded research centers
- In addition, the technological complexity of PAI—including the need for operator training, precise calibration, and maintenance—creates operational challenges that can deter clinical use. The learning curve for interpreting multispectral data and integrating PAI into clinical workflows further hinders its adoption in smaller hospitals or diagnostic labs
- Moreover, while PAI has shown promising results in early-stage studies, the lack of widespread regulatory approval and standardization in clinical settings slows down market expansion. The industry must invest in robust clinical trials, regulatory alignment, and real-world evidence to demonstrate the technology’s efficacy and cost-effectiveness in large-scale applications
Middle East and Africa Photoacoustic Imaging Market Scope
The market is segmented on the basis of component, type, application, modality, platform, dimension, diagnostic application, end user, and distribution channel.
- By Component
On the basis of component, the photoacoustic imaging market is segmented into hardware (component & substance medium), software and services. The hardware segment dominated the market with the largest revenue share of 62.4% in 2024, supported by the strong demand for advanced imaging systems, transducers, and light sources used in preclinical and clinical research. Hardware remains essential for signal generation, detection, and system integration, driving high investments from research institutions and hospitals. The growing focus on enhancing imaging depth, resolution, and speed is fueling continuous hardware upgrades. In addition, expanding applications in oncology, vascular imaging, and dermatology are driving the demand for sophisticated hardware solutions. Increasing adoption of multi-modal imaging systems further strengthens hardware dominance. The market is also witnessing significant funding and collaboration for developing next-generation photoacoustic devices. The hardware segment’s growth is further supported by rising demand for portable and compact systems. Overall, hardware continues to be the primary revenue contributor in the photoacoustic imaging market.
The software and services segment is expected to witness the fastest CAGR of 14.1% from 2026 to 2033, driven by the increasing need for advanced image processing, AI-based analytics, and cloud-based data management solutions. The growth is supported by the rising importance of real-time visualization and quantitative analysis for clinical decision-making. Software advancements are enhancing the accuracy of diagnostics and enabling better integration with other imaging modalities. The demand for software tools is rising across hospitals, diagnostic centers, and research labs to improve workflow efficiency. In addition, the expansion of AI and machine learning in image interpretation is driving software adoption. Services such as maintenance, training, and consulting are also gaining traction, contributing to overall growth. As clinical adoption expands, the need for regulatory-compliant software platforms increases. The software and services segment is poised to grow rapidly due to these technological and clinical trends.
- By Type
On the basis of type, the photoacoustic imaging market is segmented into photoacoustic imaging system and photoacoustic computed tomography system. The photoacoustic imaging system segment dominated the market with the largest revenue share of 58.6% in 2024, driven by its widespread use in preclinical research for studying tumor vasculature, oxygenation, and molecular imaging. Researchers prefer PAI systems due to their high contrast, high-resolution imaging capabilities without ionizing radiation. The segment benefits from strong adoption in academic institutions, pharmaceutical R&D, and preclinical labs. Its versatility in functional imaging, small animal studies, and non-invasive monitoring contributes to sustained demand. Increasing focus on cancer research and vascular studies further strengthens segment dominance. In addition, PAI systems are increasingly integrated with ultrasound and other imaging modalities. Continuous innovation in system miniaturization and improved detectors also supports market leadership. Overall, the PAI system segment remains the major revenue contributor due to its established presence and widespread use.
The photoacoustic computed tomography system segment is projected to witness the fastest growth rate of 12.4% from 2026 to 2033, owing to its expanding role in deep-tissue imaging and increasing clinical trials focusing on oncology and cardiovascular disorders. The advanced imaging depth and 3D reconstruction capability are gaining traction in translational research and potential clinical diagnostics. Increasing clinical validation studies for breast cancer, vascular imaging, and dermatology are supporting growth. The segment is also benefiting from improvements in reconstruction algorithms and detector technology. Rising interest in non-invasive clinical diagnostics is encouraging adoption of PACT systems in hospitals and diagnostic centers. The demand for high-depth imaging in oncology and neurology is driving segment growth. As more regulatory approvals and clinical applications emerge, the PACT market is expected to expand significantly.
- By Application
On the basis of application, the photoacoustic imaging market is segmented into preclinical and clinical. The preclinical segment captured the highest market revenue share of 61.2% in 2024, largely due to its extensive use in academic and pharmaceutical R&D for evaluating drug efficacy, tumor biology, and vascular research. Researchers value photoacoustic imaging for its non-invasive, multi-modal capabilities, particularly in small animal models. Preclinical studies benefit from real-time imaging and high-resolution visualization of molecular and functional changes. The segment also gains support from strong academic funding and collaborations between universities and biotech firms. Increasing demand for novel drug discovery and precision medicine research further strengthens segment dominance. The presence of well-established preclinical imaging infrastructure in North America and Europe supports growth. Overall, preclinical applications continue to be the major revenue driver in the photoacoustic imaging market.
The clinical segment is projected to grow at the fastest CAGR of 13.8% from 2026 to 2033, driven by increasing interest in applying photoacoustic imaging for human diagnostics, particularly in breast cancer detection, dermatology, and vascular disorders. As more clinical trials validate its effectiveness, clinical use is expected to expand significantly. The demand for non-invasive imaging solutions with high contrast and real-time visualization is increasing in hospitals and diagnostic centers. Growing focus on early disease detection and personalized treatment is supporting clinical adoption. Advances in portable and handheld systems are also making clinical applications more feasible. Furthermore, integration with ultrasound and other imaging modalities enhances diagnostic utility. The segment’s growth is also supported by increasing regulatory approvals and clinical validation studies globally.
- By Modality
On the basis of modality, the market is segmented into portable, standalone, and handheld. The standalone segment dominated the market with the largest revenue share of 54.9% in 2024, driven by the high adoption of full-scale systems in research institutions and hospitals. Standalone systems provide comprehensive imaging capabilities with advanced detectors and high-performance lasers, making them ideal for preclinical and clinical applications. The segment benefits from strong demand in oncology research, vascular studies, and drug development. Their robust performance, accuracy, and integration with other imaging modalities contribute to market dominance. In addition, standalone systems are preferred for complex imaging workflows and long-term research projects. Investments in infrastructure and availability of trained personnel further support this segment.
The portable segment is expected to register the fastest CAGR of 15.2% from 2026 to 2033, owing to increasing demand for compact and mobile imaging solutions in clinical settings. Portable systems are gaining popularity due to ease of transport, quick setup, and use in point-of-care diagnostics. Growing interest in bedside monitoring and outpatient diagnostics is fueling growth. The segment is also supported by technological advancements in miniaturized lasers and detectors. As healthcare facilities adopt portable imaging for rapid screening and monitoring, demand is expected to rise. The expansion of telemedicine and remote patient monitoring is further encouraging adoption of portable photoacoustic devices.
- By Platform
On the basis of platform, the market is segmented into pulsed laser diode, LED-based, xenon flash, and others. The pulsed laser diode segment dominated the market with the largest revenue share of 57.3% in 2024, supported by its high energy efficiency and better penetration depth. Pulsed laser diodes provide stable performance, reliable output, and are widely used in both preclinical and clinical photoacoustic systems. The segment benefits from continuous innovation and decreasing cost of diode lasers. In addition, their compatibility with high-resolution imaging and multi-wavelength operation supports diverse applications. Strong adoption in oncology research and vascular imaging further strengthens the segment.
The LED-based segment is expected to grow at the fastest CAGR of 14.6% from 2026 to 2033, driven by the increasing demand for cost-effective and compact light sources. LED-based systems offer lower cost, smaller size, and easier integration, making them suitable for portable and handheld devices. Growth is supported by expanding applications in dermatology and superficial imaging. The development of high-power LED arrays and improved light output is further encouraging adoption. The segment is expected to gain momentum as clinical and point-of-care applications increase.
- By Dimension
On the basis of dimension, the market is segmented into 2D and 3D. The 2D segment dominated the market with the largest revenue share of 59.1% in 2024, supported by its widespread use in routine imaging applications due to easier implementation and lower operational complexity. 2D photoacoustic imaging is widely used in preclinical studies because it offers fast scanning and clear visualization of vascular structures, oxygenation levels, and functional changes in tissues. The cost-effectiveness of 2D systems makes them popular in academic labs and small research facilities. They also provide reliable imaging performance for superficial tissue analysis and small animal studies. Moreover, 2D systems are easier to integrate with ultrasound and other modalities, further increasing adoption. Training and workflow requirements are minimal compared to 3D systems, making them a preferred choice for early-stage research and routine diagnostics. Overall, 2D imaging remains the primary revenue contributor due to its established presence in both research and clinical environments.
The 3D segment is expected to grow at the fastest CAGR of 13.9% from 2026 to 2033, driven by rising demand for volumetric imaging and advanced reconstruction capabilities in clinical diagnostics and translational research. 3D photoacoustic imaging enables detailed visualization of tumor volumes, vascular networks, and organ structures, which is essential for accurate disease assessment and treatment planning. The growing number of clinical trials in oncology, cardiology, and neurology is pushing the adoption of 3D systems. Improvements in detector arrays, reconstruction algorithms, and computing power are enhancing 3D imaging quality and speed. As hospitals and diagnostic centers increasingly focus on precise disease mapping and real-time monitoring, 3D imaging becomes more valuable. The ability to provide deeper tissue visualization and better anatomical context is also encouraging wider adoption. Therefore, 3D imaging is expected to record strong growth during the forecast period.
- By Diagnostic Application
On the basis of diagnostic application, the market is segmented into oncology, hematology, dermatology, cardiology, neurology, and others. The oncology segment dominated the market with the largest revenue share of 45.8% in 2024, driven by strong demand for tumor imaging, monitoring treatment response, and evaluating tumor vasculature and oxygenation. Photoacoustic imaging provides high-contrast visualization of blood vessels and oxygen saturation, making it valuable for cancer research and diagnostics. The technology is increasingly used in preclinical and translational studies to monitor tumor growth and assess therapy effectiveness. Rising global cancer incidence and increasing investment in oncology research further support the segment’s dominance. In addition, the ability to combine photoacoustic imaging with ultrasound enhances its diagnostic value for tumor localization and characterization. Continuous innovation in contrast agents and multi-wavelength imaging is expanding applications in oncology. As a result, oncology remains the primary revenue driver in the photoacoustic imaging market.
The dermatology segment is expected to witness the fastest CAGR of 15.5% from 2026 to 2033, driven by the growing demand for non-invasive skin imaging and early detection of skin disorders such as melanoma and psoriasis. Photoacoustic imaging provides high-resolution visualization of skin layers and vascular structures, allowing clinicians to assess lesion depth, blood flow, and oxygenation without invasive biopsy. The rise in aesthetic and dermatology clinics adopting advanced imaging technologies is supporting market growth. In addition, the growing awareness of skin cancer screening and early diagnosis is fueling adoption. Technological advancements in handheld and portable devices are also making photoacoustic imaging more accessible for dermatology applications. The segment’s growth is further supported by increasing research on skin diseases and the development of specialized photoacoustic imaging systems for dermatology.
- By End User
On the basis of end-user, the market is segmented into ambulatory surgical centers, research laboratories, hospitals and clinics, diagnostic imaging centers, pharmaceutical and biotechnology companies, and others. The research laboratories segment dominated the market in 2024, owing to high demand for preclinical imaging tools, strong academic funding, and expanding research in functional and molecular imaging. Research institutions are increasingly adopting photoacoustic imaging systems to advance biomedical discovery, drug development, and translational research. The technology is widely used in small animal studies for tumor biology, vascular imaging, and drug efficacy evaluation. Moreover, collaborations between universities and biotech firms are fueling investments in PAI systems. The presence of well-established preclinical research infrastructure in North America and Europe also supports segment dominance. Overall, research laboratories continue to be the primary revenue contributor due to strong demand for high-end imaging tools.
The hospitals and clinics segment is forecasted to witness the highest CAGR of 14.7% from 2026 to 2033, supported by increasing adoption of innovative imaging modalities in clinical settings. Hospitals are increasingly investing in non-invasive and real-time imaging solutions for early disease detection and treatment monitoring. Growing emphasis on personalized medicine and precision diagnostics is encouraging integration of photoacoustic imaging into clinical workflows. The technology’s ability to provide functional and molecular information along with structural imaging makes it valuable for oncology, dermatology, and vascular disorders. In addition, improved clinical validation and regulatory approvals are boosting adoption. The rising demand for advanced diagnostic tools in emerging markets is also supporting growth.
- By Distribution Channel
On the basis of distribution channel, the market is segmented into direct tender, retail sales, online sales, and others. The direct tender segment dominated the market with the largest revenue share of 52.6% in 2024, driven by institutional procurement of photoacoustic systems by hospitals, research labs, and government organizations. Direct tender procurement is preferred for large-scale purchases because it offers better pricing, long-term service contracts, and customized system configurations. This channel is especially popular in public healthcare systems and academic institutions that require high-end imaging equipment with full maintenance support. The presence of major imaging manufacturers and their strong distribution networks further supports direct tender dominance. In addition, tenders often include bundled services, installation, and training, which adds value for buyers.
The online sales segment is expected to register the fastest CAGR of 16.2% from 2026 to 2033, supported by increasing digitalization, e-commerce adoption, and easier access to smaller imaging accessories, software, and portable devices. Online platforms provide convenience for purchasing and rapid delivery, especially for research labs and smaller clinics. The growth of online sales is also driven by rising demand for remote procurement and fast replacement of components. In addition, increased trust in online transactions and improved logistics in emerging markets are supporting this segment’s growth.
Middle East and Africa Photoacoustic Imaging Market Regional Analysis
- The Middle East and Africa photoacoustic imaging market is poised to register the fastest CAGR of 14.8% during the forecast period, with the region capturing 21.3% of global revenue in 2024
- This rapid growth is fueled by increasing healthcare expenditure, government-led digital health programs, and expanding imaging infrastructure in countries such as Saudi Arabia, UAE, and South Africa
- A rising number of public–private partnerships, combined with domestic production of medical devices, is enhancing access to affordable, high-quality PAI systems across the region
Saudi Arabia Photoacoustic Imaging Market Insight
The Saudi Arabia photoacoustic imaging market held the largest share within the Middle East and Africa region in 2024, representing about 36.8% of global revenue. Saudi Arabia’s rapid market growth is supported by substantial government investments in advanced healthcare infrastructure, expanding biomedical research initiatives, and rising investments in diagnostic infrastructure. Major hospitals across urban regions are actively adopting PAI systems for clinical use, while domestic and international manufacturers continue to drive affordability and innovation in the field.
U.A.E. Photoacoustic Imaging Market Insight
The U.A.E. photoacoustic imaging market is expected to be the fastest-growing country in the Middle East and Africa region during the forecast period, with a projected CAGR of 21.5%. This growth is driven by increasing healthcare expenditure, rising prevalence of chronic diseases, expanding R&D activities, growing medical tourism, and improving access to advanced diagnostic tools in both urban and semi-urban regions. The country is witnessing rapid growth in hospital infrastructure and diagnostic centers, supported by government initiatives promoting advanced healthcare technologies and strong private sector investments.
Middle East and Africa Photoacoustic Imaging Market Share
The photoacoustic imaging industry is primarily led by well-established companies, including:
- PreXion Inc. (U.S.)
- iThera Medical GmbH (Germany)
- PST Inc. (South Korea)
- HÜBNER Photonics (Germany)
- Litron Lasers (U.K.)
- FUJIFILM Visualsonics, Inc. (Canada)
- Kibero (Switzerland)
- InnoLas Laser GmbH (Germany)
- QUANTEL LASER (France)
- GE HealthCare (U.S.)
- Ekspla (Lithuania)
- TomoWave Laboratories, Inc. (U.S.)
- Aspectus GmbH (Germany)
- Daylight Solutions (U.S.)
- ADVANTEST CORPORATION (Japan)
- illumiSonics Inc. (U.S.)
- OPOTEK LLC (U.S.)
- Seno Medical (U.S.)
- Vibronix, Inc. (U.S.)
Latest Developments in Middle East and Africa Photoacoustic Imaging Market
- In April 2025, researchers introduced Acoustic Loudness Factor (ALF)—a new benchmark parameter designed for small-molecule photoacoustic probes. ALF enables accurate prediction of dye performance in vivo, accelerating probe design and improving signal quality in diagnostic imaging
- In February March 2025, scientists at Wayne State University used PAI combined with pattern recognition to reveal distinct neural activation patterns in the prefrontal cortex during conditioned learning in rats—highlighting PAI’s emerging role in neuroscience research
- In April 2025, Duke University researchers published findings on using Acoustic Loudness Factor for benchmarking and enhancing small-molecule photoacoustic probes, setting a new standard for design and preclinical evaluation
- In May 2025, a joint A*STAR–NHG group in Singapore unveiled a first-in-human trial combining MSOT and AI-based segmentation for 3D tumor imaging—including basal cell carcinoma diagnostics—demonstrating high-resolution efficacy and potential to guide surgical planning
- In March 2025, Nature Reviews Bioengineering featured a commentary titled “Defining the clinical niche for photoacoustic imaging,” highlighting its growing therapeutic relevance in oncology and cardiovascular diagnostics—underscoring accelerated clinical adoption
SKU-

- Interactive Data Analysis Dashboard
- Company Analysis Dashboard for high growth potential opportunities
- Research Analyst Access for customization & queries
- Competitor Analysis with Interactive dashboard
- Latest News, Updates & Trend analysis
- Harness the Power of Benchmark Analysis for Comprehensive Competitor Tracking
Data collection and base year analysis are done using data collection modules with large sample sizes. The stage includes obtaining market information or related data through various sources and strategies. It includes examining and planning all the data acquired from the past in advance. It likewise envelops the examination of information inconsistencies seen across different information sources. The market data is analysed and estimated using market statistical and coherent models. Also, market share analysis and key trend analysis are the major success factors in the market report. To know more, please request an analyst call or drop down your inquiry.
The key research methodology used by DBMR research team is data triangulation which involves data mining, analysis of the impact of data variables on the market and primary (industry expert) validation. Data models include Vendor Positioning Grid, Market Time Line Analysis, Market Overview and Guide, Company Positioning Grid, Patent Analysis, Pricing Analysis, Company Market Share Analysis, Standards of Measurement, Global versus Regional and Vendor Share Analysis. To know more about the research methodology, drop in an inquiry to speak to our industry experts.
Data Bridge Market Research is a leader in advanced formative research. We take pride in servicing our existing and new customers with data and analysis that match and suits their goal. The report can be customized to include price trend analysis of target brands understanding the market for additional countries (ask for the list of countries), clinical trial results data, literature review, refurbished market and product base analysis. Market analysis of target competitors can be analyzed from technology-based analysis to market portfolio strategies. We can add as many competitors that you require data about in the format and data style you are looking for. Our team of analysts can also provide you data in crude raw excel files pivot tables (Fact book) or can assist you in creating presentations from the data sets available in the report.


