
Middle East And Africa Plasma Fractionation Market
Market Size in USD Billion
 USD
929.37 Billion
USD
1,362.67 Billion
2025
2033
USD
929.37 Billion
USD
1,362.67 Billion
2025
2033
| 2026 - 2033 | |
| USD 929.37 Billion | |
| USD 1,362.67 Billion | |
| % | |
|
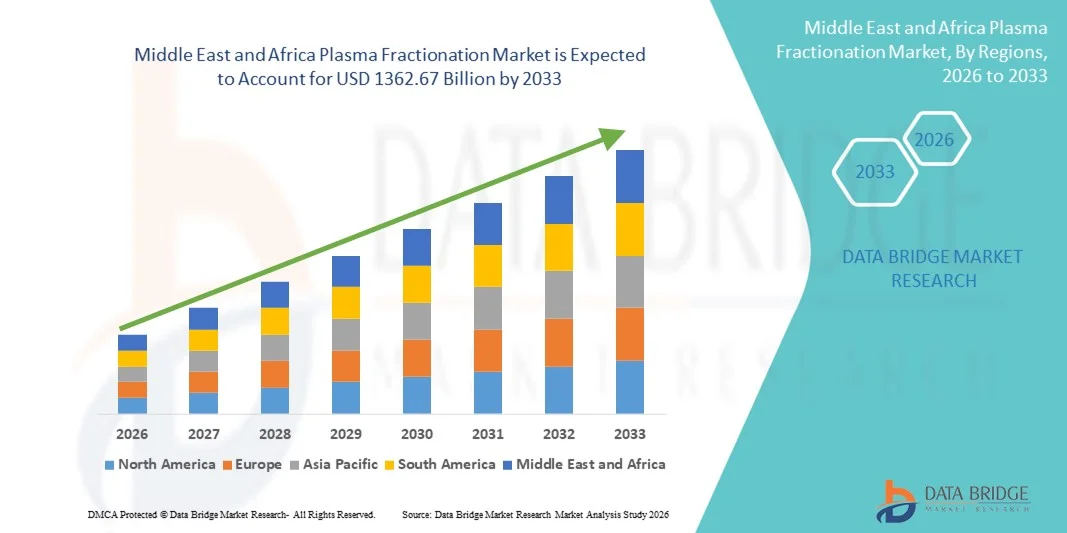
Middle East and Africa Plasma Fractionation Market Size
- The Middle East and Africa plasma fractionation market size was valued at USD 929.37 billion in 2025 and is expected to reach USD 1362.67 billion by 2033, at a CAGR of 4.90% during the forecast period
- The market growth is largely fueled by increasing demand for plasma-derived therapies, advancements in plasma fractionation technologies, and expanding healthcare infrastructure across developing regions
- Furthermore, rising prevalence of chronic and rare diseases such as immunodeficiency disorders, hemophilia, and neurological conditions is driving higher consumption of plasma-derived products, thereby significantly boosting the Plasma Fractionation market growth
Middle East and Africa Plasma Fractionation Market Analysis
- Plasma fractionation is a critical process used to separate and purify therapeutic proteins from human plasma, including immunoglobulins, clotting factors, and albumin, which are essential for treating various chronic and rare diseases
- The rising demand for plasma-derived therapies, coupled with continuous technological advancements in fractionation methods and increasing plasma donation initiatives, is driving significant growth in the plasma fractionation market
- The Saudi Arabia plasma fractionation market dominated the Middle East region with the largest revenue share of 36.9% in 2025, supported by strong government investment in healthcare infrastructure and biopharmaceutical manufacturing. The country benefits from well-established plasma collection and processing facilities and increasing focus on plasma self-sufficiency initiatives
- The U.A.E. plasma fractionation market is expected to be the fastest-growing in the region, registering a projected CAGR of 21.7% during the forecast period. Growth is driven by rising healthcare expenditure and rapid expansion of advanced healthcare infrastructure. Increasing investments in plasma collection networks support raw material availability
- The modern plasma fractionation segment dominated the largest market revenue share of 61.4% in 2025, driven by its superior efficiency, higher product yield, and enhanced safety standards
Report Scope and Plasma Fractionation Market Segmentation
|
Attributes |
Plasma Fractionation Key Market Insights |
|
Segments Covered |
|
|
Countries Covered |
Middle East and Africa
|
|
Key Market Players |
|
|
Market Opportunities |
|
|
Value Added Data Infosets |
In addition to the insights on market scenarios such as market value, growth rate, segmentation, geographical coverage, and major players, the market reports curated by the Data Bridge Market Research also include in-depth expert analysis, patient epidemiology, pipeline analysis, pricing analysis, and regulatory framework. |
Middle East and Africa Plasma Fractionation Market Trends
Rising Demand for Immunoglobulins and Plasma-Derived Therapies
- A major and rapidly accelerating trend in the global plasma fractionation market is the rising demand for immunoglobulins (IgG) and other plasma-derived therapies, driven by increased prevalence of immune disorders, chronic diseases, and rising awareness of plasma-based treatment options worldwide
- For instance, in 2023, the global shortage of immunoglobulin products and the increasing number of clinical indications led major plasma fractionators such as Grifols, CSL Behring, and Takeda to expand their plasma collection capacity and manufacturing facilities to meet global demand
- Plasma fractionation is increasingly used to produce life-saving therapies such as IVIG (Intravenous Immunoglobulin), albumin, clotting factors, and other plasma derivatives. As healthcare systems expand and more countries adopt reimbursement policies for rare diseases, the demand for plasma-derived products is expected to grow significantly
- The rising demand is also driven by increased approvals of new indications, greater access to treatment in developing regions, and growing patient populations with autoimmune disorders, all of which contribute to long-term market expansion
- This trend is reshaping the plasma fractionation landscape, forcing companies to invest heavily in plasma collection networks, advanced fractionation technology, and regulatory compliance, to ensure supply continuity and product safety
- As a result, major plasma companies are investing in new plasma centers and manufacturing expansions, especially in North America and Europe, to support growing global demand for plasma-derived therapies
Middle East and Africa Plasma Fractionation Market Dynamics
Driver
Growing Need for Plasma-Derived Therapies & Expanding Indications
- The global plasma fractionation market is being driven by the growing demand for plasma-derived therapies, including IVIG, albumin, and clotting factors, used to treat conditions such as immune deficiencies, hemophilia, and autoimmune disorders
- For instance, in 2022, major companies such as CSL Behring and Grifols announced expansions in their plasma collection and manufacturing operations to meet the growing demand for immunoglobulins and other plasma-based therapies
- The increasing prevalence of chronic and immune-related diseases, along with rising awareness and improved diagnosis, is driving the demand for plasma-derived products worldwide
- In addition, the growing availability of reimbursement for rare disease treatments in developing countries is further fueling market growth
- With continuous R&D and approvals for new indications, plasma fractionation remains a critical area of healthcare, supporting the growing need for biologic therapies globally
Restraint/Challenge
Plasma Supply Constraints and Stringent Regulatory Compliance
- The key challenge for the global plasma fractionation market is limited plasma supply, which creates a significant bottleneck for the production of plasma-derived therapies such as immunoglobulins, albumin, and clotting factors
- For instance, during 2021–2022, several plasma fractionations companies, including Grifols and CSL Behring, reported plasma collection shortages following disruptions caused by the COVID-19 pandemic. Reduced donor turnout and temporary closures of plasma collection centers in North America and Europe led to supply constraints and delayed availability of immunoglobulin products in multiple countries
- Plasma collection is highly dependent on voluntary donor participation, and any disruption caused by public health crises, regulatory changes, or donor eligibility restrictions can directly impact plasma availability and manufacturing continuity
- In addition, stringent regulatory requirements governing plasma collection, testing, storage, and fractionation vary across regions, increasing operational complexity and compliance costs for manufacturers
- The process of plasma fractionation also involves high capital investment, cold-chain logistics, advanced safety testing, and long production cycles, which limit rapid scalability and pose challenges for new market entrants
- Overcoming these restraints requires sustained investments in expanding plasma collection networks, improving donor retention programs, enhancing manufacturing efficiency, and maintaining strict regulatory compliance to ensure product safety and supply stability
Middle East and Africa Plasma Fractionation Market Scope
The market is segmented on the basis of product type, application, processing technology, mode, end user, and distribution channel.
- By Product Type
On the basis of product type, the Plasma Fractionation market is segmented into immunoglobulins, coagulation factor concentrates, albumin, protease inhibitors, and other products. The immunoglobulins segment dominated the largest market revenue share of 42.6% in 2025, driven by its extensive use in treating primary and secondary immunodeficiency disorders, autoimmune diseases, and neurological conditions such as CIDP and Guillain-Barré syndrome. Rising global prevalence of immune-related and chronic inflammatory diseases continues to fuel demand. Immunoglobulins are often administered as long-term or lifelong therapy, ensuring recurring consumption. Increasing awareness and early diagnosis of immune disorders further support segment growth. Favorable reimbursement coverage in developed regions strengthens adoption. Technological advancements improving product purity and safety also enhance physician preference. Expanding indications and off-label usage contribute to higher utilization. Strong plasma collection infrastructure in North America and Europe supports consistent supply. Growing geriatric population further increases demand. High clinical efficacy and established treatment guidelines reinforce dominance. Leading manufacturers continue to invest heavily in immunoglobulin capacity expansion. These factors collectively sustain the segment’s leadership position.
The coagulation factor concentrates segment is expected to witness the fastest CAGR of 8.9% from 2026 to 2033, driven by increasing incidence and improved diagnosis of hemophilia A and B globally. Rising awareness initiatives and patient screening programs are expanding the treated patient pool. Government-funded hemophilia care programs in emerging economies support access. Technological advancements enhancing viral safety and recombinant-plasma hybrid products boost confidence among clinicians. Growing adoption of prophylactic treatment regimens increases volume consumption. Expansion of specialty hemophilia treatment centers further supports demand. Increasing survival rates among hemophilia patients extend treatment duration. Favorable regulatory approvals for novel factor concentrates accelerate uptake. Strong pipeline activity and R&D investments contribute to innovation. Improved cold-chain logistics enhance distribution reach. Higher healthcare spending in Asia-Pacific supports adoption. These factors collectively drive rapid segment growth.
- By Application
On the basis of application, the Plasma Fractionation market is segmented into neurology, immunology, hematology, critical care, pulmonology, hemato-oncology, rheumatology, and others. The immunology segment accounted for the largest market revenue share of 34.8% in 2025, driven by widespread use of plasma-derived immunoglobulins in autoimmune and inflammatory disorders. Rising prevalence of conditions such as primary immunodeficiency, lupus, and rheumatoid arthritis fuels sustained demand. Long-term treatment requirements ensure continuous utilization. Increasing awareness among clinicians and patients improves diagnosis rates. Strong clinical evidence supporting immunoglobulin efficacy reinforces adoption. Favorable reimbursement frameworks in developed healthcare systems support accessibility. Expanding immunology specialty clinics boost treatment volumes. Technological advancements improving safety and tolerability increase physician confidence. Growth in elderly population further elevates disease incidence. Increasing hospital admissions related to immune disorders support demand. Pharmaceutical companies continue to expand immunology-focused plasma portfolios. These factors collectively strengthen segment dominance.
The neurology segment is projected to grow at the fastest CAGR of 9.4% from 2026 to 2033, driven by rising incidence of neurological disorders treated with plasma-derived therapies. Increasing diagnosis of CIDP, myasthenia gravis, and multifocal motor neuropathy supports growth. Aging populations in developed and emerging markets raise neurological disease burden. Expanding clinical approvals for neurological indications boost usage. Improved treatment outcomes encourage early intervention. Growing neurologist awareness and guideline adoption support market expansion. Rising healthcare expenditure improves patient access to advanced therapies. Increasing hospital-based neurology departments enhance treatment capacity. Ongoing clinical research strengthens therapeutic evidence. Expansion of specialty infusion centers supports administration. Asia-Pacific shows strong growth due to improving access. These factors collectively accelerate segment growth.
- By Processing Technology
On the basis of processing technology, the Plasma Fractionation market is segmented into ion-exchange chromatography, affinity chromatography, cryopreservation, ultrafiltration, and microfiltration. The ion-exchange chromatography segment dominated the market with a revenue share of 37.9% in 2025, driven by its efficiency, scalability, and cost-effectiveness in large-scale plasma protein separation. It is widely adopted by major plasma fractionation facilities worldwide. The technology offers consistent yield and high throughput, making it suitable for commercial production. Regulatory familiarity supports continued usage. Compatibility with multiple plasma-derived products enhances versatility. Lower operational complexity compared to advanced techniques supports dominance. Established infrastructure reduces switching costs. High reproducibility ensures batch consistency. Strong manufacturer expertise further reinforces adoption. Continuous optimization improves performance outcomes. Reliable purification efficiency supports product safety. These advantages collectively sustain market leadership.
The affinity chromatography segment is expected to witness the fastest CAGR of 10.1% from 2026 to 2033, driven by demand for high-purity plasma-derived products. The technology offers superior specificity and selectivity in protein isolation. Growing focus on product safety and regulatory compliance supports adoption. Advances in ligand development improve efficiency and cost-effectiveness. Increasing use in premium and specialty plasma products fuels growth. Rising R&D investments accelerate technology refinement. Adoption by next-generation fractionation facilities boosts penetration. Improved scalability addresses previous limitations. Strong demand from immunoglobulin and coagulation factor processing supports expansion. Enhanced recovery rates improve economic feasibility. Growing biopharmaceutical manufacturing capacity supports uptake. These factors drive rapid growth.
- By Mode
On the basis of mode, the Plasma Fractionation market is segmented into modern plasma fractionation and traditional plasma fractionation. The modern plasma fractionation segment dominated the largest market revenue share of 61.4% in 2025, driven by its superior efficiency, higher product yield, and enhanced safety standards. Modern fractionation techniques utilize advanced chromatography, automation, and closed processing systems, significantly reducing contamination risks. These methods enable the production of high-purity immunoglobulins and coagulation factors. Regulatory agencies increasingly favor modern processes due to improved traceability and compliance. Large plasma fractionation companies continue investing in facility upgrades to adopt modern technologies. Improved scalability supports growing global demand. Faster processing times enhance operational productivity. Reduced plasma wastage improves cost efficiency. Strong adoption in North America and Europe reinforces dominance. Growing demand for premium-quality plasma products supports continued usage. Integration with digital monitoring systems enhances process control. These factors collectively maintain segment leadership.
The traditional plasma fractionation segment is expected to witness the fastest CAGR of 7.2% from 2026 to 2033, driven by its continued relevance in cost-sensitive and emerging markets. Traditional methods remain widely used due to lower capital investment requirements. Developing countries rely on established fractionation techniques for basic plasma-derived products. Government-supported plasma programs support ongoing adoption. Incremental process improvements enhance safety and yield. Growing plasma collection volumes increase utilization of existing infrastructure. Rising healthcare access in emerging economies fuels demand. Public-sector manufacturing facilities continue using traditional processes. Increasing demand for essential therapies such as albumin supports growth. Technology transfer initiatives aid process optimization. Expansion of regional plasma centers supports adoption. These factors contribute to steady segment growth.
- By End User
On the basis of end user, the Plasma Fractionation market is segmented into hospitals & clinics, clinical research laboratories, academic institutions, and others. The hospitals & clinics segment accounted for the largest market revenue share of 48.7% in 2025, driven by high patient inflow and widespread administration of plasma-derived therapies. Hospitals serve as primary treatment centers for immunodeficiency, hemophilia, and critical care conditions. Availability of specialized infusion facilities supports product utilization. Increasing hospitalization rates related to chronic and rare diseases drive demand. Skilled healthcare professionals enable effective therapy administration. Favorable reimbursement policies in hospital settings support access. Expansion of tertiary and specialty hospitals increases treatment capacity. Rising adoption of prophylactic therapies boosts volume consumption. Strong diagnostic capabilities facilitate early intervention. Hospitals play a central role in emergency plasma product use. Increasing healthcare infrastructure investments support dominance. These factors collectively strengthen segment leadership.
The clinical research laboratories segment is projected to grow at the fastest CAGR of 9.6% from 2026 to 2033, driven by rising clinical trials and R&D activities. Increasing development of novel plasma-derived therapies boosts reagent demand. Growing focus on rare disease research supports laboratory usage. Expansion of biologics and biosimilar pipelines accelerates trial activity. Government and private funding for life sciences research fuels growth. Advanced analytical capabilities increase adoption. Collaboration between academia and industry supports expansion. Rising demand for process optimization studies boosts laboratory consumption. Increased regulatory requirements for clinical validation support usage. Growth in translational research strengthens demand. Emerging markets are investing heavily in research infrastructure. These factors collectively drive rapid growth.
- By Distribution Channel
On the basis of distribution channel, the Plasma Fractionation market is segmented into direct tenders, third-party distribution, and others. he direct tenders segment dominated the market with a revenue share of 55.9% in 2025, driven by bulk procurement by governments, hospitals, and healthcare organizations. Direct tenders ensure consistent supply of plasma-derived products at negotiated pricing. Public healthcare systems heavily rely on tender-based purchasing. Long-term contracts support predictable revenue streams for manufacturers. Reduced intermediary costs improve affordability. Strong adoption in Europe and emerging economies reinforces dominance. Transparency and regulatory oversight favor tender mechanisms. Large-volume purchasing supports economies of scale. National plasma programs commonly use direct procurement models. Tender-based systems enhance supply security. Growing demand for essential therapies sustains usage. These factors collectively maintain market leadership.
The third-party distribution segment is expected to register the fastest CAGR of 8.4% from 2026 to 2033, driven by expanding reach into remote and underserved regions. Distributors provide logistical support and cold-chain management. Increasing private healthcare facilities rely on distributors for flexible sourcing. Growth of specialty pharmacies supports distribution expansion. Emerging markets benefit from distributor networks for accessibility. Manufacturers leverage distributors to reduce operational complexity. Rising demand for outpatient and home-based therapies supports growth. Improved supply-chain infrastructure enhances efficiency. Strategic partnerships expand geographic coverage. Distributors support faster market entry for new products. Increasing healthcare privatization fuels demand. These factors drive accelerated segment growth.
Middle East and Africa Plasma Fractionation Market Regional Analysis
- The Middle East Plasma Fractionation market is projected to expand at a steady and substantial CAGR during the forecast period, driven by rising demand for plasma-derived therapies and increasing government focus on strengthening healthcare systems
- The region benefits from improving plasma collection infrastructure, expanding fractionation capabilities, and a growing burden of chronic and rare diseases such as immunodeficiency disorders and hemophilia
- Increasing demand for immunoglobulins, albumin, and coagulation factors across hospitals and specialty care centers is supporting market expansion. Government-led initiatives aimed at enhancing plasma self-sufficiency and reducing dependence on imports are strengthening regional supply chains
Saudi Arabia Plasma Fractionation Market Insight
The Saudi Arabia plasma fractionation market dominated the Middle East region with the largest revenue share of 36.9% in 2025, supported by strong government investment in healthcare infrastructure and biopharmaceutical manufacturing. The country has well-established plasma collection and processing facilities and a strong focus on plasma self-sufficiency initiatives. Increasing adoption of plasma-derived therapies across hospitals and specialty clinics drives demand. High healthcare spending and national healthcare transformation programs further support market leadership. Strategic collaborations with global biopharmaceutical companies enhance domestic production capacity. Favorable regulatory frameworks ensure quality and safety standards. Rising prevalence of immunological and hematological disorders boosts utilization. Expansion of advanced fractionation technologies supports scalability. These factors collectively reinforce Saudi Arabia’s dominant market position in the region.
U.A.E. Plasma Fractionation Market Insight
The U.A.E. plasma fractionation market is expected to be the fastest-growing in the Middle East, registering a projected CAGR of 21.7% during the forecast period. Growth is driven by rising healthcare expenditure and rapid expansion of advanced healthcare infrastructure. Increasing investments in plasma collection networks support raw material availability. Growing demand for immunoglobulins and plasma-derived products across hospitals and specialty care centers fuels market growth. Strong government initiatives to promote domestic biologics manufacturing accelerate expansion. Adoption of advanced fractionation technologies improves efficiency. Increasing medical tourism and presence of international healthcare providers support utilization. Rising awareness of plasma therapies among clinicians further boosts uptake. These factors position the U.A.E. as the fastest-growing plasma fractionation market in the region.
Middle East and Africa Plasma Fractionation Market Share
The Plasma Fractionation industry is primarily led by well-established companies, including:
• Grifols (Spain)
• Takeda Pharmaceutical Company (Japan)
• Octapharma (Switzerland)
• Kedrion Biopharma (Italy)
• LFB Group (France)
• Biotest AG (Germany)
• China Biologic Products Holdings (China)
• SK Plasma (South Korea)
• ADMA Biologics (U.S.)
• GC Pharma (South Korea)
• Sanquin (Netherlands)
• Bharat Serums and Vaccines (India)
• PlasmaGen BioSciences (India)
• Hualan Biological Engineering (China)
Latest Developments in Middle East and Africa Plasma Fractionation Market
- In June 2023, GC Biopharma received regulatory approval and began construction on Indonesia’s first plasma fractionation plant at Jababeka Industrial Estate, marking a major step in expanding plasma processing infrastructure in Southeast Asia and reducing dependence on imports for regionally produced plasma-derived medicines such as immunoglobulins and albumin
- In September 2023, Grifols received U.S. FDA approval for expanded immunoglobulin purification and filling capacity at its Clayton, North Carolina, facility, increasing annual output by 16 million grams of its leading Gamunex-C immunoglobulin brand — a key development supporting greater supply continuity for IVIG therapies used in immune-related conditions
- In April 2024, Takeda announced a US USD 230 million investment to expand its plasma-derived therapies facility in Los Angeles, aimed at increasing annual processing capacity by approximately 2 million liters of plasma, strengthening the infrastructure for SCIG/IVIG production in the largest single-country plasma market
- In December 2023, local media reported GC Biopharma’s major plan to open a 400,000-liter per year plasma fractionation plant in Indonesia, establishing a new manufacturing base for key plasma products in the Asia-Pacific region and enhancing access to critical therapies closer to patient populations
- In March 2025, Grifols completed the acquisition of the remaining 14 U.S. plasma collection centers previously co-owned with Immunotek, bringing full operational control of 28 centers under its subsidiary Biotek America LLC — significantly expanding the company’s plasma collection capacity in North America
- In July 2025, Grifols announced a €160 million investment to construct a new plasma fractionation facility in Lliçà de Vall, Barcelona, intended to double its European fractionation capacity and strengthen supply of plasma-derived products to more than 300,000 patients across Europe
SKU-

- Interactive Data Analysis Dashboard
- Company Analysis Dashboard for high growth potential opportunities
- Research Analyst Access for customization & queries
- Competitor Analysis with Interactive dashboard
- Latest News, Updates & Trend analysis
- Harness the Power of Benchmark Analysis for Comprehensive Competitor Tracking
Data collection and base year analysis are done using data collection modules with large sample sizes. The stage includes obtaining market information or related data through various sources and strategies. It includes examining and planning all the data acquired from the past in advance. It likewise envelops the examination of information inconsistencies seen across different information sources. The market data is analysed and estimated using market statistical and coherent models. Also, market share analysis and key trend analysis are the major success factors in the market report. To know more, please request an analyst call or drop down your inquiry.
The key research methodology used by DBMR research team is data triangulation which involves data mining, analysis of the impact of data variables on the market and primary (industry expert) validation. Data models include Vendor Positioning Grid, Market Time Line Analysis, Market Overview and Guide, Company Positioning Grid, Patent Analysis, Pricing Analysis, Company Market Share Analysis, Standards of Measurement, Global versus Regional and Vendor Share Analysis. To know more about the research methodology, drop in an inquiry to speak to our industry experts.
Data Bridge Market Research is a leader in advanced formative research. We take pride in servicing our existing and new customers with data and analysis that match and suits their goal. The report can be customized to include price trend analysis of target brands understanding the market for additional countries (ask for the list of countries), clinical trial results data, literature review, refurbished market and product base analysis. Market analysis of target competitors can be analyzed from technology-based analysis to market portfolio strategies. We can add as many competitors that you require data about in the format and data style you are looking for. Our team of analysts can also provide you data in crude raw excel files pivot tables (Fact book) or can assist you in creating presentations from the data sets available in the report.


