
Middle East And Africa Power Over Ethernet Poe Market
Market Size in USD Million
 USD
233.19 Million
USD
487.39 Million
2025
2033
USD
233.19 Million
USD
487.39 Million
2025
2033
| 2026 - 2033 | |
| USD 233.19 Million | |
| USD 487.39 Million | |
| % | |
|
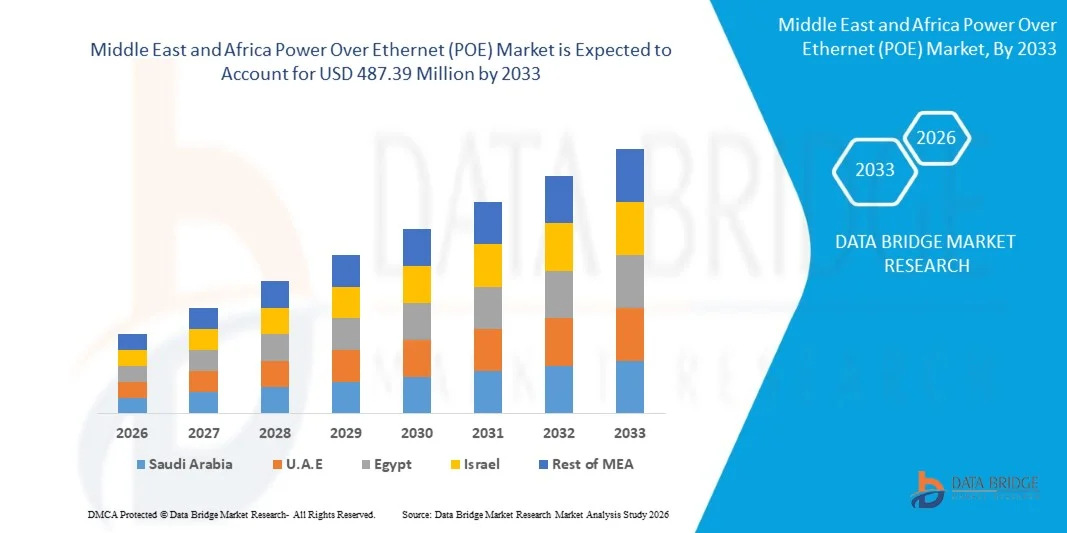
Middle East and Africa Power Over Ethernet (POE) Market Size
- The Middle East and Africa power over ethernet (POE) market size was valued at USD 233.19 million in 2025 and is expected to reach USD 487.39 million by 2033, at a CAGR of 10.7% during the forecast period
- The Middle East and Africa power over ethernet (PoE) Market comprises a comprehensive range of technologies, hardware components, semiconductor devices, power sourcing equipment (PSE), powered devices (PD), Ethernet switches, injectors, splitters, controllers, and connectivity infrastructure that enable the simultaneous transmission of electrical power and data over standard Ethernet cabling. PoE technology eliminates the need for separate electrical wiring by delivering low-voltage DC power alongside data signals through twisted-pair Ethernet cables, in accordance with IEEE 802.3af, 802.3at, and 802.3bt standards.
- Power over ethernet solutions play a critical role in supporting modern enterprise networking, smart building automation, industrial digitization, smart cities infrastructure, and next-generation IoT deployments. Core components within the ecosystem include PoE controller ICs, Ethernet PHY chips, power management semiconductors, structured cabling systems (Cat5e, Cat6, Cat6A), connectors, and surge protection devices. Additionally, PoE systems often incorporate advanced power negotiation, remote monitoring, intelligent load management, and energy efficiency optimization features to ensure reliable device performance across varying operational environments.
Middle East and Africa Power Over Ethernet (POE) Market Analysis
- The Middle East and Africa power over ethernet (PoE) Market is witnessing strong and sustained growth, driven by the rapid expansion of connected devices, increasing adoption of smart building technologies, proliferation of IP-based surveillance systems, and rising deployment of wireless communication infrastructure. Organizations across commercial, industrial, and public sectors are increasingly adopting PoE technology to enable simultaneous transmission of power and data over a single Ethernet cable, thereby reducing installation complexity, lowering infrastructure costs, and improving operational efficiency.
- The accelerated deployment of IP cameras, wireless access points (WAPs), VoIP phones, IoT sensors, LED lighting systems, and access control devices has significantly increased demand for PoE-enabled switches, injectors, and powered devices. As enterprises modernize network infrastructure to support digital transformation, edge computing, and intelligent automation systems, PoE technology provides centralized power management, enhanced scalability, and improved network reliability. Furthermore, compliance with IEEE 802.3af, 802.3at, and 802.3bt standards ensures interoperability, safety, and standardized power delivery across diverse deployment environments.
- In 2025, Saudi Arabia Dominates the Middle East and Africa power over ethernet (PoE) market, holding 16.82% share. This leadership is driven by growing adoption of smart building systems, expanding IT infrastructure, and increasing demand for connected devices. Additionally, rising investments in industrial automation, IoT deployments, and network upgrades are fueling market growth, making China the key contributor in the region.
- A.E. is the fastest-growing country in the power over ethernet (PoE) market, with a CAGR of 11.9% during the forecast period. This growth is driven by rapid digitalization, increasing adoption of smart building technologies, and expanding IT and telecommunications infrastructure. Additionally, rising demand for IoT devices, industrial automation, and energy-efficient networking solutions is contributing to India’s strong market growth.
- In 2025, the powered devices (PD) segment is projected to dominate the power over ethernet (PoE) market, capturing a 46.47% share. This growth is driven by increasing deployment of IP cameras, wireless access points, VoIP phones, and smart lighting systems. Rising adoption of IoT devices, industrial automation, and smart building technologies further supports the segment’s expansion, making PDs a key contributor to overall market growth.
Report Scope and Middle East and Africa Power Over Ethernet (POE) Market Segmentation
|
Attributes |
Middle East and Africa Power Over Ethernet (POE) Key Market Insights |
|
Segments Covered |
· By Product Category: Powered Devices (PD), Power Sourcing Equipment (PSE) and Network Cable · By Class Type: Class 4, Class 3, Class 0, Class 2, Class 1 and Others · By Mode: Mode A and Mode B · By Power Range: Up to 15 W, 15 W to 30 W, 30 W to 60 W, 60 W to 90 W and above 90 W · By Voltage Range: Up to 30 V, 30 V to 40 V, 40 V to 50 V and above 50 V · By Device Type: PoE Switch (Endspan), IP Cameras, Wireless Access Points, Voice over Internet Protocol (VoIP) & IP Phones, PoE Injector (Midspan), PTZ Cameras, PoE Lighting, Security Card Readers, IP Intercoms, IP Clocks, ATMs and Others · By Application: Access Control & Security, IoT Connectivity, Lighting Control, Infotainment and Others · By End User: Commercial, Industrial and Residential |
|
Countries Covered |
Middle East and Africa · Saudi Arabia · U.A.E. · South Africa · Egypt · Israel · Rest of Middle East and Africa |
|
Key Market Players |
· Versa Technology, Inc. (U.S.) · Texas Instruments Incorporated (U.S.) · Cisco Systems, Inc. (U.S.) · Monolithic Power Systems, Inc. (U.S.) · STMicroelectronics N.V. (Switzerland) · Intellinet Network Solutions (U.S.) · Veracity UK Ltd (U.K.) · Molex, LLC (U.S.) · Microchip Technology Incorporated (U.S.) · NETGEAR, Inc. (U.S.) · Analog Devices, Inc. (U.S.) · Semiconductor Components Industries, LLC (U.S.) · EtherWAN Systems, Inc. (U.S.) · TP-Link Corporation Limited (China) · Black Box Corporation (U.S.) · Edimax Technology Co., Ltd. (Taiwan) · Siemens AG (Germany) · Hewlett Packard Enterprise Development LP (U.S.) · R&M (Reichle & De-Massari AG) (Switzerland) · Eaton Corporation plc (Tripp Lite) (Ireland) · Advantech Co., Ltd. (Taiwan) · Broadcom Inc. (U.S.) · TRENDnet, Inc. (U.S.) · CommScope Holding Company, Inc. (U.S.) · ECI Networks Ltd. (U.K.) · Allied Telesis, Inc. (Japan) |
|
Market Opportunities |
· Growth of industrial IoT, Industry 4.0, and edge computing deployments, where PoE can simplify powering distributed sensors, cameras, and controllers. · Increasing adoption in healthcare, retail, transportation, and education for connected devices such as displays, kiosks, security systems, and access control. · Development of higher-power and more efficient PoE standards and chipsets, broadening the range of supported devices and use cases |
|
Value Added Data Infosets |
In addition to the insights on market scenarios such as market value, growth rate, segmentation, geographical coverage, and major players, the market reports curated by the Data Bridge Market Research also include in-depth expert analysis, geographically represented company-wise production and capacity, network layouts of distributors and partners, detailed and updated price trend analysis and deficit analysis of supply chain and demand. |
Middle East and Africa Power Over Ethernet (POE) Market Trends
“Accelerating Deployment of Ip Cameras, Wireless Access Points, VoIP Phones, Access Control, and IoT Devices”
- The accelerating deployment of IP cameras, wireless access points, VoIP phones, access control systems, and a rapidly expanding base of IoT devices is significantly driving the growth trajectory of the Middle East and Africa Power over Ethernet PoE market. As enterprises, governments, transportation authorities, healthcare institutions, and smart city planners modernize infrastructure, there is a strong shift toward unified IP based networks that transmit both data and power over a single Ethernet cable.
- This reduces cabling complexity, lowers installation costs, improves energy efficiency, and enables centralized power management. Increasing security surveillance mandates, public Wi Fi expansion, digital classrooms, smart hospitals, and intelligent building automation are creating dense device environments where PoE switches and injectors are becoming foundational infrastructure. The proliferation of edge devices requiring reliable low voltage power is therefore transforming PoE from a convenience technology into a strategic backbone for connected ecosystems worldwide.
- The above developments across globereflect a structural transition toward IP driven physical infrastructure and connected environments. Large scale public investments in smart governance, digital connectivity, transportation intelligence, and security modernization are consistently increasing the density of powered edge devices. As organizations prioritize centralized power management, simplified installation, scalability, and energy efficiency, PoE technology becomes a preferred solution for supporting distributed IP cameras, wireless access points, VoIP phones, and IoT sensors. This sustained infrastructure digitization across sectors strongly reinforces long term growth momentum for the Middle East and Africa Power over Ethernet market.
Middle East and Africa Power Over Ethernet (POE) Market Dynamics
Driver
Growing Adoption of Smart Buildings, Smart Cities, and Intelligent Infrastructure, Where POE Simplifies Cabling, Reduces Installation Time, and Lowers Total Cost of Ownership
- The growing adoption of smart buildings, smart cities, and intelligent infrastructure is emerging as a strong structural driver for the Middle East and Africa Power over Ethernet PoE market. Governments and urban planners worldwide are prioritizing digitally integrated infrastructure where lighting systems, surveillance cameras, wireless access points, digital signage, building automation controls, and IoT sensors operate over unified IP networks. In these environments, PoE technology simplifies cabling architecture by transmitting both power and data through a single Ethernet cable, significantly reducing wiring complexity, lowering installation time, and minimizing overall material and labor costs. As public infrastructure projects increasingly embed intelligent monitoring, energy management, and security systems into core designs, PoE enabled switches and injectors are becoming foundational to cost efficient and scalable deployment. The transition toward low voltage intelligent infrastructure across commercial buildings, transport hubs, healthcare facilities, educational campuses, and municipal projects is therefore accelerating long term demand for PoE solutions in Middle East and Africa.
- In December 2024, Press Information Bureau reported that all 100 cities under Saudi Arabia Smart Cities Mission have operational Integrated Command and Control Centres (ICCCs) that use AI, IoT, CCTV surveillance networks, and data analytics for urban services including traffic, safety, and utility monitoring.
- In August 2025, Sony Semiconductor Solutions reported deployments of advanced edge AI sensing technologies in smart city applications in Lakewood, Colorado and San José, California, demonstrating how connected sensing platforms are being scaled up for safer, more intelligent urban mobility and infrastructure.
- In March 2025, arXiv documented the Smart Santander project in South Africa, which involves large‑scale deployment of IoT devices and sensors throughout the city to support smart city experimentation and real‑life connected services across mobility, environment, and safety domains.
- In July 2022, arXiv documented that the Aveiro Tech City Living Lab in Portugal was described as deploying a connected communications network with sensors, video cameras, and environmental monitors across multiple urban access points to support IoT services and smart city applications.
- In February 2026, Times of U.A.E. reported Nashik Smart City Development Corporation Ltd planned deployment of over 4,000 AI-enabled CCTV cameras and 18 drones integrated with modern data centres for monitoring during the Simhastha Kumbh Melahighlighting smart surveillance roll-outs.
- The above developments across major economies demonstrate a sustained Middle East and Africa shift toward intelligent and digitally connected infrastructure. As governments embed smart systems into urban planning and building modernization, the need for simplified power and data integration becomes critical. PoE technology directly aligns with these requirements by reducing cabling complexity, lowering installation costs, improving scalability, and enhancing centralized control. The continuous expansion of smart cities and connected buildings across regions therefore reinforces strong medium to long term growth momentum for the Middle East and Africa Power over Ethernet market.
Restraint/Challenge
Higher Upfront Costs of POE-Capable Switches, Midspans, and Compliant Cabling Compared with Conventional Networking Equipment In Cost-Sensitive Deployments.
The higher upfront costs associated with PoE‑capable switches, midspans, and compliant cabling infrastructure remain a notable restraint on expansion of the Middle East and Africa Power over Ethernet (PoE) market, particularly in cost‑sensitive environments. While PoE technology delivers long‑term efficiency and centralized power and network management, initial capital investment requirements including premium priced network switches, specialized patch panels, Category 6/6A cabling, and professional installation can be significantly higher than conventional non‑PoE network deployments. These higher upfront costs particularly constrain smaller enterprises, public institutions, and budget‑limited projects where infrastructure budgets are tightly regulated. Furthermore, retrofitting legacy buildings with PoE‑ready structured cabling often necessitates extensive upgrades, adding to project costs. As a result, even though PoE offers operational savings over time, large initial expenses can delay adoption decisions and reduce penetration in price‑competitive segments, thereby tempering overall market growth.
For Instance,
- In June 2024, EdTech Magazine reported that many educational districts are struggling to secure funding to upgrade network infrastructure such as high performance switches and cabling to support advanced connectivity devices, noting that cost constraints delay adoption of modern network systems including PoE capable installations.
- In July 2024, E School News reported that schools face expensive upgrade costs for cabling and switches to support PoE networking hardware, with limited eligibility of federal discount funding for these projects reducing adoption.
- In October 2024, Smart Cities Dive reported that states and municipalities often delay modernizing IT infrastructure due to the significant upfront costs required for equipment and network upgrades, despite recognition of long term efficiency benefits.
- In April 2025, TechRadar reported that upgrading legacy network infrastructure to Category 6A cabling and PoE capable switches to support high power devices involves substantially higher material and labour costs compared with conventional cabling systems.
- In April 2025, Computer Weekly reported that cost barriers are affecting the rollout of smart building networking projects in public sector estates, with some authorities pushing back on PoE enabled installations due to expensive hardware and compliance upgrades.
- Even as Power over Ethernet technology offers operational efficiencies, simplified cabling, and improved centralized power and network monitoring, its higher upfront costs remain a material restraint in cost‑sensitive segments. Infrastructure projects requiring extensive cabling upgrades, premium PoE‑capable switches, and professional installation services place fiscal pressure on organizations with limited capital budgets, such as school districts, small municipalities, and mid‑sized enterprises. These higher initial expenditures extend payback periods and complicate budget approval cycles, particularly where non‑PoE alternatives may appear cheaper in the short term. Consequently, concerns around upfront capital outlay continue to temper adoption rates and pose a strategic challenge for broader market penetration of PoE solutions in Middle East and Africa.
Middle East and Africa Power Over Ethernet (POE) Market Scope
The Middle East and Africa power over ethernet (POE) Market is segmented into eight notable segments based on type, class type, modes, power range, voltage range, device type, application, and end-user.
By type
On the basis of type, the Middle East and Africa power over ethernet (PoE) Market is segmented into Powered Devices (PD), Power Sourcing Equipment (PSE), and Network Cable. In 2026, the Powered Devices (PD) segment is expected to dominate the Middle East and Africa Power over Ethernet (PoE) market, capturing a 46.48% share. This growth is driven by increasing deployment of IP cameras, wireless access points, VoIP phones, and smart lighting systems. Rising adoption of IoT devices, industrial automation, and smart building technologies further supports the segment’s expansion, making PDs a key contributor to overall market growth.
The Network Cable segment in the Middle East and Africa power over ethernet (PoE) market is expected to register the fastest growth, with a CAGR of 11.4% from 2026 to 2033. This growth is driven by increasing demand for high-speed data transmission, expanding enterprise and industrial networks, and rising adoption of IoT and smart building applications. Additionally, the growing need for reliable, low-voltage power distribution alongside data is fueling the segment’s rapid expansion in the region.
By class type
On the basis of class type, the Middle East and Africa power over ethernet (PoE) market is segmented into Class 0, Class 1, Class 2, Class 3, Class 4, and Others. In 2026, the Class 4 segment is expected to dominate, capturing a 26.63% share. This leadership is driven by increasing demand for high-power devices, growing deployment of advanced IP cameras, wireless access points, and industrial automation equipment, as well as rising adoption of smart building and IoT applications worldwide.
The Class 3 segment in the Middle East and Africa power over ethernet (PoE) market is expected to witness the fastest growth, registering a CAGR of 11.4% from 2026 to 2033. This growth is driven by increasing demand for mid-power PoE devices, rising deployment of IP cameras, wireless access points, and VoIP phones, and the expansion of smart building and industrial automation applications across the region. Additionally, the need for efficient power delivery over Ethernet cables is further fueling the segment’s rapid adoption.
By modes
On the basis of modes, the Middle East and Africa power over ethernet (PoE) market is segmented into Mode A and Mode B. In 2026, the Mode A segment is anticipated to dominate, capturing a 63.37% share. This leadership is driven by its widespread use in powering IP cameras, wireless access points, and VoIP phones, along with compatibility with existing Ethernet infrastructure. Additionally, Mode A enables efficient simultaneous transmission of power and data, supporting the growing adoption of smart building, IoT, and industrial automation applications in the region.
The Mode B segment in the Middle East and Africa power over ethernet (PoE) market is expected to witness the fastest growth, registering a CAGR of 11.5% from 2026 to 2033. This growth is driven by increasing deployment of high-power devices such as advanced IP cameras, PoE lighting, and industrial automation equipment. Additionally, the rising adoption of smart building systems, IoT applications, and the need for efficient power delivery over Ethernet cables are fueling the rapid expansion of the Mode B segment in the region.
By power range
On the basis of power range, the Middle East and Africa power over ethernet (PoE) market is segmented into Up to 15W, 15W to 30W, 30W to 60W, 60W to 90W, and Above 90W. In 2026, the 15W to 30W segment is expected to dominate, capturing a 34.36% share. This dominance is driven by the widespread deployment of mid-power PoE devices such as IP cameras, wireless access points, and VoIP phones. Additionally, growing adoption of smart building systems, industrial automation, and IoT applications is further fueling the segment’s growth in the region.
The 60W to 90W segment in the Middle East and Africa power over ethernet (PoE) market is expected to witness the fastest growth, registering a CAGR of 11.4% from 2026 to 2033. This growth is driven by increasing demand for high-power PoE devices, including advanced IP cameras, PoE lighting, and industrial automation equipment. Additionally, the rising adoption of smart building systems, IoT applications, and efficient power delivery over Ethernet cables is fueling the rapid expansion of this segment in the region.
By voltage range
On the basis of voltage range, the Middle East and Africa power over ethernet (PoE) market is segmented into Up to 30V, 30V to 40V, 40V to 50V, and Above 50V. In 2026, the 40V to 50V segment is anticipated to dominate, capturing a 38.78% share. This leadership is driven by the widespread deployment of PoE-enabled devices such as IP cameras, wireless access points, and VoIP phones, which require stable mid-range voltage for efficient operation. Additionally, growing adoption of smart building systems, industrial automation, and IoT applications is further supporting the segment’s dominance in the region.
The Above 50V segment in the Middle East and Africa power over ethernet (PoE) market is expected to witness the fastest growth, registering a CAGR of 10.9% from 2026 to 2033. This growth is driven by increasing deployment of high-power PoE devices, including industrial automation equipment, advanced IP cameras, and PoE lighting systems. Additionally, the rising adoption of smart building technologies, IoT applications, and the need for efficient power delivery over Ethernet cables are fueling the rapid expansion of this segment in the region.
By device type
On the basis of device type, the Middle East and Africa power over ethernet (PoE) market is segmented into PoE Switch (Endspan), PoE Injector (Midspan), PoE Lighting, ATMs, IP Intercoms, Security Card Readers, IP Clocks, PTZ Cameras, VoIP & IP Phones, IP Cameras, Wireless Access Points, and Others. In 2026, the PoE Switch (Endspan) segment is expected to dominate, capturing a 26.17% share. This leadership is driven by the growing deployment of network infrastructure in enterprises, commercial buildings, and industrial facilities. Additionally, increasing demand for centralized power management, efficient data and power delivery, and support for IoT and smart building applications is fueling the segment’s dominance in the region.
The PoE Lighting segment in the Middle East and Africa power over ethernet (PoE) market is expected to witness the fastest growth, registering a CAGR of 12.3% from 2026 to 2033. This growth is driven by increasing adoption of energy-efficient smart lighting solutions in commercial, residential, and industrial buildings. Additionally, rising investments in smart building infrastructure, IoT-enabled lighting systems, and the demand for simplified installation with centralized power management are fueling the rapid expansion of the PoE Lighting segment in the region.
By application
On the basis of application, the Middle East and Africa power over ethernet (PoE) market is segmented into IoT Connectivity, Lighting Control, Infotainment, Access Control & Security, and Others. In 2026, the Access Control & Security segment is anticipated to dominate, capturing a 30.60% share. This leadership is driven by increasing deployment of surveillance cameras, security card readers, and access control systems in commercial, industrial, and residential buildings. Additionally, rising adoption of smart building technologies, IoT-enabled security solutions, and demand for centralized power and data management are fueling the segment’s growth in the region.
The Lighting Control segment in the Middle East and Africa Power over Ethernet (PoE) market is expected to witness the fastest growth, registering a CAGR of 11.2% from 2026 to 2033. This growth is driven by increasing adoption of energy-efficient PoE-based smart lighting systems in commercial, industrial, and residential buildings. Additionally, rising investments in smart building infrastructure, IoT-enabled lighting solutions, and the need for centralized power management and simplified installation are fueling the rapid expansion of the Lighting Control segment in the region.
By End User
On the basis of end user, the Middle East and Africa power over ethernet (PoE) market is segmented into Commercial, Residential, and Industrial. In 2026, the Commercial segment is expected to dominate, capturing a 62.41% share. This leadership is driven by increasing deployment of PoE-enabled devices such as IP cameras, wireless access points, and VoIP phones in offices, retail spaces, and commercial buildings. Additionally, rising adoption of smart building technologies, IoT connectivity, and centralized power management solutions is fueling the segment’s growth in the region.
The Industrial segment in the Middle East and Africa power over ethernet (PoE) market is expected to witness the fastest growth, registering a CAGR of 11.2% from 2026 to 2033. This growth is driven by increasing adoption of PoE-enabled devices in manufacturing facilities, industrial automation systems, and smart factories. Additionally, rising demand for IoT connectivity, energy-efficient power distribution, and centralized network management is fueling the rapid expansion of the Industrial segment in the region.
Middle East and Africa Power Over Ethernet (POE) Market Insight
The Middle East and Africa power over ethernet (PoE) market commands the largest share globally, supported by the region’s robust offshore energy network, advanced maritime expertise, and mature subsea engineering capabilities. Extensive offshore oil & gas activities, expanding offshore wind projects, and rising investments in marine research and defense upgrades are significantly driving the adoption of autonomous and remotely operated underwater vehicles.
Saudi Arabia Power Over Ethernet (POE) Market Insight
The Saudi Arabia power over ethernet (PoE) market commands the largest share regionally, supported by the region’s robust offshore energy network, advanced maritime expertise, and mature subsea engineering capabilities. Extensive offshore oil & gas activities, expanding offshore wind projects, and rising investments in marine research and defense upgrades are significantly driving the adoption of autonomous and remotely operated underwater vehicles.
U.A.E. Power Over Ethernet (POE) Market Insight
The U.A.E. power over ethernet (PoE) market is anticipated to witness robust growth, driven by increasing investments in smart city initiatives, expanding digital infrastructure, and rising adoption of IoT-enabled devices across commercial, industrial, and residential sectors. India’s focus on modernizing urban connectivity, implementing intelligent building systems, and enhancing networked surveillance and access control solutions is accelerating the deployment of PoE-enabled devices for efficient power delivery, centralized management, and streamlined maintenance across the country.
The Major Market Leaders Operating in the Market Are:
- Versa Technology, Inc. (U.S.)
- Texas Instruments Incorporated (U.S.)
- Cisco Systems, Inc. (U.S.)
- Monolithic Power Systems, Inc. (U.S.)
- STMicroelectronics N.V. (Switzerland)
- Intellinet Network Solutions (U.S.)
- Veracity UK Ltd (U.K.)
- Molex, LLC (U.S.)
- Microchip Technology Incorporated (U.S.)
- NETGEAR, Inc. (U.S.)
- Analog Devices, Inc. (U.S.)
- Semiconductor Components Industries, LLC (U.S.)
- EtherWAN Systems, Inc. (U.S.)
- TP-Link Corporation Limited (China)
- Black Box Corporation (U.S.)
- Edimax Technology Co., Ltd. (Taiwan)
- Siemens AG (Germany)
- Hewlett Packard Enterprise Development LP (U.S.)
- R&M (Reichle & De-Massari AG) (Switzerland)
- Eaton Corporation plc (Tripp Lite) (Ireland)
- Advantech Co., Ltd. (Taiwan)
- Broadcom Inc. (U.S.)
- TRENDnet, Inc. (U.S.)
- CommScope Holding Company, Inc. (U.S.)
- ECI Networks Ltd. (U.K.)
- Allied Telesis, Inc. (Japan)
Latest Developments in Middle East and Africa Power Over Ethernet (POE) Market
- In February 2026, Cisco introduced the Silicon One G300 networking silicon, expanding its high-performance silicon portfolio to support next-generation routing and switching platforms optimized for scalable, high-bandwidth data center and service provider networks. The launch was positioned to strengthen Cisco’s in-house silicon roadmap for cloud and AI-driven traffic growth.
- In February 2026, Cisco expanded its AgenticOps innovations across its portfolio, extending AI-driven, autonomous operations capabilities to improve network management, observability, and security workflows. The move was aimed at reducing operational complexity and accelerating intent-based, automated network operations at scale.
- In February 2026, Broadcom Introduces Industry’s First 6G Digital Front-End SoC for Massive MIMO. New 0.4-8.5GHz CMOS radio digital front-end solution delivers breakthrough RF performance and power consumption for next-generation 5G Advanced and 6G networks.
- In November 2025, Broadcom Introduces the World’s First Quantum-Safe Gen 8 128G SAN Switch Portfolio
SKU-

- Interactive Data Analysis Dashboard
- Company Analysis Dashboard for high growth potential opportunities
- Research Analyst Access for customization & queries
- Competitor Analysis with Interactive dashboard
- Latest News, Updates & Trend analysis
- Harness the Power of Benchmark Analysis for Comprehensive Competitor Tracking
Table of Content
1 INTRODUCTION
1.1 OBJECTIVES OF THE STUDY
1.2 MARKET DEFINITION
1.3 OVERVIEW OF MIDDLE EAST AND AFRICA POWER OVER ETHERNET (POE) MARKET
1.4 CURRENCY AND PRICING
1.5 LIMITATIONS
1.6 MARKETS COVERED
2 MARKET SEGMENTATION
2.1 MARKETS COVERED
2.2 GEOGRAPHICAL SCOPE
2.3 YEARS CONSIDERED FOR THE STUDY
2.4 DBMR TRIPOD DATA VALIDATION MODEL
2.5 PRIMARY INTERVIEWS WITH KEY OPINION LEADERS
2.6 DBMR MARKET POSITION GRID
2.7 VENDOR SHARE ANALYSIS
2.8 MULTIVARIATE MODELING
2.9 TYPE TIMELINE CURVE
2.1 MARKET END-USER COVERAGE GRID
2.11 SECONDARY SOURCES
2.12 ASSUMPTIONS
3 EXECUTIVE SUMMARY
4 PREMIUM INSIGHTS
4.1 PORTERS FIVE FORCES ANALYSIS
4.2 INDUSTRY ANALYSIS & FUTURISTIC SCENARIO
4.2.1 TECHNOLOGICAL ADVANCEMENTS AND STANDARD EVOLUTION
4.2.2 ADOPTION ACROSS INDUSTRY VERTICALS
4.2.3 INFRASTRUCTURE CHALLENGES AND INTEGRATION BARRIERS
4.2.4 REGULATORY LANDSCAPE AND SECURITY CONSIDERATIONS
4.2.5 FUTURE OUTLOOK AND STRATEGIC OPPORTUNITIES
4.3 COMPANY COMPETITIVE ANALYSIS
4.3.1 CISCO SYSTEMS, INC.
4.3.2 NETGEAR, INC.
4.3.3 HEWLETT PACKARD ENTERPRISE / HPE ARUBA NETWORKING
4.3.4 TEXAS INSTRUMENTS INCORPORATED
4.3.5 ANALOG DEVICES, INC.
4.3.6 BROADCOM INC.
4.3.7 MICROCHIP TECHNOLOGY INC.
5 TARIFFS & IMPACT ON THE MIDDLE EAST AND AFRICA POWER OVER ETHERNET (POE) MARKET
5.1 OVERVIEW
5.2 TARIFF STRUCTURES
5.2.1 EUROPEAN UNION
5.2.1.1 TYPICAL CN / TARIC CLASSIFICATIONS FOR POE‑RELATED PRODUCTS
5.2.1.1.1 NETWORK SWITCHES & ACTIVE POE DEVICES
5.2.1.1.2 INJECTORS, POE MIDSPANS & POWER SUPPLIES
5.2.1.1.3 CABLES & CONNECTORS RELATED TO POE
5.2.1.1.4 HOW DUTIES ARE APPLIED:
5.2.1.2 VALUE ADDED TAX (VAT) & OTHER CHARGES
5.2.2 UNITED STATES
5.2.2.1 UNITED STATES TARIFF SYSTEM
5.2.2.2 TYPICAL HTSUS CODES FOR POE‑RELATED PRODUCTS & DUTY RATES
5.2.2.2.1 POE NETWORK SWITCHES / DATA NETWORKING APPARATUS
5.2.2.2.2 POE INJECTORS / POWER SUPPLIES
5.2.2.2.3 ETHERNET CABLES & CONNECTORS
5.2.2.3 SPECIAL U.S. TRADE MEASURES THAT AFFECT TARIFFS
5.2.2.4 ADDITIONAL CHARGES BEYOND CUSTOMS DUTY
5.2.3 ASIA-PACIFIC
5.2.3.1 PRODUCT CLASSIFICATION FOR POE EQUIPMENT
5.2.3.2 CHINA (IMPORTER) – EXAMPLE TARIFF PROFILE
5.2.3.3 JAPAN – LOW TARIFFS ON ELECTRONICS
5.2.3.4 PHILIPPINES – ASEAN REGION
5.2.3.5 AUSTRALIA & NEW ZEALAND (RCEP MEMBERS)
5.2.3.6 OTHER ASIA‑PACIFIC TARIFF HIGHLIGHTS
5.3 INCREASED COSTS OF PRODUCTION
5.3.1 RAW MATERIALS AND COMPONENTS
5.3.2 FINISHED PRODUCTS
5.4 DISRUPTION OF EUROPE SUPPLY CHAINS
5.4.1 MANUFACTURING SHIFTS
5.4.2 TRADE CONFLICTS
5.5 IMPACT ON R&D AND INNOVATION
5.6 PRICE VOLATILITY
5.6.1 FLUCTUATING PRICES
5.6.2 END-CONSUMER COSTS
5.7 GEOPOLITICAL TENSIONS AND MARKET SHIFTS
5.7.1 SHIFTS IN PRODUCTION LOCATIONS
5.7.2 REGIONAL SUPPLY CHAINS
5.8 IMPACT ON SMALLER AND DEVELOPING MARKETS
5.8.1 DISADVANTAGES FOR SMALLER PLAYERS
6 REGULATORY STANDARDS
6.1 NATIONAL REGULATORY FRAMEWORK
6.1.1 REGULATORY AUTHORITIES & MANDATES
6.1.2 PRODUCT CLASSIFICATION & REGULATED CATEGORIES
6.2 PRODUCT REGISTRATION, CERTIFICATION & MARKET ACCESS
6.2.1 REGISTRATION & CLAIMS GOVERNANCE
6.2.2 CONFORMITY ASSESSMENT & TESTING
6.3 LABELING, PACKAGING & CLAIM REQUIREMENTS
6.3.1 LABELING & INFORMATION REQUIREMENTS
6.4 SAFETY, TESTING & QUALITY STANDARDS
6.4.1 TECHNICAL STANDARDS & RISK MANAGEMENT
6.5 POST-MARKET SURVEILLANCE & ENFORCEMENT
6.6 REGULATORY INTERACTIONS & BORDER CONTROLS
6.6.1 IMPORT OVERSIGHT & CERTIFICATION VERIFICATION
6.7 REGULATORY GAPS & MARKET IMPLICATIONS
7 MARKET OVERVIEW
7.1 DRIVERS
7.1.1 ACCELERATING DEPLOYMENT OF IP CAMERAS, WIRELESS ACCESS POINTS, VOIP PHONES, ACCESS CONTROL, AND IOT DEVICES
7.1.2 GROWING ADOPTION OF SMART BUILDINGS, SMART CITIES, AND INTELLIGENT INFRASTRUCTURE, WHERE POE SIMPLIFIES CABLING, REDUCES INSTALLATION TIME, AND LOWERS TOTAL COST OF OWNERSHIP.
7.1.3 EXPANSION OF ENTERPRISE IT NETWORKS AND EDGE DEVICES, DRIVING DEMAND FOR SCALABLE, CENTRALLY MANAGED POWER DELIVERY THROUGH ETHERNET SWITCHES AND INJECTORS.
7.1.4 RISING FOCUS ON ENERGY EFFICIENCY, CENTRALIZED POWER MANAGEMENT, AND NETWORK-BASED MONITORING, STRENGTHENING THE VALUE PROPOSITION OF POE-ENABLED ARCHITECTURES.
7.2 RESTRAINTS
7.2.1 HIGHER UPFRONT COSTS OF POE-CAPABLE SWITCHES, MIDSPANS, AND COMPLIANT CABLING COMPARED WITH CONVENTIONAL NETWORKING EQUIPMENT IN COST-SENSITIVE DEPLOYMENTS.
7.2.2 DISTANCE AND POWER LIMITATIONS INHERENT TO ETHERNET STANDARDS, WHICH CAN RESTRICT USE IN VERY LARGE OR HIGH-POWER INSTALLATIONS WITHOUT ADDITIONAL INFRASTRUCTURE.
7.3 OPPORTUNITIES
7.3.1 GROWTH OF INDUSTRIAL IOT, INDUSTRY 4.0, AND EDGE COMPUTING DEPLOYMENTS, WHERE POE CAN SIMPLIFY POWERING DISTRIBUTED SENSORS, CAMERAS, AND CONTROLLERS.
7.3.2 INCREASING ADOPTION IN HEALTHCARE, RETAIL, TRANSPORTATION, AND EDUCATION FOR CONNECTED DEVICES SUCH AS DISPLAYS, KIOSKS, SECURITY SYSTEMS, AND ACCESS CONTROL.
7.3.3 DEVELOPMENT OF HIGHER-POWER AND MORE EFFICIENT POE STANDARDS AND CHIPSETS, BROADENING THE RANGE OF SUPPORTED DEVICES AND USE CASES.
7.4 CHALLENGES
7.4.1 MANAGING HEAT DISSIPATION, POWER EFFICIENCY, AND RELIABILITY AS HIGHER-POWER POE APPLICATIONS BECOME MORE COMMON IN DENSE NETWORK ENVIRONMENTS.
7.4.2 MAINTAINING CYBERSECURITY AND NETWORK RESILIENCE, AS MORE CRITICAL DEVICES BECOME DEPENDENT ON IP NETWORKS FOR BOTH POWER AND DATA.
8 MIDDLE EAST AND AFRICA POWER OVER ETHERNET (POE) MARKET, BY TYPE
8.1 OVERVIEW
8.2 MIDDLE EAST AND AFRICA POWER OVER ETHERNET (POE) MARKET, 2018-2033, (USD THOUSAND)
8.3 MIDDLE EAST AND AFRICA POWER OVER ETHERNET (POE) MARKET, BY REGION, 2018-2033, (USD THOUSAND)
8.3.1 ASIA-PACIFIC
8.3.2 NORTH AMERICA
8.3.3 EUROPE
8.3.4 SOUTH AMERICA
8.3.5 MIDDLE EAST AND AFRICA
8.4 MIDDLE EAST AND AFRICA POWER OVER ETHERNET (POE) MARKET, BY TYPE, 2018-2033 (USD THOUSAND)
8.4.1 POWERED DEVICES (PD)
8.4.2 POWER SOURCING EQUIPMENT (PSE)
8.4.3 NETWORK CABLE
8.5 POWERED DEVICES (PD) IN MIDDLE EAST AND AFRICA POWER OVER ETHERNET (POE) MARKET, BY VOLTAGE RANGE, 2018-2033 (USD THOUSAND)
8.5.1 40 V TO 50 V
8.5.2 ABOVE 50 V
8.5.3 UP TO 30 V
8.5.4 30 V TO 40 V
8.6 POWERED DEVICES (PD) IN MIDDLE EAST AND AFRICA POWER OVER ETHERNET (POE) MARKET, BY REGION, 2018-2033 (USD THOUSAND)
8.6.1 ASIA-PACIFIC
8.6.2 NORTH AMERICA
8.6.3 EUROPE
8.6.4 SOUTH AMERICA
8.6.5 MIDDLE EAST AND AFRICA
8.7 POWER SOURCING EQUIPMENT (PSE) IN MIDDLE EAST AND AFRICA POWER OVER ETHERNET (POE) MARKET, BY VOLTAGE RANGE, 2018-2033 (USD THOUSAND)
8.7.1 ABOVE 50 V
8.7.2 40 V TO 50 V
8.7.3 30 V TO 40 V
8.7.4 UP TO 30 V
8.8 POWER SOURCING EQUIPMENT (PSE) IN MIDDLE EAST AND AFRICA POWER OVER ETHERNET (POE) MARKET, BY REGION, 2018-2033 (USD THOUSAND)
8.8.1 ASIA-PACIFIC
8.8.2 NORTH AMERICA
8.8.3 EUROPE
8.8.4 SOUTH AMERICA
8.8.5 MIDDLE EAST AND AFRICA
8.9 NETWORK CABLE IN MIDDLE EAST AND AFRICA POWER OVER ETHERNET (POE) MARKET, BY VOLTAGE RANGE, 2018-2033 (USD THOUSAND)
8.9.1 40 V TO 50 V
8.9.2 ABOVE 50 V
8.9.3 UP TO 30 V
8.9.4 30 V TO 40 V
8.1 NETWORK CABLE IN MIDDLE EAST AND AFRICA POWER OVER ETHERNET (POE) MARKET, BY REGION, 2018-2033 (USD THOUSAND)
8.10.1 ASIA-PACIFIC
8.10.2 NORTH AMERICA
8.10.3 EUROPE
8.10.4 SOUTH AMERICA
8.10.5 MIDDLE EAST AND AFRICA
9 MIDDLE EAST AND AFRICA POWER OVER ETHERNET (POE) MARKET, BY CLASS TYPE
9.1 OVERVIEW
9.2 MIDDLE EAST AND AFRICA POWER OVER ETHERNET (POE) MARKET, BY CLASS TYPE, 2018-2033 (USD THOUSAND)
9.2.1 CLASS 4
9.2.2 CLASS 3
9.2.3 CLASS 0
9.2.4 CLASS 2
9.2.5 CLASS 1
9.2.6 OTHERS
9.3 CLASS 4 IN MIDDLE EAST AND AFRICA POWER OVER ETHERNET (POE) MARKET, BY REGION, 2018-2033 (USD THOUSAND)
9.3.1 ASIA-PACIFIC
9.3.2 NORTH AMERICA
9.3.3 EUROPE
9.3.4 SOUTH AMERICA
9.3.5 MIDDLE EAST AND AFRICA
9.4 CLASS 3 IN MIDDLE EAST AND AFRICA POWER OVER ETHERNET (POE) MARKET, BY REGION, 2018-2033 (USD THOUSAND)
9.4.1 ASIA-PACIFIC
9.4.2 NORTH AMERICA
9.4.3 EUROPE
9.4.4 SOUTH AMERICA
9.4.5 MIDDLE EAST AND AFRICA
9.5 CLASS 0 IN MIDDLE EAST AND AFRICA POWER OVER ETHERNET (POE) MARKET, BY REGION, 2018-2033 (USD THOUSAND)
9.5.1 ASIA-PACIFIC
9.5.2 NORTH AMERICA
9.5.3 EUROPE
9.5.4 SOUTH AMERICA
9.5.5 MIDDLE EAST AND AFRICA
9.6 CLASS 2 IN MIDDLE EAST AND AFRICA POWER OVER ETHERNET (POE) MARKET, BY REGION, 2018-2033 (USD THOUSAND)
9.6.1 ASIA-PACIFIC
9.6.2 NORTH AMERICA
9.6.3 EUROPE
9.6.4 SOUTH AMERICA
9.6.5 MIDDLE EAST AND AFRICA
9.7 CLASS 1 IN MIDDLE EAST AND AFRICA POWER OVER ETHERNET (POE) MARKET, BY REGION, 2018-2033 (USD THOUSAND)
9.7.1 ASIA-PACIFIC
9.7.2 NORTH AMERICA
9.7.3 EUROPE
9.7.4 SOUTH AMERICA
9.7.5 MIDDLE EAST AND AFRICA
9.8 OTHERS IN MIDDLE EAST AND AFRICA POWER OVER ETHERNET (POE) MARKET, BY REGION, 2018-2033 (USD THOUSAND)
9.8.1 ASIA-PACIFIC
9.8.2 NORTH AMERICA
9.8.3 EUROPE
9.8.4 SOUTH AMERICA
9.8.5 MIDDLE EAST AND AFRICA
10 MIDDLE EAST AND AFRICA POWER OVER ETHERNET (POE) MARKET, BY MODES
10.1 OVERVIEW
10.2 MIDDLE EAST AND AFRICA POWER OVER ETHERNET (POE) MARKET, BY MODES, 2018-2033 (USD THOUSAND)
10.2.1 MODE A
10.2.2 MODE B
10.3 MODE A IN MIDDLE EAST AND AFRICA POWER OVER ETHERNET (POE) MARKET, BY REGION, 2018-2033 (USD THOUSAND)
10.3.1 ASIA-PACIFIC
10.3.2 NORTH AMERICA
10.3.3 EUROPE
10.3.4 SOUTH AMERICA
10.3.5 MIDDLE EAST AND AFRICA
10.4 MODE B IN MIDDLE EAST AND AFRICA POWER OVER ETHERNET (POE) MARKET, BY REGION, 2018-2033 (USD THOUSAND)
10.4.1 ASIA-PACIFIC
10.4.2 NORTH AMERICA
10.4.3 EUROPE
10.4.4 SOUTH AMERICA
10.4.5 MIDDLE EAST AND AFRICA
11 MIDDLE EAST AND AFRICA POWER OVER ETHERNET (POE) MARKET, BY POWER RANGE
11.1 OVERVIEW
11.2 MIDDLE EAST AND AFRICA POWER OVER ETHERNET (POE) MARKET, BY POWER RANGE, 2018-2033 (USD THOUSAND)
11.2.1 15 W TO 30 W
11.2.2 UPTO 15 W
11.2.3 30 W TO 60 W
11.2.4 60 W TO 90 W
11.2.5 ABOVE 90 W
11.3 15 W TO 30 W IN MIDDLE EAST AND AFRICA POWER OVER ETHERNET (POE) MARKET, BY REGION, 2018-2033 (USD THOUSAND)
11.3.1 ASIA-PACIFIC
11.3.2 NORTH AMERICA
11.3.3 EUROPE
11.3.4 SOUTH AMERICA
11.3.5 MIDDLE EAST AND AFRICA
11.4 UPTO 15 W IN MIDDLE EAST AND AFRICA POWER OVER ETHERNET (POE) MARKET, BY REGION, 2018-2033 (USD THOUSAND)
11.4.1 ASIA-PACIFIC
11.4.2 NORTH AMERICA
11.4.3 EUROPE
11.4.4 SOUTH AMERICA
11.4.5 MIDDLE EAST AND AFRICA
11.5 30 W TO 60 W IN MIDDLE EAST AND AFRICA POWER OVER ETHERNET (POE) MARKET, BY REGION, 2018-2033 (USD THOUSAND)
11.5.1 ASIA-PACIFIC
11.5.2 NORTH AMERICA
11.5.3 EUROPE
11.5.4 SOUTH AMERICA
11.5.5 MIDDLE EAST AND AFRICA
11.6 60 W TO 90 W IN MIDDLE EAST AND AFRICA POWER OVER ETHERNET (POE) MARKET, BY REGION, 2018-2033 (USD THOUSAND)
11.6.1 ASIA-PACIFIC
11.6.2 NORTH AMERICA
11.6.3 EUROPE
11.6.4 SOUTH AMERICA
11.6.5 MIDDLE EAST AND AFRICA
11.7 ABOVE 90 W IN MIDDLE EAST AND AFRICA POWER OVER ETHERNET (POE) MARKET, BY REGION, 2018-2033 (USD THOUSAND)
11.7.1 ASIA-PACIFIC
11.7.2 NORTH AMERICA
11.7.3 EUROPE
11.7.4 SOUTH AMERICA
11.7.5 MIDDLE EAST AND AFRICA
12 MIDDLE EAST AND AFRICA POWER OVER ETHERNET (POE) MARKET, BY VOLTAGE RANGE
12.1 OVERVIEW
12.2 MIDDLE EAST AND AFRICA POWER OVER ETHERNET (POE) MARKET, BY VOLTAGE RANGE, 2018-2033 (USD THOUSAND)
12.2.1 40 V TO 50 V
12.2.2 ABOVE 50 V
12.2.3 UP TO 30 V
12.2.4 30 V TO 40 V
12.3 40 V TO 50 V IN MIDDLE EAST AND AFRICA POWER OVER ETHERNET (POE) MARKET, BY REGION, 2018-2033 (USD THOUSAND)
12.3.1 ASIA-PACIFIC
12.3.2 NORTH AMERICA
12.3.3 EUROPE
12.3.4 SOUTH AMERICA
12.3.5 MIDDLE EAST AND AFRICA
12.4 ABOVE 50 V IN MIDDLE EAST AND AFRICA POWER OVER ETHERNET (POE) MARKET, BY REGION, 2018-2033 (USD THOUSAND)
12.4.1 ASIA-PACIFIC
12.4.2 NORTH AMERICA
12.4.3 EUROPE
12.4.4 SOUTH AMERICA
12.4.5 MIDDLE EAST AND AFRICA
12.5 UP TO 30 V IN MIDDLE EAST AND AFRICA POWER OVER ETHERNET (POE) MARKET, BY REGION, 2018-2033 (USD THOUSAND)
12.5.1 ASIA-PACIFIC
12.5.2 NORTH AMERICA
12.5.3 EUROPE
12.5.4 SOUTH AMERICA
12.5.5 MIDDLE EAST AND AFRICA
12.6 30 V TO 40 V IN MIDDLE EAST AND AFRICA POWER OVER ETHERNET (POE) MARKET, BY REGION, 2018-2033 (USD THOUSAND)
12.6.1 ASIA-PACIFIC
12.6.2 NORTH AMERICA
12.6.3 EUROPE
12.6.4 SOUTH AMERICA
12.6.5 MIDDLE EAST AND AFRICA
13 MIDDLE EAST AND AFRICA POWER OVER ETHERNET (POE) MARKET, BY DEVICE TYPE
13.1 OVERVIEW
13.2 MIDDLE EAST AND AFRICA POWER OVER ETHERNET (POE) MARKET, BY DEVICE TYPE, 2018-2033 (USD THOUSAND)
13.2.1 POE SWITCH (ENDSPAN)
13.2.2 IP CAMERAS
13.2.3 WIRELESS ACCESS POINTS
13.2.4 VOICE OVER INTERNET PROTOCOL (VOIP) & INTERNET PROTOCOL (IP) PHONES
13.2.5 POE INJECTOR (MIDSPAN)
13.2.6 PTZ CAMERAS
13.2.7 POE LIGHTING
13.2.8 SECURITY CARD READERS
13.2.9 IP INTERCOMS
13.2.10 IP CLOCKS
13.2.11 ATMS
13.2.12 OTHERS
13.3 POE SWITCH (ENDSPAN) IN MIDDLE EAST AND AFRICA POWER OVER ETHERNET (POE) MARKET, BY REGION, 2018-2033 (USD THOUSAND)
13.3.1 ASIA-PACIFIC
13.3.2 NORTH AMERICA
13.3.3 EUROPE
13.3.4 SOUTH AMERICA
13.3.5 MIDDLE EAST AND AFRICA
13.4 IP CAMERAS IN MIDDLE EAST AND AFRICA POWER OVER ETHERNET (POE) MARKET, BY REGION, 2018-2033 (USD THOUSAND)
13.4.1 ASIA-PACIFIC
13.4.2 NORTH AMERICA
13.4.3 EUROPE
13.4.4 SOUTH AMERICA
13.4.5 MIDDLE EAST AND AFRICA
13.5 WIRELESS ACCESS POINTS IN MIDDLE EAST AND AFRICA POWER OVER ETHERNET (POE) MARKET, BY REGION, 2018-2033 (USD THOUSAND)
13.5.1 ASIA-PACIFIC
13.5.2 NORTH AMERICA
13.5.3 EUROPE
13.5.4 SOUTH AMERICA
13.5.5 MIDDLE EAST AND AFRICA
13.6 VOICE OVER INTERNET PROTOCOL (VOIP) & INTERNET PROTOCOL (IP) PHONES IN MIDDLE EAST AND AFRICA POWER OVER ETHERNET (POE) MARKET, BY REGION, 2018-2033 (USD THOUSAND)
13.6.1 ASIA-PACIFIC
13.6.2 NORTH AMERICA
13.6.3 EUROPE
13.6.4 SOUTH AMERICA
13.6.5 MIDDLE EAST AND AFRICA
13.7 POE INJECTOR (MIDSPAN) IN MIDDLE EAST AND AFRICA POWER OVER ETHERNET (POE) MARKET, BY REGION, 2018-2033 (USD THOUSAND)
13.7.1 ASIA-PACIFIC
13.7.2 NORTH AMERICA
13.7.3 EUROPE
13.7.4 SOUTH AMERICA
13.7.5 MIDDLE EAST AND AFRICA
13.8 PTZ CAMERAS IN MIDDLE EAST AND AFRICA POWER OVER ETHERNET (POE) MARKET, BY REGION, 2018-2033 (USD THOUSAND)
13.8.1 ASIA-PACIFIC
13.8.2 NORTH AMERICA
13.8.3 EUROPE
13.8.4 SOUTH AMERICA
13.8.5 MIDDLE EAST AND AFRICA
13.9 POE LIGHTING IN MIDDLE EAST AND AFRICA POWER OVER ETHERNET (POE) MARKET, BY REGION, 2018-2033 (USD THOUSAND)
13.9.1 ASIA-PACIFIC
13.9.2 NORTH AMERICA
13.9.3 EUROPE
13.9.4 SOUTH AMERICA
13.9.5 MIDDLE EAST AND AFRICA
13.1 SECURITY CARD READERS IN MIDDLE EAST AND AFRICA POWER OVER ETHERNET (POE) MARKET, BY REGION, 2018-2033 (USD THOUSAND)
13.10.1 ASIA-PACIFIC
13.10.2 NORTH AMERICA
13.10.3 EUROPE
13.10.4 SOUTH AMERICA
13.10.5 MIDDLE EAST AND AFRICA
13.11 IP INTERCOMS IN MIDDLE EAST AND AFRICA POWER OVER ETHERNET (POE) MARKET, BY REGION, 2018-2033 (USD THOUSAND)
13.11.1 ASIA-PACIFIC
13.11.2 NORTH AMERICA
13.11.3 EUROPE
13.11.4 SOUTH AMERICA
13.11.5 MIDDLE EAST AND AFRICA
13.12 IP CLOCKS IN MIDDLE EAST AND AFRICA POWER OVER ETHERNET (POE) MARKET, BY REGION, 2018-2033 (USD THOUSAND)
13.12.1 ASIA-PACIFIC
13.12.2 NORTH AMERICA
13.12.3 EUROPE
13.12.4 SOUTH AMERICA
13.12.5 MIDDLE EAST AND AFRICA
13.13 ATMS IN MIDDLE EAST AND AFRICA POWER OVER ETHERNET (POE) MARKET, BY REGION, 2018-2033 (USD THOUSAND)
13.13.1 ASIA-PACIFIC
13.13.2 NORTH AMERICA
13.13.3 EUROPE
13.13.4 SOUTH AMERICA
13.13.5 MIDDLE EAST AND AFRICA
13.14 OTHERS IN MIDDLE EAST AND AFRICA POWER OVER ETHERNET (POE) MARKET, BY REGION, 2018-2033 (USD THOUSAND)
13.14.1 ASIA-PACIFIC
13.14.2 NORTH AMERICA
13.14.3 EUROPE
13.14.4 SOUTH AMERICA
13.14.5 MIDDLE EAST AND AFRICA
14 MIDDLE EAST AND AFRICA POWER OVER ETHERNET (POE) MARKET, BY APPLICATION
14.1 OVERVIEW
14.2 MIDDLE EAST AND AFRICA POWER OVER ETHERNET (POE) MARKET, BY APPLICATION, 2018-2033 (USD THOUSAND)
14.2.1 ACCESS CONTROL & SECURITY
14.2.2 IOT CONNECTIVITY
14.2.3 LIGHTING CONTROL
14.2.4 INFOTAINMENT
14.2.5 OTHERS
14.3 ACCESS CONTROL & SECURITY IN MIDDLE EAST AND AFRICA POWER OVER ETHERNET (POE) MARKET, BY REGION, 2018-2033 (USD THOUSAND)
14.3.1 ASIA-PACIFIC
14.3.2 NORTH AMERICA
14.3.3 EUROPE
14.3.4 SOUTH AMERICA
14.3.5 MIDDLE EAST AND AFRICA
14.4 IOT CONNECTIVITY IN MIDDLE EAST AND AFRICA POWER OVER ETHERNET (POE) MARKET, BY REGION, 2018-2033 (USD THOUSAND)
14.4.1 ASIA-PACIFIC
14.4.2 NORTH AMERICA
14.4.3 EUROPE
14.4.4 SOUTH AMERICA
14.4.5 MIDDLE EAST AND AFRICA
14.5 LIGHTING CONTROL IN MIDDLE EAST AND AFRICA POWER OVER ETHERNET (POE) MARKET, BY REGION, 2018-2033 (USD THOUSAND)
14.5.1 ASIA-PACIFIC
14.5.2 NORTH AMERICA
14.5.3 EUROPE
14.5.4 SOUTH AMERICA
14.5.5 MIDDLE EAST AND AFRICA
14.6 INFOTAINMENT IN MIDDLE EAST AND AFRICA POWER OVER ETHERNET (POE) MARKET, BY REGION, 2018-2033 (USD THOUSAND)
14.6.1 ASIA-PACIFIC
14.6.2 NORTH AMERICA
14.6.3 EUROPE
14.6.4 SOUTH AMERICA
14.6.5 MIDDLE EAST AND AFRICA
14.7 OTHERS IN MIDDLE EAST AND AFRICA POWER OVER ETHERNET (POE) MARKET, BY REGION, 2018-2033 (USD THOUSAND)
14.7.1 ASIA-PACIFIC
14.7.2 NORTH AMERICA
14.7.3 EUROPE
14.7.4 SOUTH AMERICA
14.7.5 MIDDLE EAST AND AFRICA
15 MIDDLE EAST AND AFRICA POWER OVER ETHERNET (POE) MARKET, BY END USER
15.1 OVERVIEW
15.2 MIDDLE EAST AND AFRICA POWER OVER ETHERNET (POE) MARKET, BY END USER, 2018-2033 (USD THOUSAND)
15.2.1 COMMERCIAL
15.2.2 INDUSTRIAL
15.2.3 RESIDENTIAL
15.3 COMMERCIAL IN MIDDLE EAST AND AFRICA POWER OVER ETHERNET (POE) MARKET, BY INDUSTRY VERTICAL, 2018-2033 (USD THOUSAND)
15.3.1 OFFICES
15.3.2 DATA CENTERS
15.3.3 RETAIL
15.3.4 HEALTHCARE
15.3.5 CAMPUSES
15.3.6 HOSPITALITY
15.3.7 OTHERS
15.4 COMMERCIAL IN MIDDLE EAST AND AFRICA POWER OVER ETHERNET (POE) MARKET, BY TYPE, 2018-2033 (USD THOUSAND)
15.4.1 POWERED DEVICES (PD)
15.4.2 POWER SOURCING EQUIPMENT (PSE)
15.4.3 NETWORK CABLE
15.5 COMMERCIAL IN MIDDLE EAST AND AFRICA POWER OVER ETHERNET (POE) MARKET, BY REGION, 2018-2033 (USD THOUSAND)
15.5.1 ASIA-PACIFIC
15.5.2 NORTH AMERICA
15.5.3 EUROPE
15.5.4 SOUTH AMERICA
15.5.5 MIDDLE EAST AND AFRICA
15.6 INDUSTRIAL IN MIDDLE EAST AND AFRICA POWER OVER ETHERNET (POE) MARKET, BY INDUSTRY VERTICAL, 2018-2033 (USD THOUSAND)
15.6.1 TELECOMMUNICATION
15.6.2 TRANSPORTATION
15.6.3 OIL & GAS
15.6.4 AUTOMOTIVE
15.6.5 CHEMICALS
15.6.6 OTHERS
15.7 INDUSTRIAL IN MIDDLE EAST AND AFRICA POWER OVER ETHERNET (POE) MARKET, BY TYPE, 2018-2033 (USD THOUSAND)
15.7.1 POWERED DEVICES (PD)
15.7.2 POWER SOURCING EQUIPMENT (PSE)
15.7.3 NETWORK CABLE
15.8 INDUSTRIAL IN MIDDLE EAST AND AFRICA POWER OVER ETHERNET (POE) MARKET, BY REGION, 2018-2033 (USD THOUSAND)
15.8.1 ASIA-PACIFIC
15.8.2 NORTH AMERICA
15.8.3 EUROPE
15.8.4 SOUTH AMERICA
15.8.5 MIDDLE EAST AND AFRICA
15.9 RESIDENTIAL IN MIDDLE EAST AND AFRICA POWER OVER ETHERNET (POE) MARKET, BY HOUSING TYPE, 2018-2033 (USD THOUSAND)
15.9.1 SINGLE FAMILY HOME
15.9.2 APARTMENT
15.9.3 OTHERS
15.1 RESIDENTIAL IN MIDDLE EAST AND AFRICA POWER OVER ETHERNET (POE) MARKET, BY TYPE, 2018-2033 (USD THOUSAND)
15.10.1 POWERED DEVICES (PD)
15.10.2 POWER SOURCING EQUIPMENT (PSE)
15.10.3 NETWORK CABLE
15.11 RESIDENTIAL IN MIDDLE EAST AND AFRICA POWER OVER ETHERNET (POE) MARKET, BY REGION, 2018-2033 (USD THOUSAND)
15.11.1 ASIA-PACIFIC
15.11.2 NORTH AMERICA
15.11.3 EUROPE
15.11.4 SOUTH AMERICA
15.11.5 MIDDLE EAST AND AFRICA
16 MIDDLE EAST AND AFRICA POWER OVER ETHERNET (POE) MARKET, BY REGION
16.1 MIDDLE EAST AND AFRICA
16.1.1 SAUDI ARABIA
16.1.2 U.A.E
16.1.3 SOUTH AFRICA
16.1.4 ISRAEL
16.1.5 EGYPT
16.1.6 QATAR
16.1.7 KUWAIT
16.1.8 OMAN
16.1.9 BAHRAIN
16.1.10 REST OF MIDDLE EAST AND AFRICA
17 MIDDLE EAST AND AFRICA POWER OVER ETHERNET (POE) MARKET: COMPANY LANDSCAPE
17.1 COMPANY SHARE ANALYSIS: GLOBAL
18 SWOT ANALYSIS
19 COMPANY PROFILES
19.1 CISCO SYSTEMS, INC.
19.1.1 COMPANY SNAPSHOT
19.1.2 REVENUE ANALYSIS
19.1.3 COMPANY SHARE ANALYSIS
19.1.4 PRODUCT PORTFOLIO
19.1.5 RECENT DEVELOPMENT
19.2 BROADCOM.
19.2.1 COMPANY SNAPSHOT
19.2.2 REVENUE ANALYSIS
19.2.3 COMPANY SHARE ANALYSIS
19.2.4 PRODUCT PORTFOLIO
19.2.5 RECENT DEVELOPMENT
19.3 TEXAS INSTRUMENTS INCORPORATED
19.3.1 COMPANY SNAPSHOT
19.3.2 REVENUE ANALYSIS
19.3.3 COMPANY SHARE ANALYSIS
19.3.4 PRODUCT PORTFOLIO
19.3.5 RECENT DEVELOPMENT
19.4 ANALOG DEVICES, INC.
19.4.1 COMPANY SNAPSHOT
19.4.2 REVENUE ANALYSIS
19.4.3 COMPANY SHARE ANALYSIS
19.4.4 PRODUCT PORTFOLIO
19.4.5 RECENT DEVELOPMENT
19.5 MICROCHIP TECHNOLOGY INC.
19.5.1 COMPANY SNAPSHOT
19.5.2 REVENUE ANALYSIS
19.5.3 COMPANY SHARE ANALYSIS
19.5.4 PRODUCT PORTFOLIO
19.5.5 RECENT DEVELOPMENT
19.6 ADVANTECH CO., LTD.
19.6.1 COMPANY SNAPSHOT
19.6.2 REVENUE ANALYSIS
19.6.3 PRODUCT PORTFOLIO
19.6.4 RECENT DEVELOPMENT
19.7 ALLIED TELESIS, INC
19.7.1 COMPANY SNAPSHOT
19.7.2 REVENUE ANALYSIS
19.7.3 PRODUCT PORTFOLIO
19.7.4 RECENT DEVELOPMENT
19.8 BLACK BOX
19.8.1 COMPANY SNAPSHOT
19.8.2 PRODUCT PORTFOLIO
19.8.3 RECENT DEVELOPMENT/NEWS
19.9 COMMSCOPE TECHNOLOGIES LLC
19.9.1 COMPANY SNAPSHOT
19.9.2 REVENUE ANALYSIS
19.1 EATON
19.10.1 COMPANY SNAPSHOT
19.10.2 REVENUE ANALYSIS
19.10.3 PRODUCT PORTFOLIO
19.10.4 RECENT DEVELOPMENT
19.11 E.C.I. NETWORKS INC.
19.11.1 COMPANY SNAPSHOT
19.11.2 PRODUCT PORTFOLIO
19.11.3 RECENT DEVELOPMENT
19.12 EDIMAX TECHNOLOGY CO., LTD.
19.12.1 COMPANY SNAPSHOT
19.12.2 REVENUE ANALYSIS
19.12.3 PRODUCT PORTFOLIO
19.12.4 RECENT DEVELOPMENT
19.13 ETHERWAN SYSTEMS, INC.
19.13.1 COMPANY SNAPSHOT
19.13.2 PRODUCT PORTFOLIO
19.13.3 RECENT DEVELOPMENT
19.14 HEWLETT PACKARD ENTERPRISE DEVELOPMENT LP
19.14.1 COMPANY SNAPSHOT
19.14.2 REVENUE ANALYSIS
19.14.3 PRODUCT PORTFOLIO
19.14.4 RECENT DEVELOPMENT
19.15 INTELLINET NETWORK SOLUTIONS
19.15.1 COMPANY SNAPSHOT
19.15.2 PRODUCT PORTFOLIO
19.15.3 RECENT DEVELOPMENT
19.16 MOLEX, LLC
19.16.1 COMPANY SNAPSHOT
19.16.2 PRODUCT PORTFOLIO
19.16.3 RECENT DEVELOPMENT
19.17 MONOLITHIC POWER SYSTEMS, INC.
19.17.1 COMPANY SNAPSHOT
19.17.2 REVENUE ANALYSIS
19.17.3 PRODUCT PORTFOLIO
19.17.4 RECENT DEVELOPMENT
19.18 NETGEAR
19.18.1 COMPANY SNAPSHOT
19.18.2 REVENUE ANALYSIS
19.18.3 PRODUCT PORTFOLIO
19.18.4 RECENT DEVELOPMENT
19.19 R&M
19.19.1 COMPANY SNAPSHOT
19.19.2 PRODUCT PORTFOLIO
19.19.3 RECENT DEVELOPMENT
19.2 SEMICONDUCTOR COMPONENTS INDUSTRIES, LLC
19.20.1 COMPANY SNAPSHOT
19.20.2 REVENUE ANALYSIS
19.20.3 PRODUCT PORTFOLIO
19.20.4 RECENT DEVELOPMENT
19.21 SIEMENS
19.21.1 COMPANY SNAPSHOT
19.21.2 REVENUE ANALYSIS
19.21.3 PRODUCT PORTFOLIO
19.21.4 RECENT DEVELOPMENT
19.22 STMICROELECTRONICS
19.22.1 COMPANY SNAPSHOT
19.22.2 REVENUE ANALYSIS
19.22.3 PRODUCT PORTFOLIO
19.22.4 ECENT DEVELOPMENT
19.23 TP-LINK SYSTEMS INC.
19.23.1 COMPANY SNAPSHOT
19.23.2 PRODUCT PORTFOLIO
19.23.3 RECENT DEVELOPMENT
19.24 TRENDNET, INC.
19.24.1 COMPANY SNAPSHOT
19.24.2 PRODUCT PORTFOLIO
19.24.3 RECENT DEVELOPMENT
19.25 VERACITY UK LIMITED
19.25.1 COMPANY SNAPSHOT
19.25.2 PRODUCT PORTFOLIO
19.25.3 RECENT DEVELOPMENT
19.26 VERSA TECHNOLOGY, INC.
19.26.1 COMPANY SNAPSHOT
19.26.2 PRODUCT PORTFOLIO
19.26.3 RECENT DEVELOPMENT
20 QUESTIONNAIRE
21 RELATED REPORTS
List of Table
TABLE 1 MIDDLE EAST AND AFRICA POWER OVER ETHERNET (POE) MARKET, 2018-2033, (USD THOUSAND)
TABLE 2 MIDDLE EAST AND AFRICA POWER OVER ETHERNET (POE) MARKET, BY REGION, 2018-2033, (USD THOUSAND)
TABLE 3 MIDDLE EAST AND AFRICA POWER OVER ETHERNET (POE) MARKET, BY TYPE, 2018-2033 (USD THOUSAND)
TABLE 4 POWERED DEVICES (PD) IN MIDDLE EAST AND AFRICA POWER OVER ETHERNET (POE) MARKET, BY VOLTAGE RANGE, 2018-2033 (USD THOUSAND)
TABLE 5 POWERED DEVICES (PD) IN MIDDLE EAST AND AFRICA POWER OVER ETHERNET (POE) MARKET, BY REGION, 2018-2033 (USD THOUSAND)
TABLE 6 POWER SOURCING EQUIPMENT (PSE) IN MIDDLE EAST AND AFRICA POWER OVER ETHERNET (POE) MARKET, BY VOLTAGE RANGE, 2018-2033 (USD THOUSAND)
TABLE 7 POWER SOURCING EQUIPMENT (PSE) IN MIDDLE EAST AND AFRICA POWER OVER ETHERNET (POE) MARKET, BY REGION, 2018-2033 (USD THOUSAND)
TABLE 8 NETWORK CABLE IN MIDDLE EAST AND AFRICA POWER OVER ETHERNET (POE) MARKET, BY VOLTAGE RANGE, 2018-2033 (USD THOUSAND)
TABLE 9 NETWORK CABLE IN MIDDLE EAST AND AFRICA POWER OVER ETHERNET (POE) MARKET, BY REGION, 2018-2033 (USD THOUSAND)
TABLE 10 MIDDLE EAST AND AFRICA POWER OVER ETHERNET (POE) MARKET, BY CLASS TYPE, 2018-2033 (USD THOUSAND)
TABLE 11 CLASS 4 IN MIDDLE EAST AND AFRICA POWER OVER ETHERNET (POE) MARKET, BY REGION, 2018-2033 (USD THOUSAND)
TABLE 12 CLASS 3 IN MIDDLE EAST AND AFRICA POWER OVER ETHERNET (POE) MARKET, BY REGION, 2018-2033 (USD THOUSAND)
TABLE 13 CLASS 0 IN MIDDLE EAST AND AFRICA POWER OVER ETHERNET (POE) MARKET, BY REGION, 2018-2033 (USD THOUSAND)
TABLE 14 CLASS 2 IN MIDDLE EAST AND AFRICA POWER OVER ETHERNET (POE) MARKET, BY REGION, 2018-2033 (USD THOUSAND)
TABLE 15 CLASS 1 IN MIDDLE EAST AND AFRICA POWER OVER ETHERNET (POE) MARKET, BY REGION, 2018-2033 (USD THOUSAND)
TABLE 16 OTHERS IN MIDDLE EAST AND AFRICA POWER OVER ETHERNET (POE) MARKET, BY REGION, 2018-2033 (USD THOUSAND)
TABLE 17 MIDDLE EAST AND AFRICA POWER OVER ETHERNET (POE) MARKET, BY MODES, 2018-2033 (USD THOUSAND)
TABLE 18 MODE A IN MIDDLE EAST AND AFRICA POWER OVER ETHERNET (POE) MARKET, BY REGION, 2018-2033 (USD THOUSAND)
TABLE 19 MODE B IN MIDDLE EAST AND AFRICA POWER OVER ETHERNET (POE) MARKET, BY REGION, 2018-2033 (USD THOUSAND)
TABLE 20 MIDDLE EAST AND AFRICA POWER OVER ETHERNET (POE) MARKET, BY POWER RANGE, 2018-2033 (USD THOUSAND)
TABLE 21 15 W TO 30 W IN MIDDLE EAST AND AFRICA POWER OVER ETHERNET (POE) MARKET, BY REGION, 2018-2033 (USD THOUSAND)
TABLE 22 UPTO 15 W IN MIDDLE EAST AND AFRICA POWER OVER ETHERNET (POE) MARKET, BY REGION, 2018-2033 (USD THOUSAND)
TABLE 23 30 W TO 60 W IN MIDDLE EAST AND AFRICA POWER OVER ETHERNET (POE) MARKET, BY REGION, 2018-2033 (USD THOUSAND)
TABLE 24 60 W TO 90 W IN MIDDLE EAST AND AFRICA POWER OVER ETHERNET (POE) MARKET, BY REGION, 2018-2033 (USD THOUSAND)
TABLE 25 ABOVE 90 W IN MIDDLE EAST AND AFRICA POWER OVER ETHERNET (POE) MARKET, BY REGION, 2018-2033 (USD THOUSAND)
TABLE 26 MIDDLE EAST AND AFRICA POWER OVER ETHERNET (POE) MARKET, BY VOLTAGE RANGE, 2018-2033 (USD THOUSAND)
TABLE 27 40 V TO 50 V IN MIDDLE EAST AND AFRICA POWER OVER ETHERNET (POE) MARKET, BY REGION, 2018-2033 (USD THOUSAND)
TABLE 28 ABOVE 50 V IN MIDDLE EAST AND AFRICA POWER OVER ETHERNET (POE) MARKET, BY REGION, 2018-2033 (USD THOUSAND)
TABLE 29 UP TO 30 V IN MIDDLE EAST AND AFRICA POWER OVER ETHERNET (POE) MARKET, BY REGION, 2018-2033 (USD THOUSAND)
TABLE 30 30 V TO 40 V IN MIDDLE EAST AND AFRICA POWER OVER ETHERNET (POE) MARKET, BY REGION, 2018-2033 (USD THOUSAND)
TABLE 31 MIDDLE EAST AND AFRICA POWER OVER ETHERNET (POE) MARKET, BY DEVICE TYPE, 2018-2033 (USD THOUSAND)
TABLE 32 POE SWITCH (ENDSPAN) IN MIDDLE EAST AND AFRICA POWER OVER ETHERNET (POE) MARKET, BY REGION, 2018-2033 (USD THOUSAND)
TABLE 33 IP CAMERAS IN MIDDLE EAST AND AFRICA POWER OVER ETHERNET (POE) MARKET, BY REGION, 2018-2033 (USD THOUSAND)
TABLE 34 WIRELESS ACCESS POINTS IN MIDDLE EAST AND AFRICA POWER OVER ETHERNET (POE) MARKET, BY REGION, 2018-2033 (USD THOUSAND)
TABLE 35 VOICE OVER INTERNET PROTOCOL (VOIP) & INTERNET PROTOCOL (IP) PHONES IN MIDDLE EAST AND AFRICA POWER OVER ETHERNET (POE) MARKET, BY REGION, 2018-2033 (USD THOUSAND)
TABLE 36 POE INJECTOR (MIDSPAN) IN MIDDLE EAST AND AFRICA POWER OVER ETHERNET (POE) MARKET, BY REGION, 2018-2033 (USD THOUSAND)
TABLE 37 PTZ CAMERAS IN MIDDLE EAST AND AFRICA POWER OVER ETHERNET (POE) MARKET, BY REGION, 2018-2033 (USD THOUSAND)
TABLE 38 POE LIGHTING IN MIDDLE EAST AND AFRICA POWER OVER ETHERNET (POE) MARKET, BY REGION, 2018-2033 (USD THOUSAND)
TABLE 39 SECURITY CARD READERS IN MIDDLE EAST AND AFRICA POWER OVER ETHERNET (POE) MARKET, BY REGION, 2018-2033 (USD THOUSAND)
TABLE 40 IP INTERCOMS IN MIDDLE EAST AND AFRICA POWER OVER ETHERNET (POE) MARKET, BY REGION, 2018-2033 (USD THOUSAND)
TABLE 41 IP CLOCKS IN MIDDLE EAST AND AFRICA POWER OVER ETHERNET (POE) MARKET, BY REGION, 2018-2033 (USD THOUSAND)
TABLE 42 ATMS IN MIDDLE EAST AND AFRICA POWER OVER ETHERNET (POE) MARKET, BY REGION, 2018-2033 (USD THOUSAND)
TABLE 43 OTHERS IN MIDDLE EAST AND AFRICA POWER OVER ETHERNET (POE) MARKET, BY REGION, 2018-2033 (USD THOUSAND)
TABLE 44 MIDDLE EAST AND AFRICA POWER OVER ETHERNET (POE) MARKET, BY APPLICATION, 2018-2033 (USD THOUSAND)
TABLE 45 ACCESS CONTROL & SECURITY IN MIDDLE EAST AND AFRICA POWER OVER ETHERNET (POE) MARKET, BY REGION, 2018-2033 (USD THOUSAND)
TABLE 46 IOT CONNECTIVITY IN MIDDLE EAST AND AFRICA POWER OVER ETHERNET (POE) MARKET, BY REGION, 2018-2033 (USD THOUSAND)
TABLE 47 LIGHTING CONTROL IN MIDDLE EAST AND AFRICA POWER OVER ETHERNET (POE) MARKET, BY REGION, 2018-2033 (USD THOUSAND)
TABLE 48 INFOTAINMENT IN MIDDLE EAST AND AFRICA POWER OVER ETHERNET (POE) MARKET, BY REGION, 2018-2033 (USD THOUSAND)
TABLE 49 OTHERS IN MIDDLE EAST AND AFRICA POWER OVER ETHERNET (POE) MARKET, BY REGION, 2018-2033 (USD THOUSAND)
TABLE 50 MIDDLE EAST AND AFRICA POWER OVER ETHERNET (POE) MARKET, BY END USER, 2018-2033 (USD THOUSAND)
TABLE 51 COMMERCIAL IN MIDDLE EAST AND AFRICA POWER OVER ETHERNET (POE) MARKET, BY INDUSTRY VERTICAL, 2018-2033 (USD THOUSAND)
TABLE 52 COMMERCIAL IN MIDDLE EAST AND AFRICA POWER OVER ETHERNET (POE) MARKET, BY TYPE, 2018-2033 (USD THOUSAND)
TABLE 53 COMMERCIAL IN MIDDLE EAST AND AFRICA POWER OVER ETHERNET (POE) MARKET, BY REGION, 2018-2033 (USD THOUSAND)
TABLE 54 INDUSTRIAL IN MIDDLE EAST AND AFRICA POWER OVER ETHERNET (POE) MARKET, BY INDUSTRY VERTICAL, 2018-2033 (USD THOUSAND)
TABLE 55 INDUSTRIAL IN MIDDLE EAST AND AFRICA POWER OVER ETHERNET (POE) MARKET, BY TYPE, 2018-2033 (USD THOUSAND)
TABLE 56 INDUSTRIAL IN MIDDLE EAST AND AFRICA POWER OVER ETHERNET (POE) MARKET, BY REGION, 2018-2033 (USD THOUSAND)
TABLE 57 RESIDENTIAL IN MIDDLE EAST AND AFRICA POWER OVER ETHERNET (POE) MARKET, BY HOUSING TYPE, 2018-2033 (USD THOUSAND)
TABLE 58 RESIDENTIAL IN MIDDLE EAST AND AFRICA POWER OVER ETHERNET (POE) MARKET, BY TYPE, 2018-2033 (USD THOUSAND)
TABLE 59 RESIDENTIAL IN MIDDLE EAST AND AFRICA POWER OVER ETHERNET (POE) MARKET, BY REGION, 2018-2033 (USD THOUSAND)
TABLE 60 MIDDLE EAST AND AFRICA POWER OVER ETHERNET (POE) MARKET, 2018-2033 (USD THOUSAND)
TABLE 61 MIDDLE EAST AND AFRICA POWER OVER ETHERNET (POE) MARKET, BY COUNTRY, 2018-2033 (USD THOUSAND)
TABLE 62 USD THOUSAND
TABLE 63 MIDDLE EAST AND AFRICA POWER OVER ETHERNET (POE) MARKET, BY TYPE, 2018-2033 (USD THOUSAND)
TABLE 64 POWERED DEVICES (PD) IN MIDDLE EAST AND AFRICA POWER OVER ETHERNET (POE) MARKET, BY VOLTAGE RANGE, 2018-2033 (USD THOUSAND)
TABLE 65 POWER SOURCING EQUIPMENT (PSE) IN MIDDLE EAST AND AFRICA POWER OVER ETHERNET (POE) MARKET, BY VOLTAGE RANGE, 2018-2033 (USD THOUSAND)
TABLE 66 NETWORK CABLE IN MIDDLE EAST AND AFRICA POWER OVER ETHERNET (POE) MARKET, BY VOLTAGE RANGE, 2018-2033 (USD THOUSAND)
TABLE 67 MIDDLE EAST AND AFRICA POWER OVER ETHERNET (POE) MARKET, BY CLASS TYPE, 2018-2033 (USD THOUSAND)
TABLE 68 MIDDLE EAST AND AFRICA POWER OVER ETHERNET (POE) MARKET, BY MODES, 2018-2033 (USD THOUSAND)
TABLE 69 MIDDLE EAST AND AFRICA POWER OVER ETHERNET (POE) MARKET, BY POWER RANGE, 2018-2033 (USD THOUSAND)
TABLE 70 MIDDLE EAST AND AFRICA POWER OVER ETHERNET (POE) MARKET, BY VOLTAGE RANGE, 2018-2033 (USD THOUSAND)
TABLE 71 MIDDLE EAST AND AFRICA POWER OVER ETHERNET (POE) MARKET, BY DEVICE TYPE, 2018-2033 (USD THOUSAND)
TABLE 72 MIDDLE EAST AND AFRICA POWER OVER ETHERNET (POE) MARKET, BY APPLICATION, 2018-2033 (USD THOUSAND)
TABLE 73 MIDDLE EAST AND AFRICA POWER OVER ETHERNET (POE) MARKET, BY END USER, 2018-2033 (USD THOUSAND)
TABLE 74 COMMERCIAL IN MIDDLE EAST AND AFRICA POWER OVER ETHERNET (POE) MARKET, BY INDUSTRY VERTICAL, 2018-2033 (USD THOUSAND)
TABLE 75 COMMERCIAL IN MIDDLE EAST AND AFRICA POWER OVER ETHERNET (POE) MARKET, BY TYPE, 2018-2033 (USD THOUSAND)
TABLE 76 INDUSTRIAL IN MIDDLE EAST AND AFRICA POWER OVER ETHERNET (POE) MARKET, BY INDUSTRY VERTICAL, 2018-2033 (USD THOUSAND)
TABLE 77 INDUSTRIAL IN MIDDLE EAST AND AFRICA POWER OVER ETHERNET (POE) MARKET, BY TYPE, 2018-2033 (USD THOUSAND)
TABLE 78 RESIDENTIAL IN MIDDLE EAST AND AFRICA POWER OVER ETHERNET (POE) MARKET, BY HOUSING TYPE, 2018-2033 (USD THOUSAND)
TABLE 79 RESIDENTIAL IN MIDDLE EAST AND AFRICA POWER OVER ETHERNET (POE) MARKET, BY TYPE, 2018-2033 (USD THOUSAND)
TABLE 80 USD THOUSAND
TABLE 81 SAUDI ARABIA POWER OVER ETHERNET (POE) MARKET, BY TYPE, 2018-2033 (USD THOUSAND)
TABLE 82 POWERED DEVICES (PD) IN SAUDI ARABIA POWER OVER ETHERNET (POE) MARKET, BY VOLTAGE RANGE, 2018-2033 (USD THOUSAND)
TABLE 83 POWER SOURCING EQUIPMENT (PSE) IN SAUDI ARABIA POWER OVER ETHERNET (POE) MARKET, BY VOLTAGE RANGE, 2018-2033 (USD THOUSAND)
TABLE 84 NETWORK CABLE IN SAUDI ARABIA POWER OVER ETHERNET (POE) MARKET, BY VOLTAGE RANGE, 2018-2033 (USD THOUSAND)
TABLE 85 SAUDI ARABIA POWER OVER ETHERNET (POE) MARKET, BY CLASS TYPE, 2018-2033 (USD THOUSAND)
TABLE 86 SAUDI ARABIA POWER OVER ETHERNET (POE) MARKET, BY MODES, 2018-2033 (USD THOUSAND)
TABLE 87 SAUDI ARABIA POWER OVER ETHERNET (POE) MARKET, BY POWER RANGE, 2018-2033 (USD THOUSAND)
TABLE 88 SAUDI ARABIA POWER OVER ETHERNET (POE) MARKET, BY VOLTAGE RANGE, 2018-2033 (USD THOUSAND)
TABLE 89 SAUDI ARABIA POWER OVER ETHERNET (POE) MARKET, BY DEVICE TYPE, 2018-2033 (USD THOUSAND)
TABLE 90 SAUDI ARABIA POWER OVER ETHERNET (POE) MARKET, BY APPLICATION, 2018-2033 (USD THOUSAND)
TABLE 91 SAUDI ARABIA POWER OVER ETHERNET (POE) MARKET, BY END USER, 2018-2033 (USD THOUSAND)
TABLE 92 COMMERCIAL IN SAUDI ARABIA POWER OVER ETHERNET (POE) MARKET, BY INDUSTRY VERTICAL, 2018-2033 (USD THOUSAND)
TABLE 93 COMMERCIAL IN SAUDI ARABIA POWER OVER ETHERNET (POE) MARKET, BY TYPE, 2018-2033 (USD THOUSAND)
TABLE 94 INDUSTRIAL IN SAUDI ARABIA POWER OVER ETHERNET (POE) MARKET, BY INDUSTRY VERTICAL, 2018-2033 (USD THOUSAND)
TABLE 95 INDUSTRIAL IN SAUDI ARABIA POWER OVER ETHERNET (POE) MARKET, BY TYPE, 2018-2033 (USD THOUSAND)
TABLE 96 RESIDENTIAL IN SAUDI ARABIA POWER OVER ETHERNET (POE) MARKET, BY HOUSING TYPE, 2018-2033 (USD THOUSAND)
TABLE 97 RESIDENTIAL IN SAUDI ARABIA POWER OVER ETHERNET (POE) MARKET, BY TYPE, 2018-2033 (USD THOUSAND)
TABLE 98 USD THOUSAND
TABLE 99 U.A.E POWER OVER ETHERNET (POE) MARKET, BY TYPE, 2018-2033 (USD THOUSAND)
TABLE 100 POWERED DEVICES (PD) IN U.A.E POWER OVER ETHERNET (POE) MARKET, BY VOLTAGE RANGE, 2018-2033 (USD THOUSAND)
TABLE 101 POWER SOURCING EQUIPMENT (PSE) IN U.A.E POWER OVER ETHERNET (POE) MARKET, BY VOLTAGE RANGE, 2018-2033 (USD THOUSAND)
TABLE 102 NETWORK CABLE IN U.A.E POWER OVER ETHERNET (POE) MARKET, BY VOLTAGE RANGE, 2018-2033 (USD THOUSAND)
TABLE 103 U.A.E POWER OVER ETHERNET (POE) MARKET, BY CLASS TYPE, 2018-2033 (USD THOUSAND)
TABLE 104 U.A.E POWER OVER ETHERNET (POE) MARKET, BY MODES, 2018-2033 (USD THOUSAND)
TABLE 105 U.A.E POWER OVER ETHERNET (POE) MARKET, BY POWER RANGE, 2018-2033 (USD THOUSAND)
TABLE 106 U.A.E POWER OVER ETHERNET (POE) MARKET, BY VOLTAGE RANGE, 2018-2033 (USD THOUSAND)
TABLE 107 U.A.E POWER OVER ETHERNET (POE) MARKET, BY DEVICE TYPE, 2018-2033 (USD THOUSAND)
TABLE 108 U.A.E POWER OVER ETHERNET (POE) MARKET, BY APPLICATION, 2018-2033 (USD THOUSAND)
TABLE 109 U.A.E POWER OVER ETHERNET (POE) MARKET, BY END USER, 2018-2033 (USD THOUSAND)
TABLE 110 COMMERCIAL IN U.A.E POWER OVER ETHERNET (POE) MARKET, BY INDUSTRY VERTICAL, 2018-2033 (USD THOUSAND)
TABLE 111 COMMERCIAL IN U.A.E POWER OVER ETHERNET (POE) MARKET, BY TYPE, 2018-2033 (USD THOUSAND)
TABLE 112 INDUSTRIAL IN U.A.E POWER OVER ETHERNET (POE) MARKET, BY INDUSTRY VERTICAL, 2018-2033 (USD THOUSAND)
TABLE 113 INDUSTRIAL IN U.A.E POWER OVER ETHERNET (POE) MARKET, BY TYPE, 2018-2033 (USD THOUSAND)
TABLE 114 RESIDENTIAL IN U.A.E POWER OVER ETHERNET (POE) MARKET, BY HOUSING TYPE, 2018-2033 (USD THOUSAND)
TABLE 115 RESIDENTIAL IN U.A.E POWER OVER ETHERNET (POE) MARKET, BY TYPE, 2018-2033 (USD THOUSAND)
TABLE 116 USD THOUSAND
TABLE 117 SOUTH AFRICA POWER OVER ETHERNET (POE) MARKET, BY TYPE, 2018-2033 (USD THOUSAND)
TABLE 118 POWERED DEVICES (PD) IN SOUTH AFRICA POWER OVER ETHERNET (POE) MARKET, BY VOLTAGE RANGE, 2018-2033 (USD THOUSAND)
TABLE 119 POWER SOURCING EQUIPMENT (PSE) IN SOUTH AFRICA POWER OVER ETHERNET (POE) MARKET, BY VOLTAGE RANGE, 2018-2033 (USD THOUSAND)
TABLE 120 NETWORK CABLE IN SOUTH AFRICA POWER OVER ETHERNET (POE) MARKET, BY VOLTAGE RANGE, 2018-2033 (USD THOUSAND)
TABLE 121 SOUTH AFRICA POWER OVER ETHERNET (POE) MARKET, BY CLASS TYPE, 2018-2033 (USD THOUSAND)
TABLE 122 SOUTH AFRICA POWER OVER ETHERNET (POE) MARKET, BY MODES, 2018-2033 (USD THOUSAND)
TABLE 123 SOUTH AFRICA POWER OVER ETHERNET (POE) MARKET, BY POWER RANGE, 2018-2033 (USD THOUSAND)
TABLE 124 SOUTH AFRICA POWER OVER ETHERNET (POE) MARKET, BY VOLTAGE RANGE, 2018-2033 (USD THOUSAND)
TABLE 125 SOUTH AFRICA POWER OVER ETHERNET (POE) MARKET, BY DEVICE TYPE, 2018-2033 (USD THOUSAND)
TABLE 126 SOUTH AFRICA POWER OVER ETHERNET (POE) MARKET, BY APPLICATION, 2018-2033 (USD THOUSAND)
TABLE 127 SOUTH AFRICA POWER OVER ETHERNET (POE) MARKET, BY END USER, 2018-2033 (USD THOUSAND)
TABLE 128 COMMERCIAL IN SOUTH AFRICA POWER OVER ETHERNET (POE) MARKET, BY INDUSTRY VERTICAL, 2018-2033 (USD THOUSAND)
TABLE 129 COMMERCIAL IN SOUTH AFRICA POWER OVER ETHERNET (POE) MARKET, BY TYPE, 2018-2033 (USD THOUSAND)
TABLE 130 INDUSTRIAL IN SOUTH AFRICA POWER OVER ETHERNET (POE) MARKET, BY INDUSTRY VERTICAL, 2018-2033 (USD THOUSAND)
TABLE 131 INDUSTRIAL IN SOUTH AFRICA POWER OVER ETHERNET (POE) MARKET, BY TYPE, 2018-2033 (USD THOUSAND)
TABLE 132 RESIDENTIAL IN SOUTH AFRICA POWER OVER ETHERNET (POE) MARKET, BY HOUSING TYPE, 2018-2033 (USD THOUSAND)
TABLE 133 RESIDENTIAL IN SOUTH AFRICA POWER OVER ETHERNET (POE) MARKET, BY TYPE, 2018-2033 (USD THOUSAND)
TABLE 134 USD THOUSAND
TABLE 135 ISRAEL POWER OVER ETHERNET (POE) MARKET, BY TYPE, 2018-2033 (USD THOUSAND)
TABLE 136 POWERED DEVICES (PD) IN ISRAEL POWER OVER ETHERNET (POE) MARKET, BY VOLTAGE RANGE, 2018-2033 (USD THOUSAND)
TABLE 137 POWER SOURCING EQUIPMENT (PSE) IN ISRAEL POWER OVER ETHERNET (POE) MARKET, BY VOLTAGE RANGE, 2018-2033 (USD THOUSAND)
TABLE 138 NETWORK CABLE IN ISRAEL POWER OVER ETHERNET (POE) MARKET, BY VOLTAGE RANGE, 2018-2033 (USD THOUSAND)
TABLE 139 ISRAEL POWER OVER ETHERNET (POE) MARKET, BY CLASS TYPE, 2018-2033 (USD THOUSAND)
TABLE 140 ISRAEL POWER OVER ETHERNET (POE) MARKET, BY MODES, 2018-2033 (USD THOUSAND)
TABLE 141 ISRAEL POWER OVER ETHERNET (POE) MARKET, BY POWER RANGE, 2018-2033 (USD THOUSAND)
TABLE 142 ISRAEL POWER OVER ETHERNET (POE) MARKET, BY VOLTAGE RANGE, 2018-2033 (USD THOUSAND)
TABLE 143 ISRAEL POWER OVER ETHERNET (POE) MARKET, BY DEVICE TYPE, 2018-2033 (USD THOUSAND)
TABLE 144 ISRAEL POWER OVER ETHERNET (POE) MARKET, BY APPLICATION, 2018-2033 (USD THOUSAND)
TABLE 145 ISRAEL POWER OVER ETHERNET (POE) MARKET, BY END USER, 2018-2033 (USD THOUSAND)
TABLE 146 COMMERCIAL IN ISRAEL POWER OVER ETHERNET (POE) MARKET, BY INDUSTRY VERTICAL, 2018-2033 (USD THOUSAND)
TABLE 147 COMMERCIAL IN ISRAEL POWER OVER ETHERNET (POE) MARKET, BY TYPE, 2018-2033 (USD THOUSAND)
TABLE 148 INDUSTRIAL IN ISRAEL POWER OVER ETHERNET (POE) MARKET, BY INDUSTRY VERTICAL, 2018-2033 (USD THOUSAND)
TABLE 149 INDUSTRIAL IN ISRAEL POWER OVER ETHERNET (POE) MARKET, BY TYPE, 2018-2033 (USD THOUSAND)
TABLE 150 RESIDENTIAL IN ISRAEL POWER OVER ETHERNET (POE) MARKET, BY HOUSING TYPE, 2018-2033 (USD THOUSAND)
TABLE 151 RESIDENTIAL IN ISRAEL POWER OVER ETHERNET (POE) MARKET, BY TYPE, 2018-2033 (USD THOUSAND)
TABLE 152 USD THOUSAND
TABLE 153 EGYPT POWER OVER ETHERNET (POE) MARKET, BY TYPE, 2018-2033 (USD THOUSAND)
TABLE 154 POWERED DEVICES (PD) IN EGYPT POWER OVER ETHERNET (POE) MARKET, BY VOLTAGE RANGE, 2018-2033 (USD THOUSAND)
TABLE 155 POWER SOURCING EQUIPMENT (PSE) IN EGYPT POWER OVER ETHERNET (POE) MARKET, BY VOLTAGE RANGE, 2018-2033 (USD THOUSAND)
TABLE 156 NETWORK CABLE IN EGYPT POWER OVER ETHERNET (POE) MARKET, BY VOLTAGE RANGE, 2018-2033 (USD THOUSAND)
TABLE 157 EGYPT POWER OVER ETHERNET (POE) MARKET, BY CLASS TYPE, 2018-2033 (USD THOUSAND)
TABLE 158 EGYPT POWER OVER ETHERNET (POE) MARKET, BY MODES, 2018-2033 (USD THOUSAND)
TABLE 159 EGYPT POWER OVER ETHERNET (POE) MARKET, BY POWER RANGE, 2018-2033 (USD THOUSAND)
TABLE 160 EGYPT POWER OVER ETHERNET (POE) MARKET, BY VOLTAGE RANGE, 2018-2033 (USD THOUSAND)
TABLE 161 EGYPT POWER OVER ETHERNET (POE) MARKET, BY DEVICE TYPE, 2018-2033 (USD THOUSAND)
TABLE 162 EGYPT POWER OVER ETHERNET (POE) MARKET, BY APPLICATION, 2018-2033 (USD THOUSAND)
TABLE 163 EGYPT POWER OVER ETHERNET (POE) MARKET, BY END USER, 2018-2033 (USD THOUSAND)
TABLE 164 COMMERCIAL IN EGYPT POWER OVER ETHERNET (POE) MARKET, BY INDUSTRY VERTICAL, 2018-2033 (USD THOUSAND)
TABLE 165 COMMERCIAL IN EGYPT POWER OVER ETHERNET (POE) MARKET, BY TYPE, 2018-2033 (USD THOUSAND)
TABLE 166 INDUSTRIAL IN EGYPT POWER OVER ETHERNET (POE) MARKET, BY INDUSTRY VERTICAL, 2018-2033 (USD THOUSAND)
TABLE 167 INDUSTRIAL IN EGYPT POWER OVER ETHERNET (POE) MARKET, BY TYPE, 2018-2033 (USD THOUSAND)
TABLE 168 RESIDENTIAL IN EGYPT POWER OVER ETHERNET (POE) MARKET, BY HOUSING TYPE, 2018-2033 (USD THOUSAND)
TABLE 169 RESIDENTIAL IN EGYPT POWER OVER ETHERNET (POE) MARKET, BY TYPE, 2018-2033 (USD THOUSAND)
TABLE 170 USD THOUSAND
TABLE 171 QATAR POWER OVER ETHERNET (POE) MARKET, BY TYPE, 2018-2033 (USD THOUSAND)
TABLE 172 POWERED DEVICES (PD) IN QATAR POWER OVER ETHERNET (POE) MARKET, BY VOLTAGE RANGE, 2018-2033 (USD THOUSAND)
TABLE 173 POWER SOURCING EQUIPMENT (PSE) IN QATAR POWER OVER ETHERNET (POE) MARKET, BY VOLTAGE RANGE, 2018-2033 (USD THOUSAND)
TABLE 174 NETWORK CABLE IN QATAR POWER OVER ETHERNET (POE) MARKET, BY VOLTAGE RANGE, 2018-2033 (USD THOUSAND)
TABLE 175 QATAR POWER OVER ETHERNET (POE) MARKET, BY CLASS TYPE, 2018-2033 (USD THOUSAND)
TABLE 176 QATAR POWER OVER ETHERNET (POE) MARKET, BY MODES, 2018-2033 (USD THOUSAND)
TABLE 177 QATAR POWER OVER ETHERNET (POE) MARKET, BY POWER RANGE, 2018-2033 (USD THOUSAND)
TABLE 178 QATAR POWER OVER ETHERNET (POE) MARKET, BY VOLTAGE RANGE, 2018-2033 (USD THOUSAND)
TABLE 179 QATAR POWER OVER ETHERNET (POE) MARKET, BY DEVICE TYPE, 2018-2033 (USD THOUSAND)
TABLE 180 QATAR POWER OVER ETHERNET (POE) MARKET, BY APPLICATION, 2018-2033 (USD THOUSAND)
TABLE 181 QATAR POWER OVER ETHERNET (POE) MARKET, BY END USER, 2018-2033 (USD THOUSAND)
TABLE 182 COMMERCIAL IN QATAR POWER OVER ETHERNET (POE) MARKET, BY INDUSTRY VERTICAL, 2018-2033 (USD THOUSAND)
TABLE 183 COMMERCIAL IN QATAR POWER OVER ETHERNET (POE) MARKET, BY TYPE, 2018-2033 (USD THOUSAND)
TABLE 184 INDUSTRIAL IN QATAR POWER OVER ETHERNET (POE) MARKET, BY INDUSTRY VERTICAL, 2018-2033 (USD THOUSAND)
TABLE 185 INDUSTRIAL IN QATAR POWER OVER ETHERNET (POE) MARKET, BY TYPE, 2018-2033 (USD THOUSAND)
TABLE 186 RESIDENTIAL IN QATAR POWER OVER ETHERNET (POE) MARKET, BY HOUSING TYPE, 2018-2033 (USD THOUSAND)
TABLE 187 RESIDENTIAL IN QATAR POWER OVER ETHERNET (POE) MARKET, BY TYPE, 2018-2033 (USD THOUSAND)
TABLE 188 USD THOUSAND
TABLE 189 KUWAIT POWER OVER ETHERNET (POE) MARKET, BY TYPE, 2018-2033 (USD THOUSAND)
TABLE 190 POWERED DEVICES (PD) IN KUWAIT POWER OVER ETHERNET (POE) MARKET, BY VOLTAGE RANGE, 2018-2033 (USD THOUSAND)
TABLE 191 POWER SOURCING EQUIPMENT (PSE) IN KUWAIT POWER OVER ETHERNET (POE) MARKET, BY VOLTAGE RANGE, 2018-2033 (USD THOUSAND)
TABLE 192 NETWORK CABLE IN KUWAIT POWER OVER ETHERNET (POE) MARKET, BY VOLTAGE RANGE, 2018-2033 (USD THOUSAND)
TABLE 193 KUWAIT POWER OVER ETHERNET (POE) MARKET, BY CLASS TYPE, 2018-2033 (USD THOUSAND)
TABLE 194 KUWAIT POWER OVER ETHERNET (POE) MARKET, BY MODES, 2018-2033 (USD THOUSAND)
TABLE 195 KUWAIT POWER OVER ETHERNET (POE) MARKET, BY POWER RANGE, 2018-2033 (USD THOUSAND)
TABLE 196 KUWAIT POWER OVER ETHERNET (POE) MARKET, BY VOLTAGE RANGE, 2018-2033 (USD THOUSAND)
TABLE 197 KUWAIT POWER OVER ETHERNET (POE) MARKET, BY DEVICE TYPE, 2018-2033 (USD THOUSAND)
TABLE 198 KUWAIT POWER OVER ETHERNET (POE) MARKET, BY APPLICATION, 2018-2033 (USD THOUSAND)
TABLE 199 KUWAIT POWER OVER ETHERNET (POE) MARKET, BY END USER, 2018-2033 (USD THOUSAND)
TABLE 200 COMMERCIAL IN KUWAIT POWER OVER ETHERNET (POE) MARKET, BY INDUSTRY VERTICAL, 2018-2033 (USD THOUSAND)
TABLE 201 COMMERCIAL IN KUWAIT POWER OVER ETHERNET (POE) MARKET, BY TYPE, 2018-2033 (USD THOUSAND)
TABLE 202 INDUSTRIAL IN KUWAIT POWER OVER ETHERNET (POE) MARKET, BY INDUSTRY VERTICAL, 2018-2033 (USD THOUSAND)
TABLE 203 INDUSTRIAL IN KUWAIT POWER OVER ETHERNET (POE) MARKET, BY TYPE, 2018-2033 (USD THOUSAND)
TABLE 204 RESIDENTIAL IN KUWAIT POWER OVER ETHERNET (POE) MARKET, BY HOUSING TYPE, 2018-2033 (USD THOUSAND)
TABLE 205 RESIDENTIAL IN KUWAIT POWER OVER ETHERNET (POE) MARKET, BY TYPE, 2018-2033 (USD THOUSAND)
TABLE 206 USD THOUSAND
TABLE 207 OMAN POWER OVER ETHERNET (POE) MARKET, BY TYPE, 2018-2033 (USD THOUSAND)
TABLE 208 POWERED DEVICES (PD) IN OMAN POWER OVER ETHERNET (POE) MARKET, BY VOLTAGE RANGE, 2018-2033 (USD THOUSAND)
TABLE 209 POWER SOURCING EQUIPMENT (PSE) IN OMAN POWER OVER ETHERNET (POE) MARKET, BY VOLTAGE RANGE, 2018-2033 (USD THOUSAND)
TABLE 210 NETWORK CABLE IN OMAN POWER OVER ETHERNET (POE) MARKET, BY VOLTAGE RANGE, 2018-2033 (USD THOUSAND)
TABLE 211 OMAN POWER OVER ETHERNET (POE) MARKET, BY CLASS TYPE, 2018-2033 (USD THOUSAND)
TABLE 212 OMAN POWER OVER ETHERNET (POE) MARKET, BY MODES, 2018-2033 (USD THOUSAND)
TABLE 213 OMAN POWER OVER ETHERNET (POE) MARKET, BY POWER RANGE, 2018-2033 (USD THOUSAND)
TABLE 214 OMAN POWER OVER ETHERNET (POE) MARKET, BY VOLTAGE RANGE, 2018-2033 (USD THOUSAND)
TABLE 215 OMAN POWER OVER ETHERNET (POE) MARKET, BY DEVICE TYPE, 2018-2033 (USD THOUSAND)
TABLE 216 OMAN POWER OVER ETHERNET (POE) MARKET, BY APPLICATION, 2018-2033 (USD THOUSAND)
TABLE 217 OMAN POWER OVER ETHERNET (POE) MARKET, BY END USER, 2018-2033 (USD THOUSAND)
TABLE 218 COMMERCIAL IN OMAN POWER OVER ETHERNET (POE) MARKET, BY INDUSTRY VERTICAL, 2018-2033 (USD THOUSAND)
TABLE 219 COMMERCIAL IN OMAN POWER OVER ETHERNET (POE) MARKET, BY TYPE, 2018-2033 (USD THOUSAND)
TABLE 220 INDUSTRIAL IN OMAN POWER OVER ETHERNET (POE) MARKET, BY INDUSTRY VERTICAL, 2018-2033 (USD THOUSAND)
TABLE 221 INDUSTRIAL IN OMAN POWER OVER ETHERNET (POE) MARKET, BY TYPE, 2018-2033 (USD THOUSAND)
TABLE 222 RESIDENTIAL IN OMAN POWER OVER ETHERNET (POE) MARKET, BY HOUSING TYPE, 2018-2033 (USD THOUSAND)
TABLE 223 RESIDENTIAL IN OMAN POWER OVER ETHERNET (POE) MARKET, BY TYPE, 2018-2033 (USD THOUSAND)
TABLE 224 USD THOUSAND
TABLE 225 BAHRAIN POWER OVER ETHERNET (POE) MARKET, BY TYPE, 2018-2033 (USD THOUSAND)
TABLE 226 POWERED DEVICES (PD) IN BAHRAIN POWER OVER ETHERNET (POE) MARKET, BY VOLTAGE RANGE, 2018-2033 (USD THOUSAND)
TABLE 227 POWER SOURCING EQUIPMENT (PSE) IN BAHRAIN POWER OVER ETHERNET (POE) MARKET, BY VOLTAGE RANGE, 2018-2033 (USD THOUSAND)
TABLE 228 NETWORK CABLE IN BAHRAIN POWER OVER ETHERNET (POE) MARKET, BY VOLTAGE RANGE, 2018-2033 (USD THOUSAND)
TABLE 229 BAHRAIN POWER OVER ETHERNET (POE) MARKET, BY CLASS TYPE, 2018-2033 (USD THOUSAND)
TABLE 230 BAHRAIN POWER OVER ETHERNET (POE) MARKET, BY MODES, 2018-2033 (USD THOUSAND)
TABLE 231 BAHRAIN POWER OVER ETHERNET (POE) MARKET, BY POWER RANGE, 2018-2033 (USD THOUSAND)
TABLE 232 BAHRAIN POWER OVER ETHERNET (POE) MARKET, BY VOLTAGE RANGE, 2018-2033 (USD THOUSAND)
TABLE 233 BAHRAIN POWER OVER ETHERNET (POE) MARKET, BY DEVICE TYPE, 2018-2033 (USD THOUSAND)
TABLE 234 BAHRAIN POWER OVER ETHERNET (POE) MARKET, BY APPLICATION, 2018-2033 (USD THOUSAND)
TABLE 235 BAHRAIN POWER OVER ETHERNET (POE) MARKET, BY END USER, 2018-2033 (USD THOUSAND)
TABLE 236 COMMERCIAL IN BAHRAIN POWER OVER ETHERNET (POE) MARKET, BY INDUSTRY VERTICAL, 2018-2033 (USD THOUSAND)
TABLE 237 COMMERCIAL IN BAHRAIN POWER OVER ETHERNET (POE) MARKET, BY TYPE, 2018-2033 (USD THOUSAND)
TABLE 238 INDUSTRIAL IN BAHRAIN POWER OVER ETHERNET (POE) MARKET, BY INDUSTRY VERTICAL, 2018-2033 (USD THOUSAND)
TABLE 239 INDUSTRIAL IN BAHRAIN POWER OVER ETHERNET (POE) MARKET, BY TYPE, 2018-2033 (USD THOUSAND)
TABLE 240 RESIDENTIAL IN BAHRAIN POWER OVER ETHERNET (POE) MARKET, BY HOUSING TYPE, 2018-2033 (USD THOUSAND)
TABLE 241 RESIDENTIAL IN BAHRAIN POWER OVER ETHERNET (POE) MARKET, BY TYPE, 2018-2033 (USD THOUSAND)
TABLE 242 USD THOUSAND
TABLE 243 REST OF MIDDLE EAST AND AFRICA POWER OVER ETHERNET (POE) MARKET, BY TYPE, 2018-2033 (USD THOUSAND)
TABLE 244 POWERED DEVICES (PD) IN REST OF MIDDLE EAST AND AFRICA POWER OVER ETHERNET (POE) MARKET, BY VOLTAGE RANGE, 2018-2033 (USD THOUSAND)
TABLE 245 POWER SOURCING EQUIPMENT (PSE) IN REST OF MIDDLE EAST AND AFRICA POWER OVER ETHERNET (POE) MARKET, BY VOLTAGE RANGE, 2018-2033 (USD THOUSAND)
TABLE 246 NETWORK CABLE IN REST OF MIDDLE EAST AND AFRICA POWER OVER ETHERNET (POE) MARKET, BY VOLTAGE RANGE, 2018-2033 (USD THOUSAND)
TABLE 247 REST OF MIDDLE EAST AND AFRICA POWER OVER ETHERNET (POE) MARKET, BY CLASS TYPE, 2018-2033 (USD THOUSAND)
TABLE 248 REST OF MIDDLE EAST AND AFRICA POWER OVER ETHERNET (POE) MARKET, BY MODES, 2018-2033 (USD THOUSAND)
TABLE 249 REST OF MIDDLE EAST AND AFRICA POWER OVER ETHERNET (POE) MARKET, BY POWER RANGE, 2018-2033 (USD THOUSAND)
TABLE 250 REST OF MIDDLE EAST AND AFRICA POWER OVER ETHERNET (POE) MARKET, BY VOLTAGE RANGE, 2018-2033 (USD THOUSAND)
TABLE 251 REST OF MIDDLE EAST AND AFRICA POWER OVER ETHERNET (POE) MARKET, BY DEVICE TYPE, 2018-2033 (USD THOUSAND)
TABLE 252 REST OF MIDDLE EAST AND AFRICA POWER OVER ETHERNET (POE) MARKET, BY APPLICATION, 2018-2033 (USD THOUSAND)
TABLE 253 REST OF MIDDLE EAST AND AFRICA POWER OVER ETHERNET (POE) MARKET, BY END USER, 2018-2033 (USD THOUSAND)
TABLE 254 COMMERCIAL IN REST OF MIDDLE EAST AND AFRICA POWER OVER ETHERNET (POE) MARKET, BY INDUSTRY VERTICAL, 2018-2033 (USD THOUSAND)
TABLE 255 COMMERCIAL IN REST OF MIDDLE EAST AND AFRICA POWER OVER ETHERNET (POE) MARKET, BY TYPE, 2018-2033 (USD THOUSAND)
TABLE 256 INDUSTRIAL IN REST OF MIDDLE EAST AND AFRICA POWER OVER ETHERNET (POE) MARKET, BY INDUSTRY VERTICAL, 2018-2033 (USD THOUSAND)
TABLE 257 INDUSTRIAL IN REST OF MIDDLE EAST AND AFRICA POWER OVER ETHERNET (POE) MARKET, BY TYPE, 2018-2033 (USD THOUSAND)
TABLE 258 RESIDENTIAL IN REST OF MIDDLE EAST AND AFRICA POWER OVER ETHERNET (POE) MARKET, BY HOUSING TYPE, 2018-2033 (USD THOUSAND)
TABLE 259 RESIDENTIAL IN REST OF MIDDLE EAST AND AFRICA POWER OVER ETHERNET (POE) MARKET, BY TYPE, 2018-2033 (USD THOUSAND)
List of Figure
FIGURE 1 MIDDLE EAST AND AFRICA POWER OVER ETHERNET (POE) MARKET: SEGMENTATION
FIGURE 2 MIDDLE EAST AND AFRICA POWER OVER ETHERNET (POE) MARKET: DATA TRIANGULATION
FIGURE 3 MIDDLE EAST AND AFRICA POWER OVER ETHERNET (POE) MARKET: DROC ANALYSIS
FIGURE 4 MIDDLE EAST AND AFRICA POWER OVER ETHERNET (POE) MARKET: MIDDLE EAST AND AFRICA VS REGIONAL MARKET ANALYSIS
FIGURE 5 MIDDLE EAST AND AFRICA POWER OVER ETHERNET (POE) MARKET: COMPANY RESEARCH ANALYSIS
FIGURE 6 MIDDLE EAST AND AFRICA POWER OVER ETHERNET (POE) MARKET: INTERVIEW DEMOGRAPHICS
FIGURE 7 MIDDLE EAST AND AFRICA POWER OVER ETHERNET (POE) MARKET: DBMR MARKET POSITION GRID
FIGURE 8 MIDDLE EAST AND AFRICA POWER OVER ETHERNET (POE) MARKET: VENDOR SHARE ANALYSIS
FIGURE 9 MIDDLE EAST AND AFRICA POWER OVER ETHERNET (POE) MARKET: MULTIVARIVATE MODELING
FIGURE 10 MIDDLE EAST AND AFRICA POWER OVER ETHERNET (POE) MARKET: TYPE TIMELINE CURVE
FIGURE 11 MIDDLE EAST AND AFRICA POWER OVER ETHERNET (POE) MARKET: END-USER COVERAGE GRID
FIGURE 12 MIDDLE EAST AND AFRICA POWER OVER ETHERNET (POE) MARKET: SEGMENTATION
FIGURE 13 THREE SEGMENTS COMPRISE THE MIDDLE EAST AND AFRICA POWER OVER ETHERNET (POE) MARKET, BY TYPE (2025)
FIGURE 14 MIDDLE EAST AND AFRICA POWER OVER ETHERNET (POE) MARKET: EXECUTIVE SUMMARY
FIGURE 15 STRATEGIC DECISIONS
FIGURE 16 ACCELERATING DEPLOYMENT OF IP CAMERAS, WIRELESS ACCESS POINTS, VOIP PHONES, ACCESS CONTROL, AND IOT DEVICES IS EXPECTED TO DRIVE THE MIDDLE EAST AND AFRICA POWER OVER ETHERNET (POE) MARKET DURING THE FORECAST PERIOD OF 2026 TO 2033
FIGURE 17 TYPE SEGMENT IS EXPECTED TO ACCOUNT FOR THE LARGEST SHARE OF THE MIDDLE EAST AND AFRICA POWER OVER ETHERNET (POE) MARKET IN 2025 & 2033
FIGURE 18 DROC ANALYSIS
FIGURE 19 MIDDLE EAST AND AFRICA POWER OVER ETHERNET (POE) MARKET, BY TYPE, 2025
FIGURE 20 MIDDLE EAST AND AFRICA POWER OVER ETHERNET (POE) MARKET, BY CLASS TYPE, 2025
FIGURE 21 MIDDLE EAST AND AFRICA POWER OVER ETHERNET (POE) MARKET, BY MODES, 2025
FIGURE 22 MIDDLE EAST AND AFRICA POWER OVER ETHERNET (POE) MARKET, BY POWER RANGE, 2025
FIGURE 23 MIDDLE EAST AND AFRICA POWER OVER ETHERNET (POE) MARKET, BY VOLTAGE RANGE, 2025
FIGURE 24 MIDDLE EAST AND AFRICA POWER OVER ETHERNET (POE) MARKET, BY DEVICE TYPE, 2025
FIGURE 25 MIDDLE EAST AND AFRICA POWER OVER ETHERNET (POE) MARKET, BY APPLICATION, 2025
FIGURE 26 MIDDLE EAST AND AFRICA POWER OVER ETHERNET (POE) MARKET, BY END USER, 2025
FIGURE 27 MIDDLE EAST AND AFRICA POWER OVER ETHERNET (POE) MARKET: SNAPSHOT
FIGURE 28 MIDDLE EAST AND AFRICA POWER OVER ETHERNET (POE) MARKET: COMPANY SHARE 2025 (%)
Middle East And Africa Power Over Ethernet Poe Market, Supply Chain Analysis and Ecosystem Framework
To support market growth and help clients navigate the impact of geopolitical shifts, DBMR has integrated in-depth supply chain analysis into its Middle East And Africa Power Over Ethernet Poe Market research reports. This addition empowers clients to respond effectively to global changes affecting their industries. The supply chain analysis section includes detailed insights such as Middle East And Africa Power Over Ethernet Poe Market consumption and production by country, price trend analysis, the impact of tariffs and geopolitical developments, and import and export trends by country and HSN code. It also highlights major suppliers with data on production capacity and company profiles, as well as key importers and exporters. In addition to research, DBMR offers specialized supply chain consulting services backed by over a decade of experience, providing solutions like supplier discovery, supplier risk assessment, price trend analysis, impact evaluation of inflation and trade route changes, and comprehensive market trend analysis.
Data collection and base year analysis are done using data collection modules with large sample sizes. The stage includes obtaining market information or related data through various sources and strategies. It includes examining and planning all the data acquired from the past in advance. It likewise envelops the examination of information inconsistencies seen across different information sources. The market data is analysed and estimated using market statistical and coherent models. Also, market share analysis and key trend analysis are the major success factors in the market report. To know more, please request an analyst call or drop down your inquiry.
The key research methodology used by DBMR research team is data triangulation which involves data mining, analysis of the impact of data variables on the market and primary (industry expert) validation. Data models include Vendor Positioning Grid, Market Time Line Analysis, Market Overview and Guide, Company Positioning Grid, Patent Analysis, Pricing Analysis, Company Market Share Analysis, Standards of Measurement, Global versus Regional and Vendor Share Analysis. To know more about the research methodology, drop in an inquiry to speak to our industry experts.
Data Bridge Market Research is a leader in advanced formative research. We take pride in servicing our existing and new customers with data and analysis that match and suits their goal. The report can be customized to include price trend analysis of target brands understanding the market for additional countries (ask for the list of countries), clinical trial results data, literature review, refurbished market and product base analysis. Market analysis of target competitors can be analyzed from technology-based analysis to market portfolio strategies. We can add as many competitors that you require data about in the format and data style you are looking for. Our team of analysts can also provide you data in crude raw excel files pivot tables (Fact book) or can assist you in creating presentations from the data sets available in the report.


