
Middle East And Africa Prebiotics For Infant Formula Market
Market Size in USD Million
CAGR :
% 
 USD
28.33 Million
USD
42.82 Million
2024
2032
USD
28.33 Million
USD
42.82 Million
2024
2032
| 2025 –2032 | |
| USD 28.33 Million | |
| USD 42.82 Million | |
| % | |
|
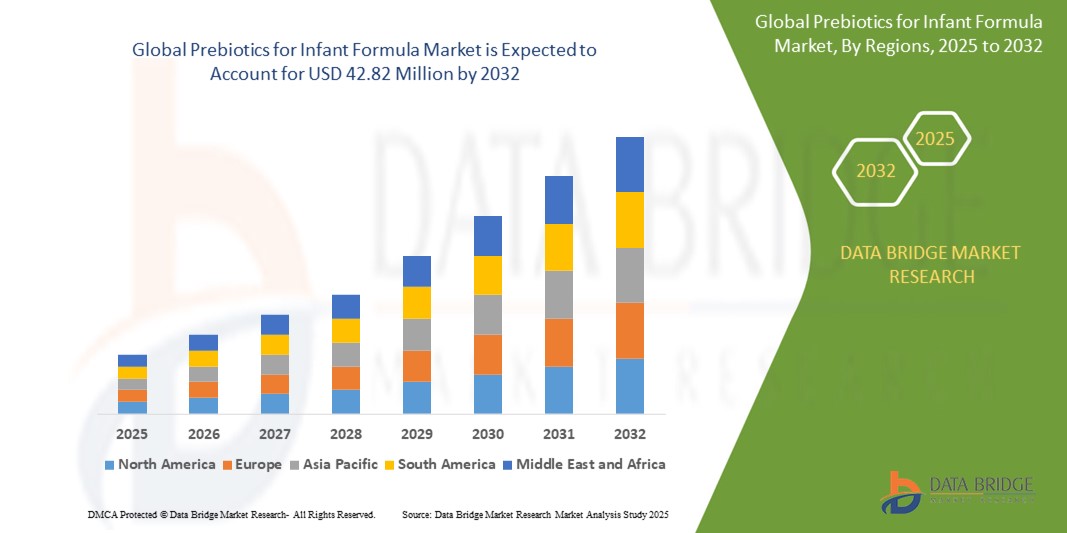
Prebiotics for Infant Formula Market Size
- The Middle East and Africa prebiotics for infant formula market size was valued at USD 28.33 million in 2024 and is expected to reach USD 42.82 million by 2032, at a CAGR of 5.30% during the forecast period
- The market growth is primarily driven by increasing awareness of infant nutrition, rising demand for functional foods, and advancements in prebiotic ingredients that mimic the benefits of human milk
- Growing parental focus on gut health and immunity for infants, coupled with rising disposable incomes and urbanization, is positioning prebiotics as a critical component in infant formula across the region
Prebiotics for Infant Formula Market Analysis
- Prebiotics in infant formula are non-digestible food ingredients that promote the growth of beneficial gut bacteria, supporting infant health by improving digestion and immunity
- The market is fueled by increasing demand for premium infant nutrition products, growing awareness of the role of prebiotics in gut health, and rising prevalence of lactose intolerance and allergies necessitating specialized formulas
- Saudi Arabia dominated the market with the largest revenue share of 38.5% in 2024, driven by government initiatives promoting infant health, high birth rates, and increasing investments in the food and beverage sector
- The U.A.E. is expected to be the fastest-growing country in the prebiotics for infant formula market during the forecast period, attributed to rapid urbanization, growing demand for organic and premium infant products, and supportive government policies for food safety
- The human milk oligosaccharides (HMOS) segment held the largest market revenue share of 35% in 2024, driven by its composition closely resembling human milk and its benefits for infants’ immature digestive and immune systems
Report Scope and Prebiotics for Infant Formula Market Segmentation
|
Attributes |
Prebiotics for Infant Formula Key Market Insights |
|
Segments Covered |
|
|
Countries Covered |
Middle East and Africa
|
|
Key Market Players |
|
|
Market Opportunities |
|
|
Value Added Data Infosets |
In addition to the insights on market scenarios such as market value, growth rate, segmentation, geographical coverage, and major players, the market reports curated by the Data Bridge Market Research also include in-depth expert analysis, pricing analysis, brand share analysis, consumer survey, demography analysis, supply chain analysis, value chain analysis, raw material/consumables overview, vendor selection criteria, PESTLE Analysis, Porter Analysis, and regulatory framework. |
Prebiotics for Infant Formula Market Trends
“Increasing Demand for Human Milk Oligosaccharides (HMOs) and Organic Products”
- The Middle East and Africa prebiotics for infant formula market is experiencing a notable trend toward the integration of Human Milk Oligosaccharides (HMOs) and organic prebiotic ingredients
- HMOs, which mimic the nutritional profile of breast milk, are gaining traction due to their ability to promote healthy gut microbiota, enhance immune function, and support cognitive development in infants
- Organic prebiotics, such as those derived from plant-based sources such as chicory root (inulin) and barley (GOS), are increasingly sought after by health-conscious parents seeking natural and sustainable options
- For instance, companies such as BASF SE have introduced HMO-based ingredients such as 2’-fucosyllactose (2’-FL) to cater to the growing demand for premium infant formulas in the region.
- This trend enhances the appeal of prebiotic-enriched formulas, particularly for premium and specialized products, driving market growth among both individual consumers and healthcare providers
- Advanced production techniques, such as fermentation-based processes, are enabling manufacturers to scale up HMO production, making these products more accessible in the Middle East and Africa
Prebiotics for Infant Formula Market Dynamics
Driver
“Rising Demand for Premium Infant Nutrition and Growing Health Awareness”
- Increasing consumer awareness of the importance of early-life nutrition, particularly in supporting gut health and immunity, is a key driver for the Middle East and Africa prebiotics for infant formula market
- Prebiotics such as HMOs, Galactooligosaccharides (GOS), and Fructooligosaccharides (FOS) are increasingly incorporated into infant formulas to replicate the benefits of breast milk, addressing the needs of working mothers and infants who cannot be breastfed
- Government initiatives and healthcare campaigns in countries such as Saudi Arabia and the UAE are promoting the use of nutritionally enriched infant formulas, boosting market adoption
- The proliferation of organized retail and e-commerce platforms in the region, particularly in the UAE, is enhancing accessibility to prebiotic-enriched products, further fueling market growth.
- Manufacturers are increasingly offering prebiotic formulas tailored to specific infant age groups to meet diverse nutritional needs and parental preferences
Restraint/Challenge
“High Production Costs and Regulatory Complexities”
- The high cost of producing advanced prebiotics, particularly HMOs, due to complex manufacturing processes such as microbial fermentation, poses a significant barrier to market growth, especially in cost-sensitive African markets
- Incorporating prebiotics into infant formulas requires substantial investment in research, development, and quality assurance, which can increase product prices and limit affordability for many consumers
- Regulatory challenges, including varying standards for prebiotic ingredients and infant formula across Middle Eastern and African countries, create complexities for manufacturers operating in multiple markets
- Concerns about product safety and compliance with stringent health regulations, particularly for organic and HMO-based products, can deter smaller manufacturers and limit market expansion
- Limited awareness of prebiotic benefits in rural and less-developed areas of Africa further restricts market penetration, particularly for premium and specialized formulas
Prebiotics for Infant Formula market Scope
The market is segmented on the basis of type, source, grade, form, product type, and infant age.
- By Type
On the basis of type, the Middle East and Africa prebiotics for infant formula market is segmented into human milk oligosaccharides (HMOS), galactooligosaccharides (GOS), fructooligosaccharides (FOS), mannan-oligosaccharides (MOS), polydextrose (PDX), lactulose (LOS), and inulin. The human milk oligosaccharides (HMOS) segment held the largest market revenue share of 35% in 2024, driven by its composition closely resembling human milk and its benefits for infants’ immature digestive and immune systems.
The fructooligosaccharides (FOS) segment is expected to witness the fastest growth rate from 2025 to 2032, driven by its high availability from plant sources such as chicory and onions, and its ability to promote beneficial gut bacteria, enhancing infant digestive health and immunity.
- By Source
On the basis of source, the Middle East and Africa prebiotics for infant formula market is segmented into bacteria, algae, fungi, and plants & vegetables. The plants & vegetables segment dominated with a market revenue share of 40% in 2024, attributed to the high yield of FOS and GOS from sources such as barley, wheat, and chicory roots, which are cost-effective and widely available.
The bacteria segment is anticipated to experience the fastest growth from 2025 to 2032, fueled by advancements in fermentation processes that produce oligosaccharides mimicking human milk’s prebiotic effects, increasing their adoption in premium infant formulas.
- By Grade
On the basis of grade, the Middle East and Africa prebiotics for infant formula market is segmented into inorganic and organic. The inorganic segment held the largest market revenue share of 55% in 2024, due to its cost-effectiveness and widespread use in standard infant formula products.
The organic segment is expected to witness the fastest growth rate from 2025 to 2032, driven by rising consumer preference for natural and sustainable ingredients, particularly in premium and specialized formulas, as parents prioritize health-conscious choices for infants.
- By Form
On the basis of form, the Middle East and Africa prebiotics for infant formula market is segmented into powder and liquid. The powder segment dominated with a market revenue share of 60% in 2024, owing to its longer shelf life, ease of storage, and widespread use in infant formula manufacturing.
The liquid segment is anticipated to grow at the fastest rate from 2025 to 2032, driven by increasing demand for ready-to-feed formulas that offer convenience for busy parents, particularly in urban areas of Saudi Arabia and the U.A.E.
- By Product Type
On the basis of product type, the Middle East and Africa prebiotics for infant formula market is segmented into standard formula, toddler formula, follow up formula, and special formula. The standard formula segment held the largest market revenue share of 38% in 2024, driven by its widespread use for infants aged 0-6 months and its affordability compared to specialized formulas.
The special formula segment is expected to witness the fastest growth from 2025 to 2032, fueled by the rising prevalence of preterm births and infants with specific nutritional needs, increasing demand for formulas with tailored prebiotic compositions.
- By Infant Age
On the basis of infant age, the Middle East and Africa prebiotics for infant formula market is segmented into 0-6 months, 6-12 months, and 1-3 years. The 6-12 months segment dominated with a market revenue share of 40% in 2024, as this age group requires enhanced nutritional support for rapid growth and development, driving prebiotic formula consumption.
The 0-6 months segment is anticipated to experience the fastest growth from 2025 to 2032, propelled by increasing awareness of the importance of early nutrition and the rising number of working mothers relying on infant formulas in the U.A.E. and other regions
Prebiotics for Infant Formula Market Regional Analysis
- Saudi Arabia dominated the market with the largest revenue share of 38.5% in 2024, driven by government initiatives promoting infant health, high birth rates, and increasing investments in the food and beverage sector
- Consumers prioritize prebiotics for their ability to promote healthy gut microbiota, enhance digestion, and strengthen immune systems in infants. Demand is particularly strong for products that support the nutritional needs of preterm babies and address the increasing prevalence of formula feeding due to insufficient breastfeeding
Saudi Arabia Prebiotics for Infant Formula Market Insight
Saudi Arabia dominates the Middle East and Africa prebiotics for infant formula market with the largest revenue share of 66.6% in 2024, driven by a rapidly developing retail sector and strong initiatives by companies to market infant formulas. The country’s high birth rates and increasing consumer awareness of prebiotics’ role in supporting infant digestion and immunity fuel demand. Both OEM and aftermarket segments benefit from the adoption of advanced prebiotics such as HMOs, supported by companies such as BASF SE entering the market with innovative ingredients such as 2’-fucosyllactose (2’-FL).
U.A.E. Prebiotics for Infant Formula Market Insight
The U.A.E. is the fastest-growing market in the region, propelled by rising disposable incomes, urbanization, and growing awareness of prebiotic benefits for infant health. Demand for high-quality, prebiotic-enriched formulas is increasing, particularly for products that enhance gut health and mimic breast milk. The country’s focus on premium and organic products, alongside a growing migrant population, supports market expansion in both new and aftermarket formula sales.
South Africa Prebiotics for Infant Formula Market Insight
South Africa holds a significant share of the Middle East and Africa prebiotics for infant formula market, driven by its position as a major baby food market in the region. The market is supported by increasing consumer demand for nutritional products that promote infant health and development. Growth is further fueled by rising disposable incomes and the availability of prebiotic-enriched formulas through drugstores, pharmacies, and supermarkets, which are key distribution channels.
Prebiotics for Infant Formula Market Share
The prebiotics for infant formula industry is primarily led by well-established companies, including:
- Nestlé S.A. (U.A.E.)
- Danone S.A. (U.A.E.)
- Abbott Laboratories (South Africa)
- FrieslandCampina (South Africa)
- Jennewein Biotechnologie GmbH (U.A.E.)
- BASF SE (South Africa)
- DuPont Nutrition & Biosciences (U.A.E.)
- Glycosyn LLC (South Africa)
- Ingredion Incorporated (South Africa)
- Royal DSM (South Africa)
- Yakult Honsha Co., Ltd. (U.A.E.)
- Beneo GmbH (South Africa)
- Chr. Hansen Holding A/S (South Africa)
- Kerry Group plc (U.A.E.)
- Tate & Lyle PLC (South Africa)
What are the Recent Developments in Middle East and Africa Prebiotics for Infant Formula Market?
- In October 2024, BASF SE, a global leader in chemical solutions, introduced an enhanced version of Prebilac 2’-FL (2’-fucosyllactose), a prebiotic ingredient for infant formula in the Middle East and Africa. Developed in collaboration with Glycosyn, this innovation supports gastrointestinal health and immunity in infants, addressing the rising demand for human milk oligosaccharides (HMOs) in the region. The launch reinforces BASF’s commitment to advanced nutritional solutions, strengthening its position in the prebiotics market
- In September 2024, Royal FrieslandCampina N.V. announced a strategic partnership with a leading South African dairy company to expand its production capacity for prebiotic-enriched infant formulas. This collaboration focuses on incorporating galactooligosaccharides (GOS) into locally produced formulas, enhancing nutritional offerings for infants in Sub-Saharan Africa. The partnership aims to meet rising consumer demand for functional infant nutrition while leveraging local distribution networks
- In August 2024, Nestlé S.A. introduced a new prebiotic infant formula containing a blend of fructooligosaccharides (FOS) and inulin in the United Arab Emirates and Saudi Arabia. This product launch targets the growing health-conscious parent demographic, emphasizing digestive health benefits for infants aged 0-12 months. The initiative reflects Nestlé’s commitment to innovation in the Middle East and Africa baby food market, aligning with regional trends toward premium nutrition
- In July 2024, Cargill Incorporated entered into a merger agreement with a regional Middle Eastern food ingredient supplier to bolster its prebiotic ingredient portfolio, specifically inulin derived from chicory roots. This merger aims to enhance Cargill’s supply chain capabilities in the Middle East and Africa, ensuring a steady supply of high-quality prebiotics for infant formula manufacturers. The move supports market growth by addressing sourcing challenges in the region
- In June 2024, Danone S.A. collaborated with a Kenyan infant nutrition startup to develop and distribute organic prebiotic infant formulas enriched with mannan-oligosaccharides (MOS). This partnership focuses on addressing the nutritional needs of preterm infants in East Africa, where preterm birth rates are high. The collaboration underscores Danone’s commitment to supporting local innovation and improving infant health outcomes in the region
SKU-
Get online access to the report on the World's First Market Intelligence Cloud

- Interactive Data Analysis Dashboard
- Company Analysis Dashboard for high growth potential opportunities
- Research Analyst Access for customization & queries
- Competitor Analysis with Interactive dashboard
- Latest News, Updates & Trend analysis
- Harness the Power of Benchmark Analysis for Comprehensive Competitor Tracking
Middle East And Africa Prebiotics For Infant Formula Market, Supply Chain Analysis and Ecosystem Framework
To support market growth and help clients navigate the impact of geopolitical shifts, DBMR has integrated in-depth supply chain analysis into its Middle East And Africa Prebiotics For Infant Formula Market research reports. This addition empowers clients to respond effectively to global changes affecting their industries. The supply chain analysis section includes detailed insights such as Middle East And Africa Prebiotics For Infant Formula Market consumption and production by country, price trend analysis, the impact of tariffs and geopolitical developments, and import and export trends by country and HSN code. It also highlights major suppliers with data on production capacity and company profiles, as well as key importers and exporters. In addition to research, DBMR offers specialized supply chain consulting services backed by over a decade of experience, providing solutions like supplier discovery, supplier risk assessment, price trend analysis, impact evaluation of inflation and trade route changes, and comprehensive market trend analysis.
Research Methodology
Data collection and base year analysis are done using data collection modules with large sample sizes. The stage includes obtaining market information or related data through various sources and strategies. It includes examining and planning all the data acquired from the past in advance. It likewise envelops the examination of information inconsistencies seen across different information sources. The market data is analysed and estimated using market statistical and coherent models. Also, market share analysis and key trend analysis are the major success factors in the market report. To know more, please request an analyst call or drop down your inquiry.
The key research methodology used by DBMR research team is data triangulation which involves data mining, analysis of the impact of data variables on the market and primary (industry expert) validation. Data models include Vendor Positioning Grid, Market Time Line Analysis, Market Overview and Guide, Company Positioning Grid, Patent Analysis, Pricing Analysis, Company Market Share Analysis, Standards of Measurement, Global versus Regional and Vendor Share Analysis. To know more about the research methodology, drop in an inquiry to speak to our industry experts.
Customization Available
Data Bridge Market Research is a leader in advanced formative research. We take pride in servicing our existing and new customers with data and analysis that match and suits their goal. The report can be customized to include price trend analysis of target brands understanding the market for additional countries (ask for the list of countries), clinical trial results data, literature review, refurbished market and product base analysis. Market analysis of target competitors can be analyzed from technology-based analysis to market portfolio strategies. We can add as many competitors that you require data about in the format and data style you are looking for. Our team of analysts can also provide you data in crude raw excel files pivot tables (Fact book) or can assist you in creating presentations from the data sets available in the report.

