
Middle East And Africa Q Pcr Reagents Market
Market Size in USD Million
 USD
24.94 Million
USD
34.92 Million
2025
2033
USD
24.94 Million
USD
34.92 Million
2025
2033
| 2026 - 2033 | |
| USD 24.94 Million | |
| USD 34.92 Million | |
| % | |
|
Middle East and Africa q-PCR Reagents Market Overview
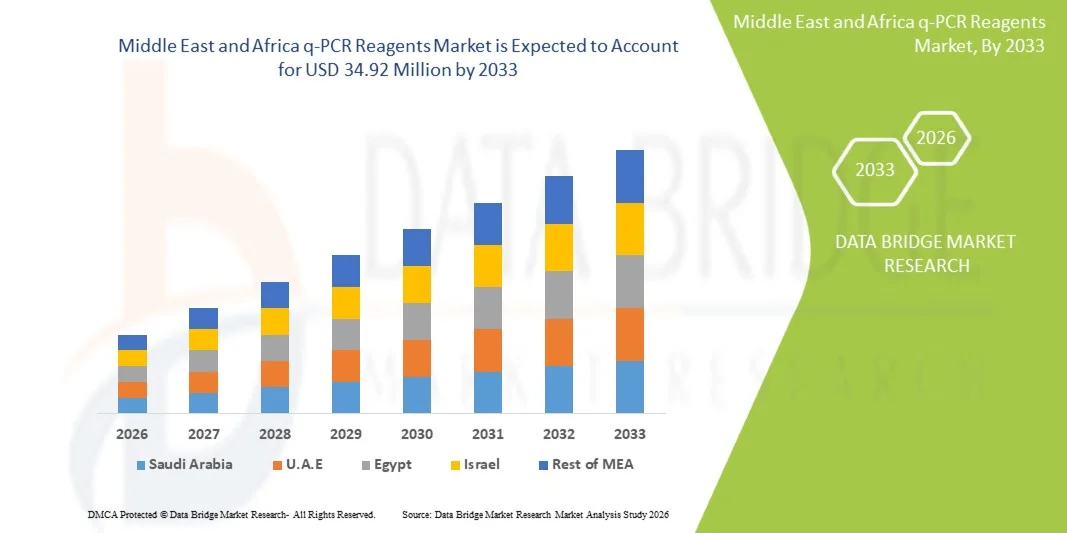
The Middle East and Africa q-PCR reagents market was valued at USD 24.94 million in 2025 and is projected to reach USD 34.92 million by 2033, growing at a CAGR of 4.3% from 2026 to 2033. The market is witnessing steady expansion driven by increasing adoption of molecular diagnostics, rising prevalence of infectious and chronic diseases, and growing investment in advanced laboratory infrastructure across key countries in the region. Strengthening healthcare systems and expanding access to real-time diagnostic technologies are further supporting market growth.
The increasing burden of diseases such as tuberculosis, HIV, and emerging viral infections, along with rising demand for early and accurate detection methods, is encouraging hospitals, diagnostic laboratories, and research institutions to adopt q-PCR-based testing solutions. In addition, government initiatives aimed at improving public health surveillance, coupled with growing partnerships between global biotechnology firms and regional healthcare providers, are accelerating the uptake of q-PCR reagents across clinical and research applications in the Middle East and Africa region.
Key Market Trends & Insights
- Saudi Arabia dominated the Middle East and Africa q-PCR reagents market with the largest revenue share of 32.8% in 2025, supported by large-scale healthcare transformation programs, expanding molecular diagnostic infrastructure, and strong government-backed investment in advanced laboratory services under national healthcare strategies.
- The Probe-Based Reagents segment led the market with a 58.4% share in 2025, driven by higher specificity, superior sensitivity, and strong clinical reliability in infectious disease and oncology diagnostics.
- South Africa is expected to be the fastest-growing region at a CAGR of 18.6% from 2026 to 2033, fueled by high burden of infectious diseases, improving access to molecular testing, and expansion of public-private diagnostic laboratory collaborations.
- Dye-Based Reagents are the fastest-growing detection type, projected to register a CAGR of 6.7%, reflecting the surge in demand for lower cost, ease of use, and increasing adoption in academic and resource-limited laboratories.
- The Qpcr Singleplex Test/Assay segment dominated the assay type category with a 52.9% revenue share in 2025, led by its simplicity, high accuracy, and widespread use in routine diagnostic testing.
- Kits accounted for 61.3% of the market, preferred by the convenience, standardized formulation, and wide use in clinical diagnostics.
- The miRNA Analysis segment is the fastest-growing technology category, with a CAGR of 7.1%, driven by increasing research in cancer diagnostics and personalized medicine.
Market Size & Forecast
- Global Market Value (2025): USD 24.94 Million
- Expected Market Value (2033): USD 34.92 Million
- Forecast CAGR (2026–2033): 4.3%
- Leading Country in 2025: Saudi Arabia
- Fastest Growing Country: South Africa
Report Scope and Global Middle East and Africa q-PCR Reagents Market Segmentation
|
Attributes |
Middle East and Africa q-PCR Reagents Key Market Insights |
|
Segments Covered |
· By Plexity: Singleplex and Multiplex Assays
|
|
Countries Covered |
Middle East and Africa · Saudi Arabia · U.A.E. · South Africa · Egypt · Israel · Rest of Middle East and Africa |
|
Key Market Players |
· Thermo Fisher Scientific Inc. (U.S.) · Bio-Rad Laboratories, Inc. (U.S.) · QIAGEN (Netherlands) · Takara Bio Inc. (Japan) · Agilent Technologies, Inc. (U.S.) · F. Hoffmann-La Roche Ltd (Switzerland) · Merck KGaA (Germany) · Promega Corporation (U.S.) · Abbott (U.S.) · BD (U.S.) · Seegene Inc. (South Korea) · Bioneer Corporation (South Korea) · MiRXES Pte Ltd (Singapore) · BioMérieux (France) · New England Biolabs, Inc. (U.S.) · Enzo Biochem, Inc. (U.S.) · Sino Biological Inc. (China) · GeneDireX, Inc. (Taiwan) · Norgen Biotek Corp (Canada) · Takara Holdings Inc. (Japan) |
|
Market Opportunities |
· Expansion of precision oncology programs · Growing adoption of decentralized and point-of-care molecular testing · Increasing investment in veterinary and zoonotic disease surveillance |
|
Value Added Data Infosets |
In addition to the insights on market scenarios such as market value, growth rate, segmentation, geographical coverage, and major players, the market reports curated by the Data Bridge Market Research also include in-depth expert analysis, patient epidemiology, pipeline analysis, pricing analysis, and regulatory framework. |
Middle East and Africa q-PCR Reagents Market Trends
Trend: Expansion of Molecular Diagnostic Infrastructure in Hospitals
Hospitals and reference laboratories across the Middle East and Africa are increasingly adopting q-PCR reagents to strengthen molecular diagnostic capabilities for infectious disease detection and oncology screening. The integration of automated real-time PCR platforms is improving testing accuracy, turnaround time, and workflow efficiency in clinical laboratories. Government-backed healthcare modernization programs are further accelerating the installation of advanced diagnostic systems, for instance Saudi Arabia’s National Health Transformation Program and the UAE’s investment in genomic medicine are enhancing adoption of high-throughput q-PCR testing solutions.
Middle East and Africa q-PCR Reagents Market Dynamics
Key Market Driver: Rising Burden of Infectious Diseases and Screening Demand
The increasing prevalence of infectious diseases such as tuberculosis, HIV, hepatitis, and emerging viral infections is significantly driving demand for q-PCR reagents across Middle East and African healthcare systems. Growing emphasis on early and accurate disease detection is pushing hospitals and diagnostic laboratories to adopt real-time PCR-based testing over conventional methods. Expansion of public health screening programs and international funding support is further strengthening diagnostic capacity, for instance South Africa’s HIV/TB testing programs and Nigeria’s infectious disease surveillance initiatives are boosting large-scale q-PCR reagent utilization.
Key Restraint/Challenge: High Cost and Limited Laboratory Infrastructure in Low-Income Countries
A major restraint in the Middle East and Africa q-PCR reagents market is the high cost of molecular diagnostic systems and limited laboratory infrastructure in several low-income countries, which restricts widespread adoption. The need for specialized equipment, skilled personnel, and continuous reagent supply creates operational challenges for smaller diagnostic centers and rural healthcare facilities. Supply chain inconsistencies and dependence on imported reagents further increase costs and limit accessibility, for instance in parts of Sub-Saharan Africa and rural Sudan, limited PCR laboratory networks hinder large-scale deployment of advanced molecular testing.
Key Market Opportunity: Expansion of Genomic Research and AI-Driven Diagnostic Platforms
The growing focus on genomic research and integration of AI-based diagnostic platforms presents a significant opportunity for the q-PCR reagents market across Middle East and Africa. Governments and private players are investing in precision medicine, infectious disease surveillance, and data-driven healthcare systems that rely heavily on real-time PCR technologies. Cloud-based laboratory networks and automated interpretation tools are improving scalability and accessibility of molecular testing, for instance UAE’s genomics initiatives and Qatar’s biomedical research programs are enabling advanced q-PCR applications in research and clinical diagnostics.
Middle East and Africa q-PCR Reagents Market Scope
The Middle East and Africa q-PCR reagents market is segmented on the basis of detection type, assay type, plexity, packaging type, technology, application, end user, and distribution channel.
- By Detection Type
On the basis of detection type, the Middle East and Africa q-PCR reagents market is segmented into dye-based reagents and probe-based reagents. The Probe-Based Reagents segment dominated the market with a 58.4% share in 2025, owing to higher specificity, superior sensitivity, and strong clinical reliability in infectious disease and oncology diagnostics. These reagents are widely used in hospital laboratories and reference centers for accurate pathogen identification and genetic testing. Increasing adoption of multiplex testing and automated PCR platforms is further strengthening their demand. Rising prevalence of complex infectious diseases requiring precise detection is boosting usage across Saudi Arabia, UAE, and South Africa. Continuous improvements in fluorescence chemistry and assay stability are enhancing performance efficiency. Their ability to deliver quantitative and reproducible results continues to reinforce market dominance.
The Dye-Based Reagents segment is expected to witness the fastest growth at a CAGR of 6.7% from 2026 to 2033, driven by lower cost, ease of use, and increasing adoption in academic and resource-limited laboratories. These reagents are widely used in basic gene expression studies and preliminary diagnostic screening applications. Expanding research activities in universities and biotechnology institutes is supporting demand. Growing accessibility of q-PCR platforms in emerging African countries is further accelerating uptake. Improvements in dye chemistry are enhancing sensitivity and reducing non-specific amplification. Increasing focus on affordable diagnostic solutions is driving adoption across smaller healthcare facilities.
- By Assay Type
On the basis of assay type, the market is segmented into Qpcr Singleplex Test/Assay and Qpcr Multiplex Test/Assay. The Qpcr Singleplex Test/Assay segment dominated the market with a 52.9% share in 2025, due to its simplicity, high accuracy, and widespread use in routine diagnostic testing. These assays are commonly used for targeted detection of specific pathogens such as TB, HIV, and hepatitis in clinical laboratories. Their low complexity makes them suitable for laboratories with limited technical expertise. Strong adoption in government health programs and hospital-based testing further supports growth. Standardized workflows and lower contamination risk enhance reliability. Continuous demand for disease-specific diagnostics reinforces segment leadership.
The Qpcr Multiplex Test/Assay segment is expected to grow at a CAGR of 7.2% from 2026 to 2033, driven by increasing need for simultaneous detection of multiple pathogens in a single reaction. These assays improve efficiency, reduce turnaround time, and lower overall testing costs. Rising burden of co-infections in Africa is significantly supporting adoption. Advanced laboratory infrastructure in the UAE and Saudi Arabia is enabling higher uptake. Increasing demand for high-throughput screening in pandemic preparedness is further boosting growth. Technological advancements in assay design are improving accuracy and scalability.
- By Plexity
On the basis of plexity, the market is segmented into singleplex and multiplex q-PCR systems. The Singleplex segment dominated the market with a 55.6% share in 2025, driven by its widespread use in routine diagnostic workflows and disease-specific testing protocols. It is preferred in hospital laboratories due to its high precision and ease of interpretation. Lower operational complexity makes it suitable for emerging economies with limited technical resources. Strong adoption in infectious disease screening programs supports continued demand. Standardized testing procedures across public health systems further reinforce usage. Cost-effectiveness compared to multiplex systems ensures its continued dominance.
The Multiplex segment is expected to register the fastest growth at a CAGR of 7.5% from 2026 to 2033, driven by increasing demand for multi-target pathogen detection and improved laboratory efficiency. It enables simultaneous detection of multiple genetic markers in a single reaction, reducing reagent consumption and turnaround time. Rising adoption in advanced hospitals and research institutions is supporting growth. Growing prevalence of complex infections is increasing demand for broader diagnostic coverage. Continuous technological improvements in assay design are enhancing reliability. Expansion of high-throughput diagnostic labs is further accelerating adoption.
- By Packaging Type
On the basis of packaging type, the market is segmented into kits and master mixes. The Kits segment dominated the market with a 61.3% share in 2025, due to convenience, standardized formulation, and wide use in clinical diagnostics. Kits simplify laboratory workflows by providing all required components in a single package. They are extensively used in hospitals and diagnostic centers for routine testing. Strong demand for infectious disease detection is supporting consistent consumption. Regulatory approvals and quality assurance further enhance trust in kit-based systems. Ease of storage and handling strengthens adoption across the region.
The Master Mixes segment is expected to grow at a CAGR of 6.9% from 2026 to 2033, driven by increasing demand for flexible and customizable q-PCR workflows. Master mixes reduce preparation time and improve reaction consistency in high-throughput laboratories. Expanding research activities in universities and biotech institutes are supporting growth. Rising automation in diagnostic labs is increasing preference for ready-to-use reagents. Improved stability and efficiency of modern formulations are enhancing performance. Growing focus on workflow optimization is further accelerating adoption.
- By Technology
On the basis of technology, the market is segmented into gene expression, gene typing, miRNA analysis, pre-amplification, and virus detection. The Virus Detection segment dominated the market with a 46.8% share in 2025, driven by high prevalence of infectious diseases and strong demand for rapid pathogen identification. q-PCR is widely used for detecting viral infections such as COVID-19, HIV, hepatitis, and emerging outbreaks. Government-funded screening programs and hospital testing protocols are supporting large-scale adoption. Strong laboratory infrastructure in GCC countries enhances testing capacity. Continuous need for epidemic preparedness reinforces demand. High accuracy and fast turnaround time make it the preferred diagnostic method.
The miRNA Analysis segment is expected to witness the fastest growth at a 7.1% CAGR from 2026 to 2033, driven by increasing research in cancer diagnostics and personalized medicine. Growing focus on biomarker discovery is supporting adoption in academic and clinical research institutions. Advanced genomic research initiatives in UAE and South Africa are boosting demand. Increasing use in early disease detection and therapeutic monitoring is expanding applications. Technological advancements in RNA analysis are improving sensitivity and reproducibility. Rising investments in precision medicine research are further accelerating growth.
- By Application
On the basis of application, the market is segmented into diagnostics, research, and forensic. The Diagnostics segment dominated the market with a 63.2% share in 2025, driven by widespread use of q-PCR in infectious disease testing and clinical pathology. Hospitals and diagnostic laboratories rely heavily on q-PCR for accurate and rapid disease detection. Strong government healthcare initiatives are supporting diagnostic expansion. Rising burden of communicable diseases is increasing testing volumes. Expansion of private diagnostic chains is further strengthening demand. Continuous need for early disease identification reinforces dominance.
The Research segment is expected to grow at a CAGR of 6.8% from 2026 to 2033, driven by increasing genomic studies and biotechnology research activities. Universities and research institutes are adopting q-PCR for gene expression and molecular biology studies. Expanding funding for biomedical research is supporting growth. Rising interest in personalized medicine is increasing application scope. Advanced laboratory infrastructure in Gulf countries is further boosting adoption. Growing collaboration between academia and industry is accelerating innovation.
- By End User
On the basis of end user, the market is segmented into hospital & diagnostic centers, forensic laboratories, research & academic institutes, clinical research organizations, and others. The Hospital & Diagnostic Centers segment dominated the market with a 57.9% share in 2025, driven by high patient inflow and strong demand for infectious disease diagnostics. These facilities are the primary users of q-PCR reagents for routine clinical testing. Expansion of hospital networks in Saudi Arabia, UAE, and South Africa is supporting growth. Increasing outsourcing of laboratory services is further boosting demand. Strong government healthcare spending is enhancing infrastructure. High testing volumes ensure continuous reagent consumption.
The Research & Academic Institutes segment is expected to grow at a CAGR of 6.6% from 2026 to 2033, driven by increasing genomic research activities and molecular biology studies. Universities are adopting q-PCR for advanced research in genetics and disease mechanisms. Rising government funding for scientific research is supporting expansion. Collaboration with biotech companies is further increasing usage. Expanding research infrastructure in Egypt and South Africa is boosting adoption. Growing focus on innovation in molecular diagnostics is accelerating demand.
- By Distribution Channel
On the basis of distribution channel, the market is segmented into direct tender, third-party distributors, and others. The Direct Tender segment dominated the market with a 49.8% share in 2025, driven by large-scale procurement by government hospitals and public health programs. Bulk purchasing through tenders ensures cost efficiency and supply stability. Strong government involvement in healthcare procurement supports dominance. High-volume testing programs for infectious diseases rely on direct sourcing. Standardized purchasing processes enhance transparency and reliability. Expansion of national diagnostic programs reinforces demand.
The Third-Party Distributors segment is expected to grow at a CAGR of 7.0% from 2026 to 2033, driven by increasing penetration of q-PCR reagents into private laboratories and smaller healthcare facilities. Distributors improve accessibility in remote and underserved regions. Expanding healthcare infrastructure in Africa is supporting growth. Rising demand for faster supply chain logistics is further boosting adoption. Partnerships between global manufacturers and regional distributors are strengthening market reach. Increasing private sector participation is accelerating segment expansion.
Middle East and Africa q-PCR Reagents Market Regional Analysis
Saudi Arabia dominated the Middle East and Africa q-PCR reagents market with the largest revenue share of 32.8% in 2025, supported by large-scale healthcare transformation programs, expanding molecular diagnostic infrastructure, and strong government-backed investment in advanced laboratory services under national healthcare strategies. The country also benefits from significant government investment in advanced laboratory systems, growing implementation of national disease screening programs, and increasing demand for rapid and accurate infectious disease diagnostics. Rising focus on precision medicine, genomic research, and automated testing platforms continues to strengthen Saudi Arabia’s leadership position in the regional q-PCR reagents market.
The Saudi Arabia q-PCR Reagents Market Insight
The Saudi Arabia q-PCR reagents market is witnessing strong growth due to rising investments in healthcare modernization, expanding molecular diagnostic infrastructure, and increasing adoption of real-time PCR technologies across hospitals and reference laboratories. The country’s advanced healthcare ecosystem, along with national screening programs and strong government focus on infectious disease surveillance, is driving demand across clinical diagnostics and research applications. In addition, growing emphasis on precision medicine, genomic research initiatives, and automated laboratory systems is accelerating reagent consumption across major healthcare institutions.
United Arab Emirates q-PCR Reagents Market Insight
The United Arab Emirates q-PCR reagents market remains a key contributor in the Middle East & Africa region, driven by advanced hospital infrastructure, strong biotechnology investments, and high adoption of automated molecular diagnostic platforms. The country’s well-developed healthcare system and focus on precision diagnostics are supporting widespread use of q-PCR in infectious disease testing and oncology applications. Increasing integration of digital health technologies, coupled with rising demand for high-throughput laboratory systems, continues to enhance market growth across clinical and research settings.
South Africa q-PCR Reagents Market Insight
The South Africa q-PCR reagents market is expected to witness rapid growth, driven by a high burden of infectious diseases such as HIV, tuberculosis, and hepatitis, along with increasing investment in molecular diagnostic capabilities. Expanding public-private laboratory networks and growing participation from international health organizations are supporting improved access to advanced testing solutions. Rising awareness regarding early disease detection, along with strengthening healthcare infrastructure and research initiatives, is accelerating adoption of q-PCR technologies across the country.
Egypt q-PCR Reagents Market Insight
The Egypt q-PCR reagents market is expanding steadily due to healthcare system modernization, increasing focus on infectious disease control, and growing deployment of centralized diagnostic laboratories. Rising government initiatives to improve laboratory infrastructure and expand screening programs are driving demand for molecular diagnostic tools. In addition, increasing prevalence of communicable diseases and growing adoption of automated PCR platforms in hospitals and research centers are further supporting market growth across the country.
Middle East and Africa q-PCR Reagents Market Share
The Middle East and Africa q-PCR Reagents industry is primarily led by well-established companies, including:
- Thermo Fisher Scientific Inc. (U.S.)
- Bio-Rad Laboratories, Inc. (U.S.)
- QIAGEN (Netherlands)
- Takara Bio Inc. (Japan)
- Agilent Technologies, Inc. (U.S.)
- Hoffmann-La Roche Ltd (Switzerland)
- Merck KGaA (Germany)
- Promega Corporation (U.S.)
- Abbott (U.S.)
- BD (U.S.)
- Seegene Inc. (South Korea)
- Bioneer Corporation (South Korea)
- MiRXES Pte Ltd (Singapore)
- BioMérieux (France)
- New England Biolabs, Inc. (U.S.)
- Enzo Biochem, Inc. (U.S.)
- Sino Biological Inc. (China)
- GeneDireX, Inc. (Taiwan)
- Norgen Biotek Corp (Canada)
- Takara Holdings Inc. (Japan)
Latest Developments in Middle East and Africa q-PCR Reagents Market
- In November 2025, Thermo Fisher Scientific expanded its RT-qPCR reagent and kit distribution network across Middle East and African laboratory markets, strengthening access to advanced molecular diagnostic solutions for infectious disease testing. The expansion focuses on improving real-time PCR workflow availability in hospitals and reference laboratories, supporting higher testing volumes and faster diagnosis of viral and bacterial infections across the region. This initiative reinforces the company’s strategy to enhance decentralized diagnostic capabilities and improve laboratory preparedness for emerging outbreaks
- In September 2024, Roche expanded its molecular diagnostics and q-PCR reagent supply programs across Middle Eastern healthcare systems, strengthening support for national screening initiatives and hospital laboratory automation. The expansion includes increased deployment of real-time PCR testing solutions for infectious disease and oncology diagnostics, particularly in Saudi Arabia and the United Arab Emirates. This development highlights Roche’s focus on improving precision diagnostics and strengthening laboratory infrastructure across high-demand healthcare markets
- In June 2024, bioMérieux enhanced its molecular diagnostic footprint across African healthcare systems by expanding PCR-based testing support and strengthening partnerships with public health laboratories. The initiative aims to improve early detection of infectious diseases such as tuberculosis and other endemic infections through increased availability of q-PCR technologies. This development supports capacity building in diagnostic networks and improves access to high-quality molecular testing in resource-limited settings
- In March 2023, QIAGEN expanded its real-time PCR reagent and assay availability across Middle East and African markets to support infectious disease surveillance and post-pandemic diagnostic demand. The expansion included improved distribution of q-PCR kits and automated workflow-compatible reagents for hospital and research laboratories. This initiative strengthened regional preparedness for large-scale molecular testing and enhanced laboratory efficiency across clinical settings
- In August 2021, Danaher Corporation, through its molecular diagnostics ecosystem, increased deployment of PCR-based platforms and reagent supply support across Middle East and Africa to strengthen COVID-19 and post-pandemic testing infrastructure. The expansion improved access to high-throughput q-PCR systems in hospitals and public health laboratories, enabling faster and more scalable diagnostic testing. This development reinforced long-term adoption of molecular diagnostics in regional healthcare systems
SKU-

- Interactive Data Analysis Dashboard
- Company Analysis Dashboard for high growth potential opportunities
- Research Analyst Access for customization & queries
- Competitor Analysis with Interactive dashboard
- Latest News, Updates & Trend analysis
- Harness the Power of Benchmark Analysis for Comprehensive Competitor Tracking
Data collection and base year analysis are done using data collection modules with large sample sizes. The stage includes obtaining market information or related data through various sources and strategies. It includes examining and planning all the data acquired from the past in advance. It likewise envelops the examination of information inconsistencies seen across different information sources. The market data is analysed and estimated using market statistical and coherent models. Also, market share analysis and key trend analysis are the major success factors in the market report. To know more, please request an analyst call or drop down your inquiry.
The key research methodology used by DBMR research team is data triangulation which involves data mining, analysis of the impact of data variables on the market and primary (industry expert) validation. Data models include Vendor Positioning Grid, Market Time Line Analysis, Market Overview and Guide, Company Positioning Grid, Patent Analysis, Pricing Analysis, Company Market Share Analysis, Standards of Measurement, Global versus Regional and Vendor Share Analysis. To know more about the research methodology, drop in an inquiry to speak to our industry experts.
Data Bridge Market Research is a leader in advanced formative research. We take pride in servicing our existing and new customers with data and analysis that match and suits their goal. The report can be customized to include price trend analysis of target brands understanding the market for additional countries (ask for the list of countries), clinical trial results data, literature review, refurbished market and product base analysis. Market analysis of target competitors can be analyzed from technology-based analysis to market portfolio strategies. We can add as many competitors that you require data about in the format and data style you are looking for. Our team of analysts can also provide you data in crude raw excel files pivot tables (Fact book) or can assist you in creating presentations from the data sets available in the report.


