
Middle East And Africa Refractories Market
Market Size in USD Billion
 USD
1.99 Billion
USD
2.60 Billion
2025
2033
USD
1.99 Billion
USD
2.60 Billion
2025
2033
| 2026 - 2033 | |
| USD 1.99 Billion | |
| USD 2.60 Billion | |
| % | |
|
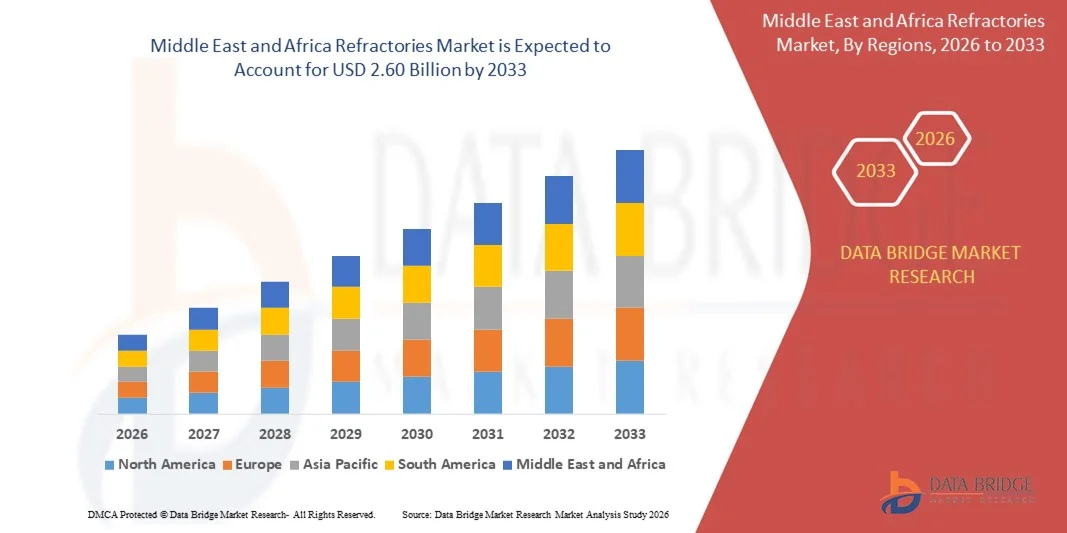
What is the Middle East and Africa Refractories Market Size and Growth Rate?
- The Middle East and Africa refractories market size was valued at USD 1.99 billion in 2025 and is expected to reach USD 2.60 billion by 2033, at a CAGR of 3.60% during the forecast period
- Refractories are available in all shapes and size. Bricks are one of the traditional forms of refractories and have accounted for the majority of refractory production earlier but now monolithic refractories are being widely used due to low cost, durability and easy installation procedure. Refractories market has its wide applicability in industries such as iron and steel, cement & ceramics, non-ferrous metals and others
What are the Major Takeaways of Refractories Market?
- Increasing prevalence for non-metallic minerals industry, growing infrastructure in emerging countries and demand of refractories from iron & steel industry are the factors which will boost the refractories market
- Some companies are expanding their production capacities in different regions to grow their market for these products. Whereas, corrodibility of ferrous metals under environmental conditions is restraining the market growth
- Saudi Arabia dominated the Refractories market with an estimated 36.9% revenue share in 2025, driven by strong demand from steel production, cement manufacturing, glass processing, and energy-intensive industries across the region
- The U.A.E. is projected to register the fastest CAGR of 7.36% from 2026 to 2033, driven by rapid industrial development, growing aluminum and steel processing, and investments in energy, construction, and advanced manufacturing. Increasing adoption of high-performance and monolithic refractories supports accelerated market expansion
- The Acidic & Neutral Refractories segment dominated the market with an estimated 58.6% share in 2025, driven by their extensive use in steel, glass, cement, and non-ferrous metal industries
Report Scope and Refractories Market Segmentation
|
Attributes |
Refractories Key Market Insights |
|
Segments Covered |
|
|
Countries Covered |
Middle East and Africa
|
|
Key Market Players |
|
|
Market Opportunities |
|
|
Value Added Data Infosets |
In addition to the insights on market scenarios such as market value, growth rate, segmentation, geographical coverage, and major players, the market reports curated by the Data Bridge Market Research also include in-depth expert analysis, pricing analysis, brand share analysis, consumer survey, demography analysis, supply chain analysis, value chain analysis, raw material/consumables overview, vendor selection criteria, PESTLE Analysis, Porter Analysis, and regulatory framework. |
What is the Key Trend in the Refractories Market?
Increasing Shift Toward High-Performance, Energy-Efficient, and Application-Specific Refractory Solutions
- The refractories market is witnessing a strong shift toward high-purity, low-impurity, and application-specific refractory materials to meet rising performance and durability requirements in extreme-temperature industrial environments
- Manufacturers are increasingly developing energy-efficient, lightweight, and longer-lifespan refractories, including low-carbon, alumina-based, magnesia-based, and non-oxide refractory solutions
- Growing emphasis on thermal efficiency, reduced downtime, and extended furnace life is driving adoption across steel, cement, glass, and non-ferrous metal industries
- For instance, companies such as RHI Magnesita, Vesuvius, Imerys, Morgan Advanced Materials, and Saint-Gobain are investing in advanced refractory formulations, monolithic refractories, and digitally optimized lining solutions
- Rising demand for custom-engineered refractories tailored to specific furnaces, kilns, and reactors is accelerating innovation
- As industrial processes become more energy-intensive and sustainability-focused, refractories remain critical for operational efficiency and asset protection
What are the Key Drivers of Refractories Market?
- Rising demand from steel, cement, glass, petrochemical, and power generation industries for high-temperature-resistant lining materials
- For instance, during 2024–2025, leading players such as RHI Magnesita, Vesuvius, and Saint-Gobain expanded production capacities and introduced low-carbon refractory solutions to support industrial decarbonization
- Growth in infrastructure development, urbanization, and industrial manufacturing across Asia-Pacific, the Middle East, and Latin America is boosting refractory consumption
- Advancements in refractory raw materials, bonding systems, and monolithic technologies have improved thermal shock resistance and service life
- Increasing replacement demand due to wear, corrosion, and extreme operating conditions supports recurring market demand
- Backed by industrial expansion and modernization of furnaces and kilns, the refractories market is expected to experience stable long-term growth
Which Factor is Challenging the Growth of the Refractories Market?
- Volatility in raw material prices, particularly magnesia, bauxite, and alumina, increases production costs and impacts profit margins
- For instance, during 2024–2025, energy price fluctuations, mining restrictions, and logistics disruptions affected refractory supply chains globally
- Stringent environmental regulations and carbon-emission norms increase compliance costs for manufacturers
- Shortage of skilled labor and high installation complexity can raise operational costs for end users
- Competition from low-cost regional manufacturers, especially in emerging markets, creates pricing pressure
- To address these challenges, companies are focusing on sustainable sourcing, recycling of refractory materials, digital monitoring, and value-added refractory solutions to enhance competitiveness
How is the Refractories Market Segmented?
The market is segmented on the basis of alkalinity, product type, form type, fusion temperature, application and technology.
- By Alkalinity
On the basis of alkalinity, the refractories market is segmented into Acidic & Neutral Refractories and Carbon Refractories. The Acidic & Neutral Refractories segment dominated the market with an estimated 58.6% share in 2025, driven by their extensive use in steel, glass, cement, and non-ferrous metal industries. These refractories, including silica, alumina, and fireclay-based materials, offer strong thermal stability, corrosion resistance, and compatibility with a wide range of industrial slags. Their cost-effectiveness and versatility make them a preferred choice for furnaces, kilns, and reactors operating under neutral or acidic conditions.
The Carbon Refractories segment is expected to grow at the fastest CAGR from 2026 to 2033, supported by rising demand in blast furnaces, electric arc furnaces, and high-temperature steelmaking applications. Superior thermal shock resistance, low wettability, and longer service life are accelerating adoption of carbon-based refractories in advanced metallurgical processes.
- By Form Type
Based on form type, the refractories market is segmented into Bricks, Monolithic, and Others. The Bricks segment dominated the market with a 54.2% share in 2025, owing to their standardized shapes, high mechanical strength, and long-established use in industrial furnaces and kilns. Refractory bricks are widely deployed in steel ladles, cement kilns, glass furnaces, and power plants due to their durability and ease of replacement during maintenance cycles.
The Monolithic segment is projected to grow at the fastest CAGR from 2026 to 2033, driven by increasing preference for castables, gunning mixes, and ramming masses. Monolithic refractories offer faster installation, reduced downtime, improved joint-free linings, and better thermal efficiency. Growing adoption in continuous operations and complex furnace geometries is accelerating the shift toward monolithic solutions across multiple industries.
- By Product Type
On the basis of product type, the refractories market is segmented into Clay and Non-Clay refractories. The Non-Clay segment dominated the market with an estimated 61.7% share in 2025, supported by rising demand for high-performance materials such as alumina, magnesia, zirconia, and carbon-based refractories. These materials offer superior resistance to high temperatures, chemical corrosion, and mechanical stress, making them essential for modern steelmaking and high-end industrial applications.
The Clay refractories segment is expected to grow at the fastest CAGR from 2026 to 2033, driven by cost advantages, easy availability, and increasing usage in small- and medium-scale industrial furnaces. Fireclay refractories continue to find applications in traditional kilns, boilers, and backup linings, especially in emerging economies with expanding manufacturing bases.
- By Fusion Temperature
Based on fusion temperature, the market is segmented into Normal Refractory (1580–1780°C), High Refractory (1780–2000°C), and Super Refractory (>2000°C). The High Refractory segment dominated the market with a 46.9% share in 2025, driven by its widespread use in steel furnaces, cement kilns, and glass melting units requiring sustained high-temperature resistance. These refractories balance performance and cost, making them suitable for most heavy industrial operations.
The Super Refractory segment is projected to grow at the fastest CAGR from 2026 to 2033, supported by rising demand from advanced metallurgical processes, aerospace materials production, and high-purity chemical manufacturing. Increasing focus on extreme-temperature applications and next-generation furnace technologies is driving adoption of ultra-high-temperature refractory materials.
- By Application
On the basis of application, the refractories market is segmented into Iron and Steel, Cement and Lime, Energy and Chemicals, Glass, Non-Ferrous Metals, and Others. The Iron and Steel segment dominated the market with an estimated 38.4% share in 2025, owing to extensive use of refractories in blast furnaces, basic oxygen furnaces, electric arc furnaces, and ladles. Continuous steel production and frequent lining replacement needs ensure sustained demand.
The Energy and Chemicals segment is expected to grow at the fastest CAGR from 2026 to 2033, driven by expansion of petrochemical plants, refineries, waste-to-energy facilities, and hydrogen production units. High resistance to thermal cycling and chemical attack is accelerating refractory adoption in energy-intensive processing environments.
- By Technology
On the basis of technology, the refractories market is segmented into Isostatics and Slide Gates. The Isostatics segment dominated the market with a 55.1% share in 2025, supported by its ability to produce high-density, uniform, and high-strength refractory components. Isostatic pressing ensures superior material integrity, making it ideal for critical furnace linings and high-stress applications.
The Slide Gates segment is projected to grow at the fastest CAGR from 2026 to 2033, driven by increasing demand for precise molten metal flow control in steelmaking and continuous casting operations. Improved safety, efficiency, and process automation are accelerating adoption of advanced slide gate refractory systems across modern metallurgical facilities.
Which Region Holds the Largest Share of the Refractories Market?
- Saudi Arabia dominated the Refractories market with an estimated 36.9% revenue share in 2025, driven by strong demand from steel production, cement manufacturing, glass processing, and energy-intensive industries across the region
- Leading refractory manufacturers in the Saudi Arabia are investing in advanced materials, high-purity refractory solutions, and localized production facilities, strengthening regional supply chains and reducing dependence on imports
- Government-led industrial diversification programs, infrastructure investments, and energy-sector expansion across key MEA economies continue to consolidate the country’s dominant position in the global refractories market
U.A.E. Refractories Market Insight
The U.A.E. is projected to register the fastest CAGR of 7.36% from 2026 to 2033, driven by rapid industrial development, growing aluminum and steel processing, and investments in energy, construction, and advanced manufacturing. Increasing adoption of high-performance and monolithic refractories supports accelerated market expansion.
South Africa Refractories Market Insight
South Africa contributes significantly due to strong demand from mining, iron and steel, cement, and non-ferrous metal industries. Established metallurgical infrastructure and ongoing furnace modernization projects support steady refractory consumption.
Which are the Top Companies in Refractories Market?
The refractories industry is primarily led by well-established companies, including:
- Saint-Gobain Performance Ceramics & Refractories (PCR) (France)
- Morgan Advanced Materials (U.K.)
- Vesuvius (U.K.)
- Imerys (France)
- RHI Magnesita GmbH (Austria)
- Puyang Refractories Group Co., Ltd (China)
SKU-

- Interactive Data Analysis Dashboard
- Company Analysis Dashboard for high growth potential opportunities
- Research Analyst Access for customization & queries
- Competitor Analysis with Interactive dashboard
- Latest News, Updates & Trend analysis
- Harness the Power of Benchmark Analysis for Comprehensive Competitor Tracking
Middle East And Africa Refractories Market, Supply Chain Analysis and Ecosystem Framework
To support market growth and help clients navigate the impact of geopolitical shifts, DBMR has integrated in-depth supply chain analysis into its Middle East And Africa Refractories Market research reports. This addition empowers clients to respond effectively to global changes affecting their industries. The supply chain analysis section includes detailed insights such as Middle East And Africa Refractories Market consumption and production by country, price trend analysis, the impact of tariffs and geopolitical developments, and import and export trends by country and HSN code. It also highlights major suppliers with data on production capacity and company profiles, as well as key importers and exporters. In addition to research, DBMR offers specialized supply chain consulting services backed by over a decade of experience, providing solutions like supplier discovery, supplier risk assessment, price trend analysis, impact evaluation of inflation and trade route changes, and comprehensive market trend analysis.
Data collection and base year analysis are done using data collection modules with large sample sizes. The stage includes obtaining market information or related data through various sources and strategies. It includes examining and planning all the data acquired from the past in advance. It likewise envelops the examination of information inconsistencies seen across different information sources. The market data is analysed and estimated using market statistical and coherent models. Also, market share analysis and key trend analysis are the major success factors in the market report. To know more, please request an analyst call or drop down your inquiry.
The key research methodology used by DBMR research team is data triangulation which involves data mining, analysis of the impact of data variables on the market and primary (industry expert) validation. Data models include Vendor Positioning Grid, Market Time Line Analysis, Market Overview and Guide, Company Positioning Grid, Patent Analysis, Pricing Analysis, Company Market Share Analysis, Standards of Measurement, Global versus Regional and Vendor Share Analysis. To know more about the research methodology, drop in an inquiry to speak to our industry experts.
Data Bridge Market Research is a leader in advanced formative research. We take pride in servicing our existing and new customers with data and analysis that match and suits their goal. The report can be customized to include price trend analysis of target brands understanding the market for additional countries (ask for the list of countries), clinical trial results data, literature review, refurbished market and product base analysis. Market analysis of target competitors can be analyzed from technology-based analysis to market portfolio strategies. We can add as many competitors that you require data about in the format and data style you are looking for. Our team of analysts can also provide you data in crude raw excel files pivot tables (Fact book) or can assist you in creating presentations from the data sets available in the report.


