
Middle East And Africa Restaurant Pos Software Market
Market Size in USD Million
 USD
328.13 Million
USD
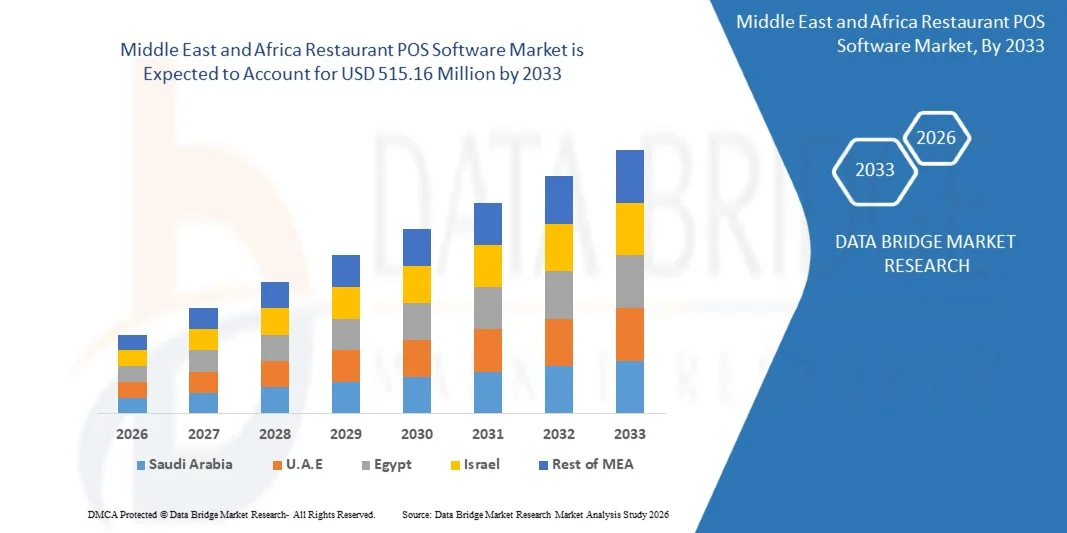
515.16 Million
2025
2033
USD
328.13 Million
USD
515.16 Million
2025
2033
| 2026 - 2033 | |
| USD 328.13 Million | |
| USD 515.16 Million | |
| % | |
|
Middle East and Africa Restaurant POS Software Market Size
- The Middle East and Africa restaurant POS software market size was valued at USD 328.13 million in 2025 and is expected to reach USD 515.16 million by 2033, at a CAGR of 5.80% during the forecast period
- The market growth is largely fuelled by the increasing adoption of digital payment solutions, cloud-based POS systems, and integration with mobile ordering and delivery platforms
- Rising demand for efficient restaurant management, improved customer experience, and data-driven insights is further driving market expansion
Middle East and Africa Restaurant POS Software Market Analysis
- Continuous technological advancements, such as AI-powered analytics, contactless payments, and mobile POS applications, are shaping product development and adoption trends
- Increasing consumer preference for faster service, seamless payment options, and personalized dining experiences is encouraging restaurants to upgrade their POS systems and adopt advanced features
- U.A.E. dominated the restaurant POS software market with the largest revenue share in 2025, supported by the growing number of fine-dining and quick-service restaurants, rising tourism, and adoption of cloud and mobile POS solutions
- Saudi Arabia is expected to witness the highest compound annual growth rate (CAGR) in the Middle East and Africa restaurant POS software market due to increasing investments in smart restaurant infrastructure, rising focus on digital transformation in foodservice, and the growing demand for contactless payments and AI-driven analytics in restaurant operations
- The software segment held the largest market revenue share in 2025, driven by the increasing adoption of cloud-based POS applications and advanced analytics tools. Software solutions offer centralized management, real-time reporting, and seamless integration with payment gateways, enhancing operational efficiency for restaurant operators
Report Scope and Middle East and Africa Restaurant POS Software Market Segmentation
|
Attributes |
Middle East and Africa Restaurant POS Software Key Market Insights |
|
Segments Covered |
|
|
Countries Covered |
Middle East and Africa
|
|
Key Market Players |
|
|
Market Opportunities |
|
|
Value Added Data Infosets |
In addition to the market insights such as market value, growth rate, market segments, geographical coverage, market players, and market scenario, the market report curated by the Data Bridge Market Research team includes in-depth expert analysis, import/export analysis, pricing analysis, production consumption analysis, and pestle analysis. |
Middle East and Africa Restaurant POS Software Market Trends
“Rise of Cloud-Based And AI-Driven POS Solutions”
• The growing shift toward cloud-based restaurant POS software is transforming the foodservice technology landscape by enabling real-time order management, inventory tracking, and analytics. These systems allow immediate operational decisions, particularly in multi-location restaurants, improving efficiency and reducing errors. They also provide centralized reporting and insights, helping operators identify trends, optimize staffing, and make data-driven menu adjustments
• Increasing demand for AI-driven features, such as predictive sales analytics, dynamic menu suggestions, and personalized promotions, is accelerating the adoption of smart POS platforms. These tools help optimize revenue, reduce food waste, and enhance overall customer experience. AI integration further enables automated upselling, demand forecasting, and loyalty program personalization, boosting operational profitability
• The affordability, ease of deployment, and scalability of modern POS solutions are making them attractive for small and mid-sized restaurants. Operators benefit from centralized management without heavy upfront infrastructure costs, supporting digital transformation in the sector. In addition, subscription-based pricing models reduce financial risk and enable rapid technology adoption across multiple outlets
• For instance, several restaurant chains implementing cloud-based POS platforms reported improved table turnover, streamlined kitchen operations, and higher customer satisfaction due to faster service and data-driven decision-making. Enhanced mobile ordering and contactless payment options further contributed to operational efficiency and increased sales during peak hours
• While cloud-based and AI-enabled POS solutions are driving operational efficiency, their impact depends on continued innovation, cybersecurity, user training, and seamless integration with payment gateways and third-party apps. Future enhancements such as IoT device integration and advanced analytics dashboards are expected to further optimize restaurant workflows
Middle East and Africa Restaurant POS Software Market Dynamics
Driver
“Rising Digitalization In The Foodservice Industry And Focus On Operational Efficiency”
• The expansion of digital tools in restaurants is pushing operators to adopt advanced POS systems for automated order processing, inventory management, and integrated payment solutions. This trend is significantly boosting market adoption. Improved data visibility also supports better decision-making for promotions, staffing, and menu optimization
• Consumers increasingly expect faster service, personalized offers, and seamless payment experiences, driving demand for POS solutions with advanced analytics and customer relationship management features. POS systems equipped with CRM capabilities allow restaurants to track guest preferences, boost repeat visits, and enhance loyalty program effectiveness
• Growing investments in cloud computing, mobile ordering, and AI-based predictive systems are supporting the deployment of high-performance POS platforms that optimize restaurant operations and reduce costs. These investments also facilitate scalable solutions for multi-location chains, enabling consistent operational standards and reporting
• Increasing competition among foodservice operators encourages the adoption of POS systems to improve efficiency, reduce human errors, and enhance customer loyalty through data-driven insights. Restaurants adopting innovative POS technologies gain a competitive edge through faster service, personalized promotions, and higher overall guest satisfaction
• For instance, a chain of quick-service restaurants improved table turnover and upselling rates after integrating AI-assisted POS solutions. The system provided real-time sales analytics, automated menu recommendations based on customer preferences, and predictive inventory alerts. This led to reduced food wastage, optimized staff allocation, and enhanced customer satisfaction. In addition, management reported higher revenue per table and faster service times, demonstrating the tangible operational and financial benefits of AI-enabled POS adoption
• While technological adoption is fueling market growth, maintaining software reliability, system security, and user-friendliness remains critical for sustained expansion. Ensuring seamless integration with third-party platforms, payment processors, and online ordering systems is essential for maximizing the value of POS solutions
Restraint/Challenge
“High Software Costs And Integration Complexities”
• The high price of advanced POS software, especially with AI and cloud capabilities, limits adoption among smaller restaurants and independent operators. Subscription fees and ongoing maintenance costs can be prohibitive. In addition, costs for hardware, mobile devices, and peripheral equipment add to overall investment
• Integration challenges with existing restaurant management systems, payment gateways, and third-party apps can delay deployment and increase operational complexity. Legacy systems often require customization and data migration, extending implementation timelines and increasing costs
• Frequent updates, cybersecurity risks, and the need for staff training further complicate adoption, particularly in establishments with limited technical expertise. Without proper training, staff may face operational inefficiencies, impacting service quality and customer experience
• Limited internet connectivity in certain areas can affect the functionality of cloud-based systems, reducing reliability and user confidence. Network disruptions can interrupt order processing, inventory updates, and payment transactions, highlighting the need for hybrid or offline-capable solutions
• For instance, several small restaurant chains faced delays and higher costs when integrating AI-enabled POS software with legacy inventory and payment systems, highlighting the need for robust, user-friendly, and scalable solutions
• While POS technologies continue to evolve, addressing affordability, integration ease, and system robustness is crucial to unlocking the full growth potential of the global restaurant POS software market. Companies that invest in secure, user-friendly, and scalable platforms are better positioned to capture expanding market opportunities
Middle East and Africa Restaurant POS Software Market Scope
The market is segmented on the basis of component, type, operating system, usage, application, enterprise size, deployment mode, and restaurant type.
• By Component
On the basis of component, the Middle East and Africa restaurant POS software market is segmented into software, hardware, and services. The software segment held the largest market revenue share in 2025, driven by the increasing adoption of cloud-based POS applications and advanced analytics tools. Software solutions offer centralized management, real-time reporting, and seamless integration with payment gateways, enhancing operational efficiency for restaurant operators.
The hardware segment is expected to witness the fastest growth rate from 2026 to 2033, propelled by demand for modern terminals, tablets, and self-service kiosks. Hardware innovations such as touch-screen interfaces, durable tablets, and mobile POS devices improve usability, reduce transaction times, and support multi-location management, making them essential for both full-service and quick-service restaurants.
• By Type
On the basis of type, the Middle East and Africa restaurant POS software market is segmented into terminal POS system, tablet POS system, mobile POS system, online POS system, self-service kiosk POS system, and others. The terminal POS system segment held the largest market revenue share in 2025, driven by its reliability, robust hardware, and compatibility with various restaurant operations. Terminal systems offer fast processing, secure transactions, and integration with peripherals, making them suitable for high-volume establishments.
The tablet POS system segment is expected to witness the fastest growth rate from 2026 to 2033, fueled by increasing adoption in small and medium-sized restaurants. Tablet-based systems provide portability, intuitive touch interfaces, and easy cloud connectivity, enabling staff mobility, quicker service, and simplified multi-location management.
• By Operating System
On the basis of operating system, the Middle East and Africa restaurant POS software market is segmented into Android, MAC, DOS system, Windows system, and Linux system. The Android segment held the largest share in 2025, driven by its affordability, flexibility, and compatibility with mobile POS and tablet-based solutions. Android systems offer easy app integration, frequent updates, and user-friendly interfaces, supporting efficient restaurant operations.
The Windows system segment is expected to witness the fastest growth from 2026 to 2033 due to its reliability, extensive software compatibility, and widespread adoption in enterprise-level POS deployments. Windows-based systems support advanced analytics, reporting, and peripheral connectivity, enhancing operational control and scalability.
• By Usage
On the basis of usage, the Middle East and Africa restaurant POS software market is segmented into online and offline. The online segment held the largest share in 2025, driven by increasing demand for cloud-based solutions, real-time order processing, and remote management. Online POS systems enable data synchronization across multiple locations, integration with e-commerce platforms, and access to predictive analytics.
The offline segment is expected to witness significant growth from 2026 to 2033, particularly in regions with intermittent internet connectivity. Offline POS systems provide uninterrupted operations during network downtime, ensuring order accuracy and continuous business operations.
• By Application
On the basis of application, the Middle East and Africa restaurant POS software market is segmented into inventory management, reporting and analytics, employee clocking, tablet compatibility, receipt printing, menu building, account integration, debit/credit card processing, and others. The reporting and analytics segment held the largest share in 2025, driven by the growing need for data-driven decision-making and operational optimization.
The inventory management segment is expected to witness the fastest growth rate from 2026 to 2033, as restaurants seek to minimize waste, monitor stock levels, and optimize supply chain operations. Other applications, such as menu building and debit/credit card processing, are also contributing to improved customer experiences and streamlined operations.
• By Enterprise Size
On the basis of enterprise size, the Middle East and Africa restaurant POS software market is segmented into large enterprises and SMEs. The large enterprises segment held the largest revenue share in 2025, driven by multi-location operations and the need for integrated POS solutions that support advanced analytics, reporting, and centralized management.
The SMEs segment is expected to witness the fastest growth rate from 2026 to 2033, fueled by the affordability and scalability of modern cloud-based POS systems. SMEs benefit from flexible pricing models, ease of deployment, and access to AI-powered tools for operational efficiency and customer engagement.
• By Deployment Mode
On the basis of deployment mode, the Middle East and Africa restaurant POS software market is segmented into cloud and on-premise. The cloud segment held the largest share in 2025, driven by the growing adoption of SaaS-based POS solutions, which offer real-time access, remote management, and automatic updates.
The on-premise segment is expected to witness significant growth from 2026 to 2033, particularly among restaurants prioritizing data security, offline operations, and customized solutions. On-premise POS systems allow full control over software, hardware, and data management, providing reliability and compliance with internal policies.
• By Restaurant Type
On the basis of restaurant type, the Middle East and Africa restaurant POS software market is segmented into full-service restaurants (FSR) and quick-service restaurants (QSR). The quick-service restaurants segment held the largest share in 2025, driven by the need for fast order processing, high throughput, and integrated payment systems to support customer convenience.
The full-service restaurants segment is expected to witness the fastest growth rate from 2026 to 2033, fueled by adoption of advanced POS solutions for table management, customer personalization, and enhanced reporting. Full-service establishments leverage POS platforms to improve service quality, optimize staff allocation, and enhance the overall dining experience.
Middle East and Africa Restaurant POS Software Market Regional Analysis
• U.A.E. dominated the restaurant POS software market with the largest revenue share in 2025, supported by the growing number of fine-dining and quick-service restaurants, rising tourism, and adoption of cloud and mobile POS solutions
• Restaurants in the country highly value real-time reporting, seamless payment integration, and efficient inventory management, improving operational workflows and customer satisfaction
• This adoption is further bolstered by increased investments in smart restaurant technologies, the expanding hospitality sector, and growing consumer expectations for faster, digital-first dining experiences
Saudi Arabia Restaurant POS Software Market Insight
The Saudi Arabia restaurant POS software market is expected to witness the fastest growth from 2026 to 2033, driven by digital transformation in the hospitality sector, rising smartphone penetration, and the shift toward cashless payments. Restaurants are leveraging AI-enabled POS systems to enhance operational efficiency, improve guest engagement, and optimize menu offerings. Growing adoption of cloud platforms and mobile POS devices is further accelerating market growth
Middle East and Africa Restaurant POS Software Market Share
The Middle East and Africa restaurant POS software industry is primarily led by well-established companies, including:
- POSRocket (U.A.E.)
- Ezetap POS (South Africa)
- iKhokha (South Africa)
- Instapay POS (U.A.E.)
- PayTabs POS (U.A.E.)
- Tabby POS (U.A.E.)
- Barq POS (Egypt)
- TillPOS (South Africa)
- MPOS Solutions (U.A.E.)
- PaySpace POS (South Africa)
SKU-

- Interactive Data Analysis Dashboard
- Company Analysis Dashboard for high growth potential opportunities
- Research Analyst Access for customization & queries
- Competitor Analysis with Interactive dashboard
- Latest News, Updates & Trend analysis
- Harness the Power of Benchmark Analysis for Comprehensive Competitor Tracking
Data collection and base year analysis are done using data collection modules with large sample sizes. The stage includes obtaining market information or related data through various sources and strategies. It includes examining and planning all the data acquired from the past in advance. It likewise envelops the examination of information inconsistencies seen across different information sources. The market data is analysed and estimated using market statistical and coherent models. Also, market share analysis and key trend analysis are the major success factors in the market report. To know more, please request an analyst call or drop down your inquiry.
The key research methodology used by DBMR research team is data triangulation which involves data mining, analysis of the impact of data variables on the market and primary (industry expert) validation. Data models include Vendor Positioning Grid, Market Time Line Analysis, Market Overview and Guide, Company Positioning Grid, Patent Analysis, Pricing Analysis, Company Market Share Analysis, Standards of Measurement, Global versus Regional and Vendor Share Analysis. To know more about the research methodology, drop in an inquiry to speak to our industry experts.
Data Bridge Market Research is a leader in advanced formative research. We take pride in servicing our existing and new customers with data and analysis that match and suits their goal. The report can be customized to include price trend analysis of target brands understanding the market for additional countries (ask for the list of countries), clinical trial results data, literature review, refurbished market and product base analysis. Market analysis of target competitors can be analyzed from technology-based analysis to market portfolio strategies. We can add as many competitors that you require data about in the format and data style you are looking for. Our team of analysts can also provide you data in crude raw excel files pivot tables (Fact book) or can assist you in creating presentations from the data sets available in the report.


